Sales Forecast Accuracy: What Good Looks Like and How to Get There
You're sitting in the board meeting. The slide says $4.2M committed. The quarter closes at $3.1M. The CEO wants to know what happened, and your CRO is explaining that "a few deals slipped."
This isn't a hypothetical - it's the state of sales forecast accuracy in 2026. 4 in 5 sales and finance leaders missed a quarterly forecast in the past year, and over half missed two or more times. 98% of those leaders acknowledge they struggle to formulate accurate forecasts, yet 95% say they're confident planning with their existing forecasts. That gap between confidence and reality is where pipeline surprises live.
Quick Summary
- Forrester's bar: ±5% variance is excellent, ±10% is good. Optifai's benchmark data puts many orgs in the ±15-25% range.
- Rep roll-up is the worst method (±25-35% variance). Weighted pipeline with historical calibration is the best method most teams can actually implement.
- Forecast accuracy decays 5-8% per month as the horizon extends. Your 90-day forecast is structurally worse than your 30-day - that's math, not a skills problem.
- Fix your CRM data before buying a forecasting platform. Stale pipeline inflates every forecast.
- Lock your forecast on day 1 of the quarter. Compare actuals to the locked number. Do this for four quarters and you have a baseline.
What Is Forecast Accuracy?
Sales forecast accuracy measures how close your predicted revenue lands to actual results. It's the gap between what you told the board and what actually closed.
The standard formula:
Forecast Accuracy % = (1 - |Actual - Forecast| / Actual) x 100
You forecast $4M for the quarter. You close $3.5M. The absolute error is $500K, divided by the $3.5M actual = 14.3% error. That gives you 85.7% accuracy. Not terrible, not great - and a common outcome for many B2B teams.
The formula looks simple. The hard part is everything upstream: which deals you include, how you weight them, and whether the data underneath those deals is real. A forecast built on contacts who changed jobs three months ago isn't a forecast. It's fiction with a spreadsheet attached.
Why Most Forecasts Miss
The data problem starts inside your CRM. 66% of leaders say their reporting systems can't access historical CRM and performance data - the exact data you'd need to calibrate forecasts against past results. Without that feedback loop, every quarter is a fresh guess.

The bigger issue is that buying behavior has become genuinely harder to predict. The average B2B buying team now includes 9 stakeholders. Gartner's research shows buyers spend just 17% of their buying time meeting with vendors - and 75% say they'd prefer a rep-free experience entirely. Your reps are forecasting deals where they have visibility into a fraction of the decision process.
Then there's indecision. Research from "The JOLT Effect" analyzed 2.5M+ sales calls and found 90% contained markers of customer indecision. Not objection - indecision. Deals that look alive in your pipeline are stalling because the buying committee can't align, not because your rep lost a competitive bake-off. That's nearly impossible to forecast from a stage-based CRM view.
Layer on the fact that B2B contact data decays every year - people change jobs, get promoted, leave companies - and you've got a pipeline built on contacts who aren't even at the company anymore. Every one of those ghost contacts inflates your forecast.
How to Measure Forecasting Accuracy
The Core Formulas
Here's a simplified five-deal quarter:
| Deal | Forecast | Actual | Abs Error | % Error |
|---|---|---|---|---|
| Acme Corp | $80K | $75K | $5K | 6.7% |
| Beta Inc | $120K | $95K | $25K | 26.3% |
| Gamma Ltd | $50K | $55K | $5K | 9.1% |
| Delta Co | $200K | $180K | $20K | 11.1% |
| Epsilon | $40K | $0 | $40K | 100% |
MAPE (Mean Absolute Percentage Error) = average of the % Error column = (6.7 + 26.3 + 9.1 + 11.1 + 100) / 5 = 30.6%
Forecast Accuracy % at the portfolio level: you forecast $490K total, closed $405K. Accuracy = (1 - 85/405) x 100 = 79%.
Notice the difference. MAPE punishes the Epsilon deal heavily. Portfolio-level accuracy smooths it out. Both are useful - MAPE tells you about deal-level prediction quality, portfolio accuracy tells you how close the topline landed.
One more concept worth tracking: bias. If your team consistently forecasts $500K and closes $420K, you don't just have an accuracy problem - you have systematic over-forecasting bias. Bias is directional; accuracy is magnitude. A team that's always 15% high is actually easier to fix than a team that's randomly 15% high or low.
The Locked Forecast Rule
Most teams cheat without realizing it. They adjust the forecast mid-quarter, then measure accuracy against the revised number. Of course it's accurate - you moved the goalposts.
The right approach, as Count.co outlines, is to lock your forecast on day one of the quarter. That locked number is what you measure against. Period. Mid-quarter revisions are fine for operational planning, but they aren't your accuracy benchmark.
We've seen teams go from "we have no idea how accurate we are" to "we know exactly who's sandbagging and who has happy ears" in two quarters, just by locking the number and tracking per rep. If a rep is consistently 15% high, apply a 0.85 correction factor to their commits - that's calibration, and it works immediately.
For a deeper look at tooling, see our breakdown of sales forecasting solutions and best sales forecasting tools.
Your forecast is only as accurate as the contacts behind it. Stale data - job changes, departed employees, dead emails - inflates pipeline and wrecks predictions. Prospeo refreshes 300M+ profiles every 7 days with 98% email accuracy, so every deal in your CRM is attached to someone who's actually there.
Stop forecasting against contacts who left the company six months ago.
Benchmarks by Tier and Method
By Performance Tier
Based on Optifai's benchmark data (N=939 companies) and Forrester's grading framework:
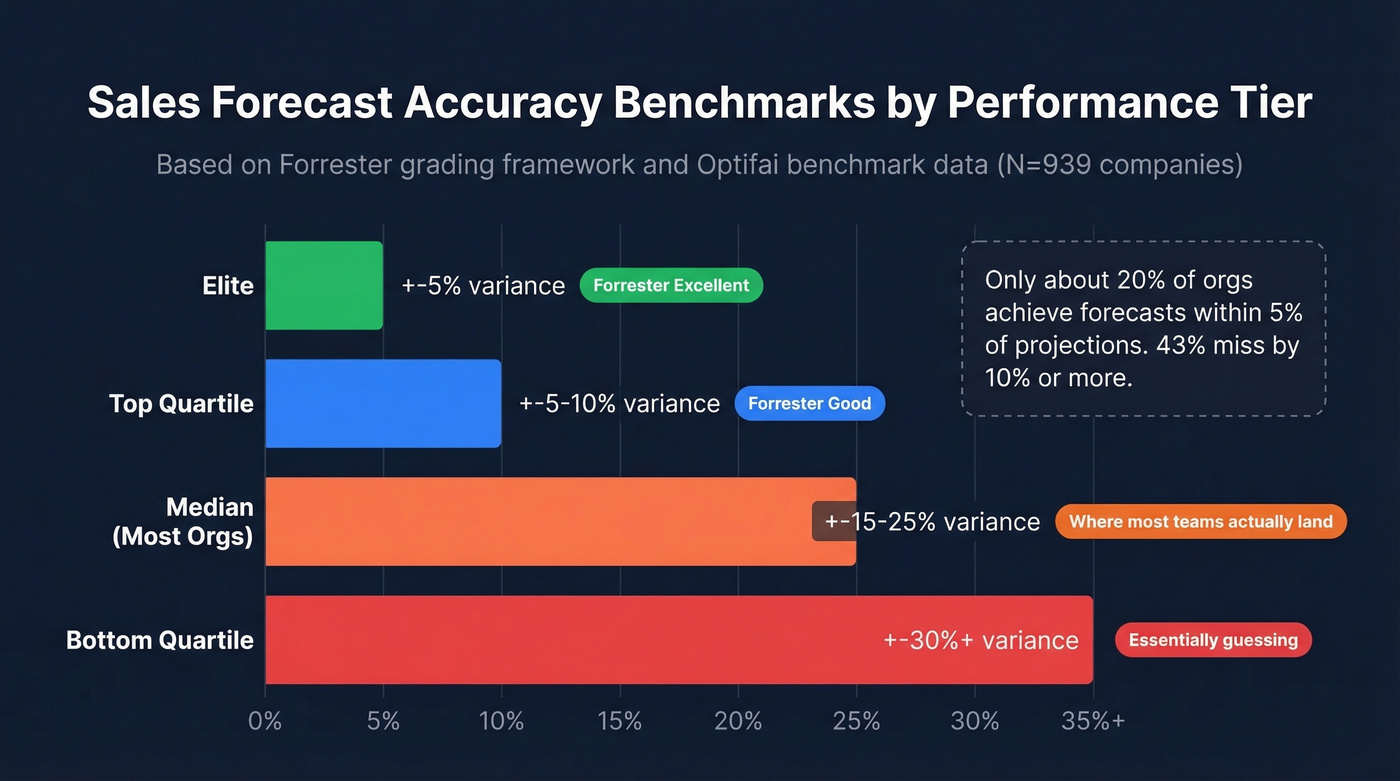
| Tier | Variance | What It Means |
|---|---|---|
| Elite | ±5% | Forrester "excellent" |
| Top quartile | ±5-10% | Forrester "good" |
| Median | ±15-25% | Where most orgs sit |
| Bottom quartile | ±30%+ | Essentially guessing |
Only about 20% of organizations achieve forecasts within 5% of projections. 43% miss by 10% or more. If you're in the ±15-25% range, you're average - which means there's real room to improve, but you're not an outlier.
By Forecast Horizon
| Horizon | Typical Accuracy | Notes |
|---|---|---|
| 30-day | 85-90% | Best visibility |
| 60-day | 75-80% | Noticeable decay |
| 90-day | 65-75% | Structural limit |
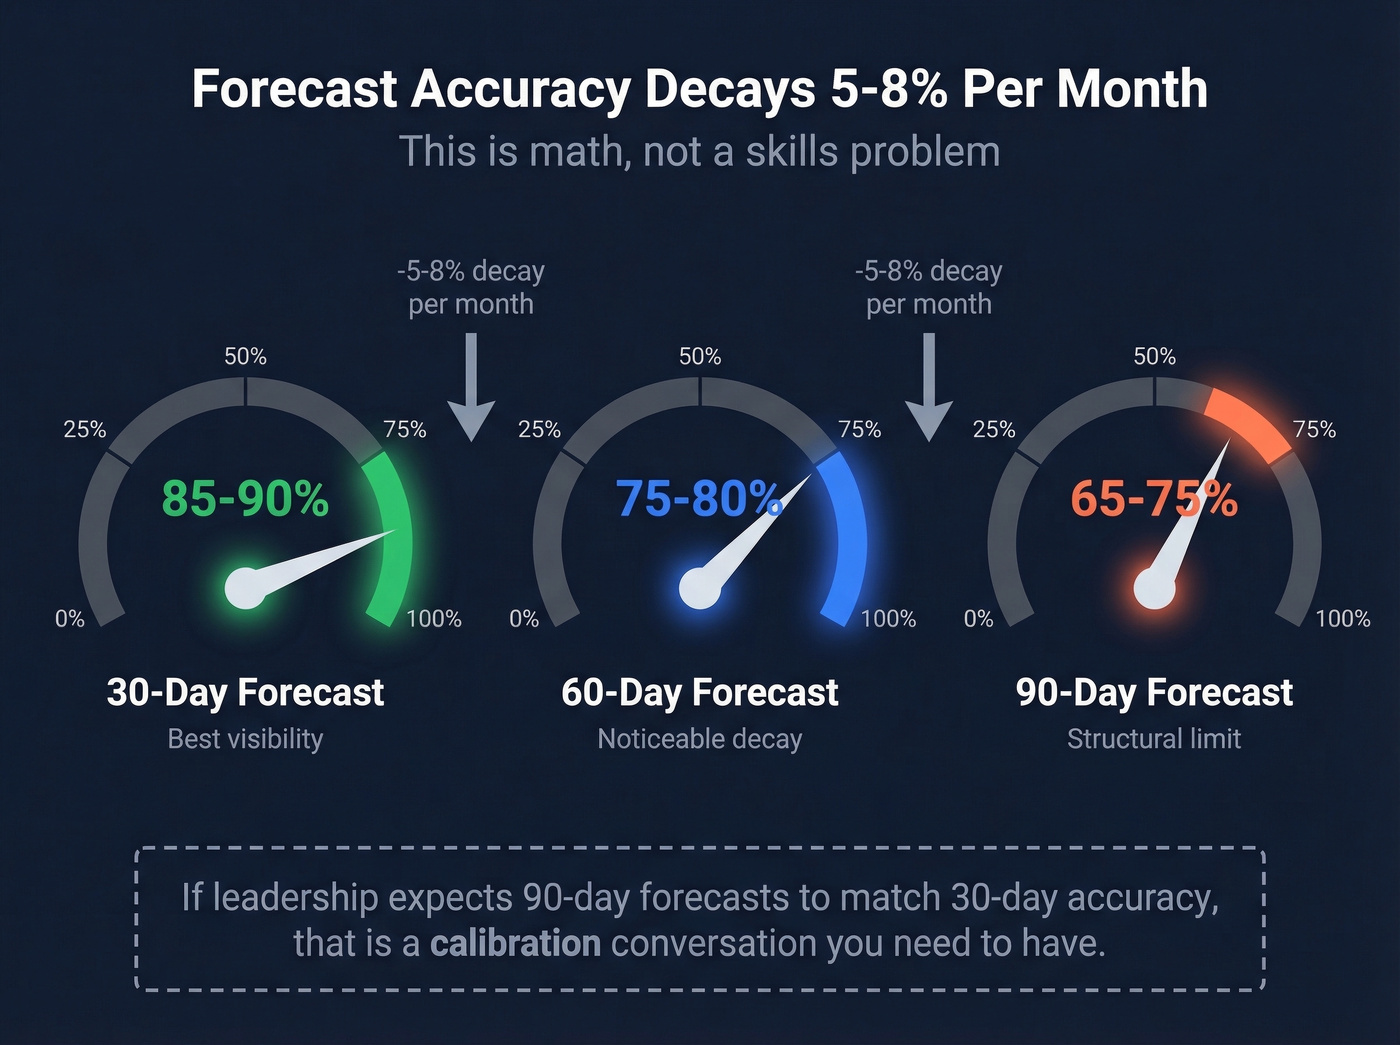
Accuracy decays 5-8% per month as the horizon extends. This isn't a failure of your process - it's a mathematical reality. More time means more variables: stakeholder changes, budget shifts, competitive entries, plain old indecision. If your leadership team expects 90-day forecasts to be as accurate as 30-day forecasts, that's a calibration conversation you need to have.
By Forecasting Method
| Method | Typical Variance | Reality Check |
|---|---|---|
| Rep roll-up | ±25-35% | Most common, least accurate |
| Weighted pipeline | ±18-25% | Best ROI for most teams |
| Historical trend | ±15-20% | Requires clean data |
| AI/ML-assisted | ±8-15% | Requires 12+ months data |
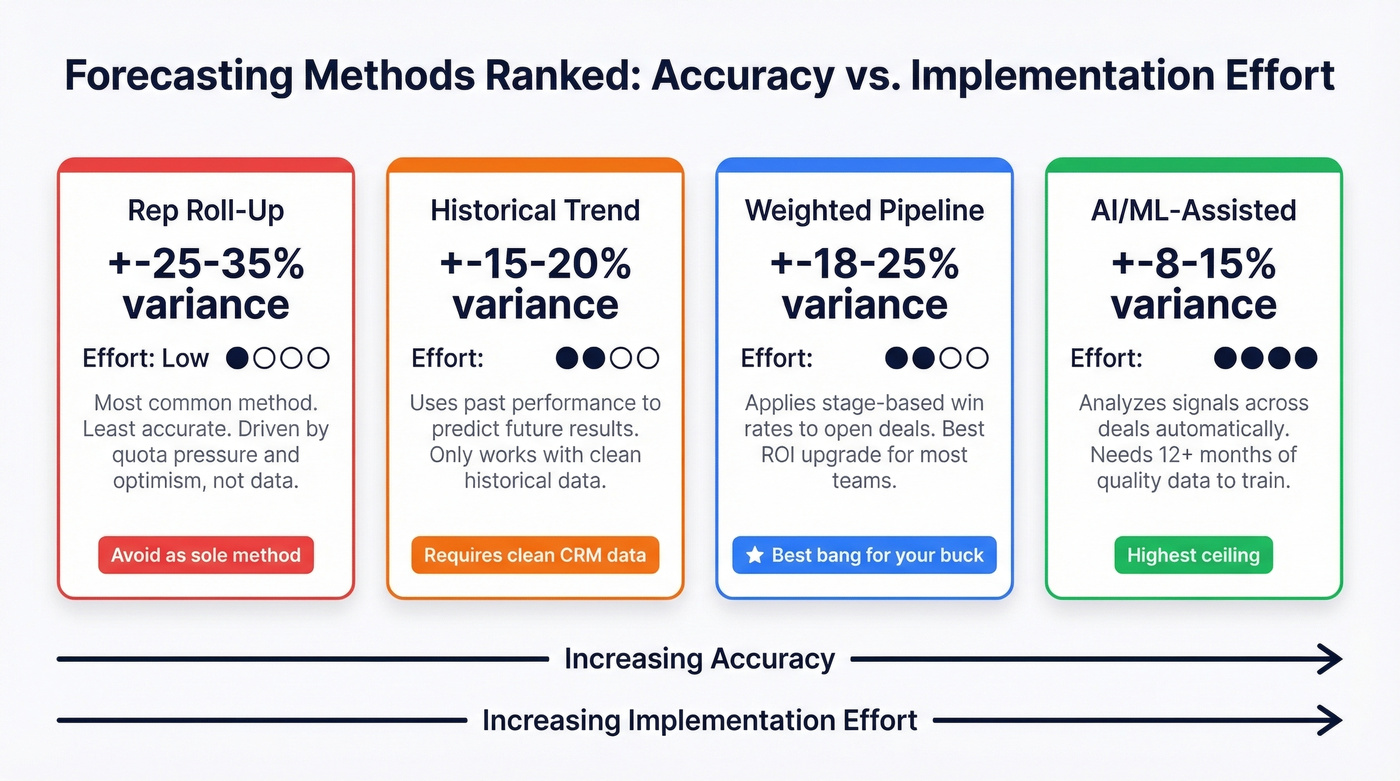
Here's the thing: rep roll-up is the most common method and the least accurate. If this is your only method, your forecast is a group hallucination. Reps forecast based on quota pressure, optimism, and what they told their manager last week - not on statistical probability.
Weighted pipeline with historical win-rate calibration is the single highest-impact upgrade most teams can make without buying new software.
By Company Stage and Industry
| Segment | Accuracy Range |
|---|---|
| Early-stage (<$1M ARR) | 50-65% |
| Growth ($1M-$10M ARR) | 70-80% |
| Mature (>$10M ARR) | 80-90% |
| Enterprise B2B | 75-85% |
| SMB B2B | 65-75% |
| SaaS | 75-85% |
| Manufacturing | 80-90% |
| Professional services | 60-70% |
A Series A company with 3 reps and 40 deals in pipeline shouldn't benchmark against a mature enterprise with 200 reps and thousands of deals. Small sample sizes create inherent volatility - that's statistics, not incompetence.
The Cost of Getting It Wrong
Let's be honest about something most articles on this topic won't say: a 10-point improvement in forecast accuracy matters more to your P&L than a 10-point improvement in win rate. Win rate affects revenue. Forecast accuracy affects every downstream resource decision.
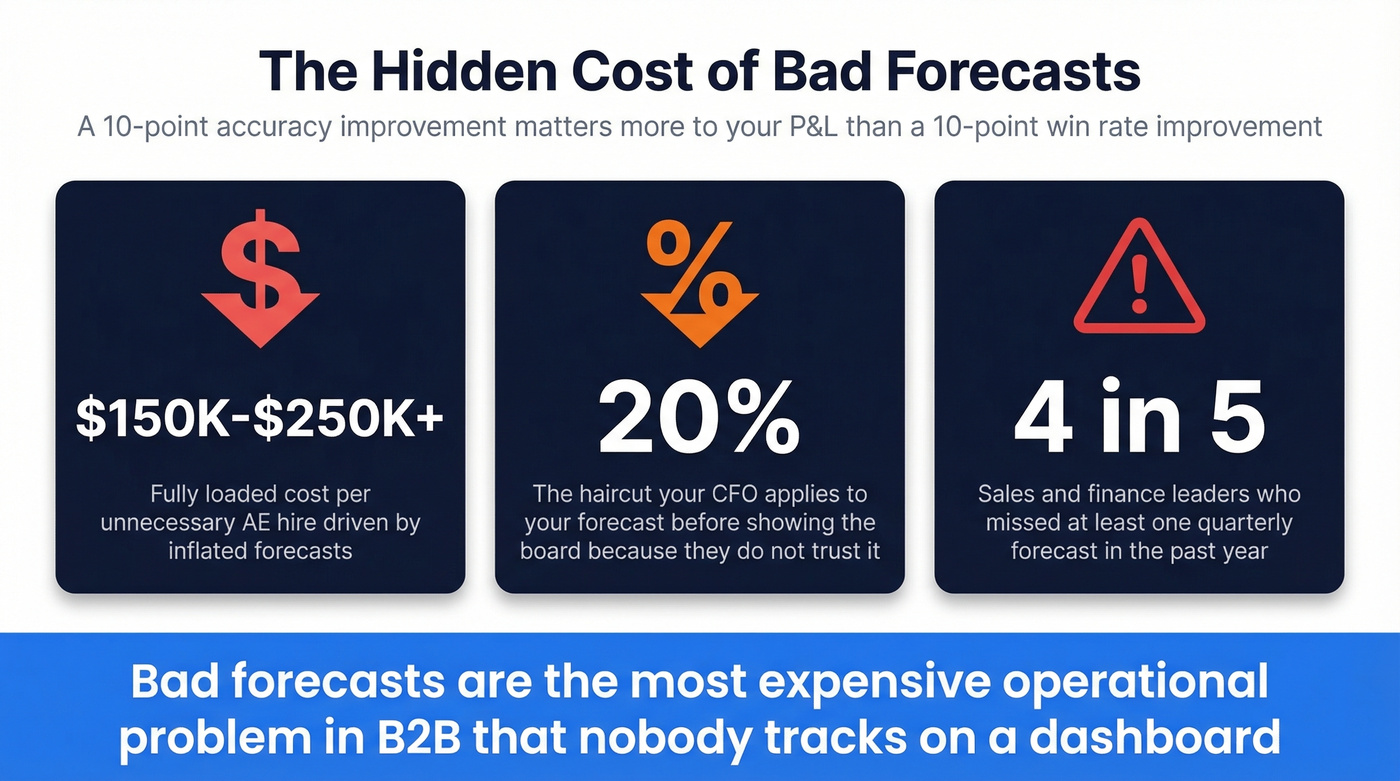
A 10-point improvement for a $10M pipeline means the difference between hiring one or two extra AEs you don't need - often $150K-$250K+ per AE in fully loaded cost - and right-sizing your team. It means your CFO stops padding your forecast with a 20% haircut before presenting to the board. It means marketing doesn't over-invest in pipeline generation for a number that was already inflated.
Bad forecasts are the most expensive operational problem in B2B that nobody tracks on a dashboard. If you want a practical set of leading indicators, start with pipeline health and sales operations metrics.
Common Forecasting Mistakes
1. Relying solely on rep commits. Reps over-commit by 15-20% on average, driven by quota pressure and ownership bias. If you're not calibrating individual rep forecasts against their historical accuracy, you're baking in systematic error every quarter.
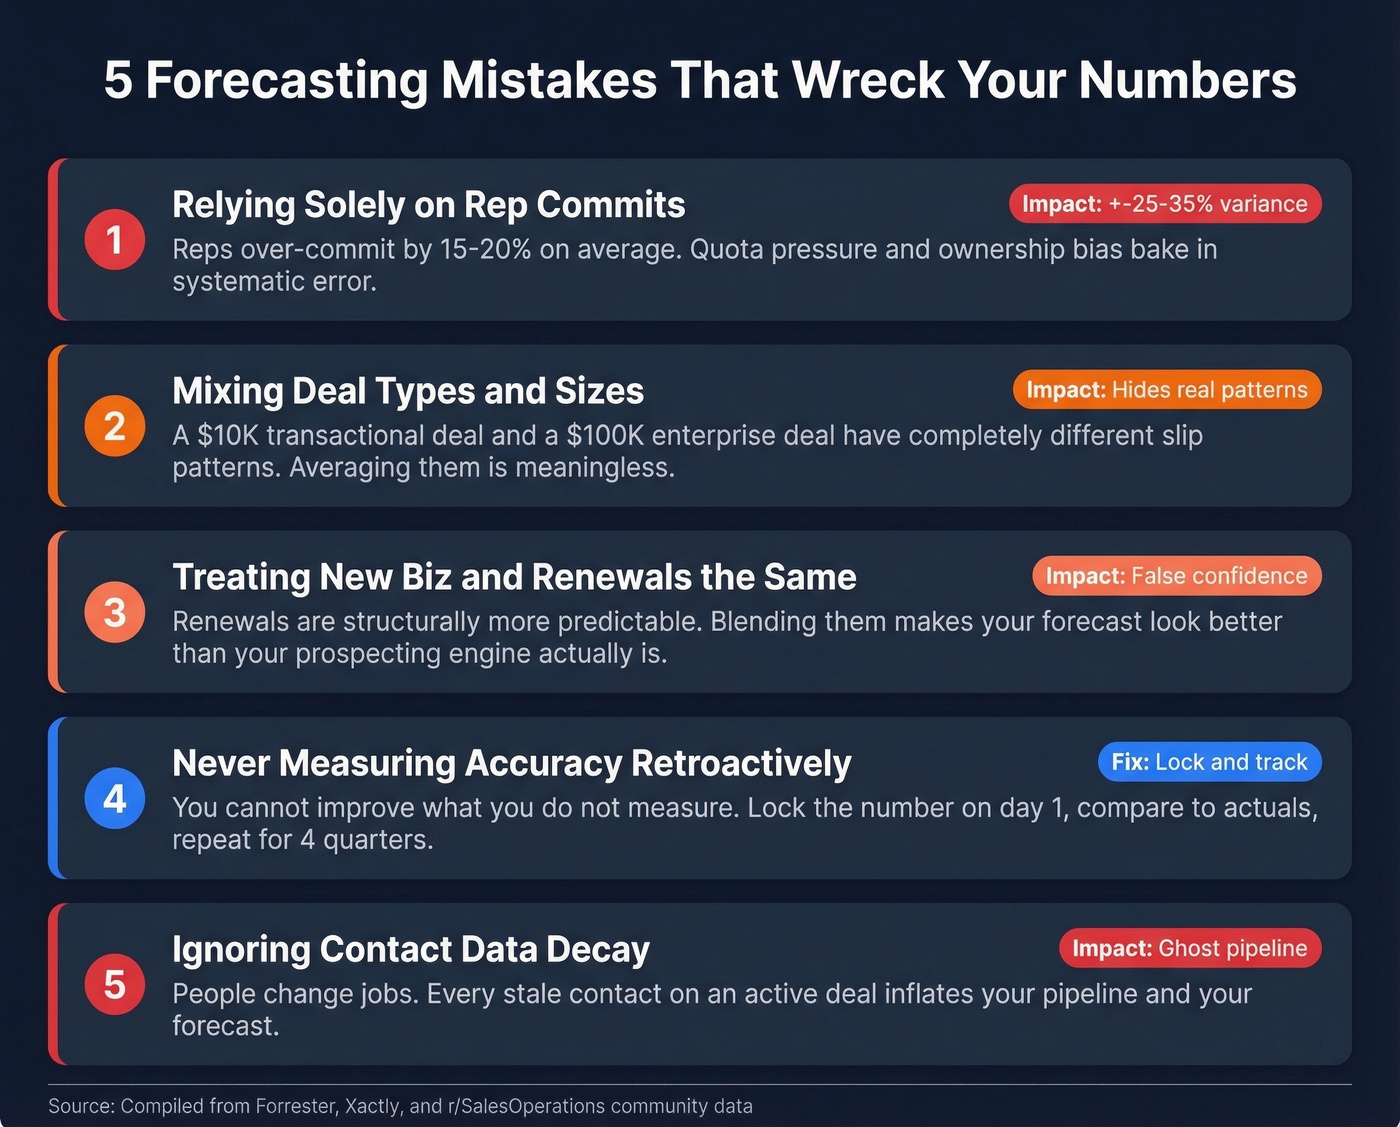
2. Mixing deal types and sizes in one forecast. A $10K transactional deal and a $100K enterprise deal have completely different sales cycles, win rates, and slip patterns. Averaging them together is like combining your marathon time with your 100m sprint and calling it your "running speed."
3. Treating new business and renewals identically. Renewals are structurally more predictable. Blending them with new business makes your forecast look better than your prospecting engine actually is - until the renewal base stops growing.
4. Never measuring accuracy retroactively. A recurring theme on r/SalesOperations is that most teams don't actually track forecast accuracy at all. You can't improve what you don't measure. Lock the number, compare to actuals, repeat.
5. Ignoring data decay. Contact data goes stale. Contacts change jobs, companies restructure, phone numbers go dead. Every stale contact attached to an "active" deal inflates your pipeline - and by extension, your forecast.
How to Improve Your Forecasts
Fix Your Data First
97% of sales and finance leaders agree the right data would make accurate forecasting easier. The problem isn't awareness - it's execution.
Every forecasting method, from rep roll-up to AI-assisted, is only as good as the data feeding it. If a meaningful chunk of your pipeline contacts have wrong emails or have changed jobs since the opportunity was created, those deals are inflating your forecast whether you use a spreadsheet or a $50K platform. I've watched a team discover that 22% of their "active" pipeline was attached to contacts who'd left the company months earlier - that's not a forecast, it's a fantasy.

This is where pipeline hygiene separates real forecasts from wishful thinking. Running your pipeline contacts through a tool like Prospeo's CRM enrichment can separate real opportunities from dead ones, with 98% email accuracy and an 83% enrichment match rate on a 7-day refresh cycle. If you're comparing vendors, start with this list of data enrichment services.
Lock and Measure
Lock on day one of the quarter. Compare actuals to the locked number - not the mid-quarter revision. Track per rep, not just per team. After two quarters, you'll know exactly who's sandbagging and who has happy ears.
Use accuracy as a coaching tool, not a punishment. A rep who's consistently 20% high isn't bad at selling - they're bad at forecasting, and that's a trainable skill. Show them their historical calibration data and let them self-correct.
Upgrade Your Method
The progression for most teams is: rep roll-up, then weighted pipeline, then weighted pipeline with historical calibration, then AI-assisted. Don't skip steps. AI forecasting requires 12+ months of clean historical data to train on, and "clean" is doing a lot of heavy lifting in that sentence.
In our experience, the jump from rep roll-up to weighted pipeline is where 80% of the accuracy gains happen. A $50K forecasting platform running on a CRM full of dead contacts gives you a very precise wrong answer. Move to weighted pipeline with historical win rates by stage, segment, and rep. That alone can cut your variance from ±25-35% down to ±15-20%.
AI is step three - and it's worth it, but only after the foundation is solid. If you need to align leadership on definitions first, use this quick explainer on sales forecast vs sales goal.
You just read that 66% of leaders can't access the CRM data they need for accurate forecasts. Bad data upstream makes every method worse - rep roll-up, weighted pipeline, all of it. Prospeo's CRM enrichment returns 50+ data points per contact at a 92% match rate, filling the gaps that turn forecasts into guesswork.
Fix the data layer and your forecast accuracy follows. At $0.01 per email.
FAQ
What is a good forecast accuracy percentage?
Forrester defines ±5% variance as excellent and ±10% as good. Most B2B organizations land at ±15-25%, which is median performance. Your realistic target depends on company stage, deal complexity, and sample size - early-stage companies with small pipelines will naturally see more volatility than mature orgs with hundreds of deals.
How do you calculate sales forecast accuracy?
Forecast Accuracy % = (1 - |Actual - Forecast| / Actual) x 100. For multiple deals, use MAPE - average the absolute percentage errors across all individual deals. Track both portfolio-level accuracy and deal-level MAPE, since they reveal different dimensions of prediction quality.
Why is my sales forecast always wrong?
Usually three things: reps over-committing under quota pressure, stale CRM data inflating pipeline with ghost deals, and mixing deal types that behave differently in one blended number. Fix data quality first, then calibrate per-rep forecasts against their historical accuracy to correct for systematic bias.
Does pipeline data quality affect forecasting?
Massively. Contact data decays as people change roles, leave companies, or switch emails. Every stale contact on an "active" opportunity inflates your pipeline number - and your forecast inherits that inflation. Teams that enrich pipeline contacts quarterly and remove dead records typically see a 10-15% improvement in forecast variance within two quarters.