Sales Funnel Best Practices: Benchmarks, KPIs, and Fixes That Move Revenue
Your funnel has stages. So does everyone else's. The difference between sales funnel best practices that generate revenue and ones that generate dashboards is whether you've attached real numbers to each stage and know what to do when those numbers slip.
Most funnel advice recycles the same AIDA definitions without telling you what a healthy conversion rate actually looks like, what to fix first when something breaks, or how to tell the difference between a real leak and a data quality problem masquerading as one.
What "Best Practices" Actually Means
Forget tip lists. Effective funnel management boils down to three things: a measurement system with clearly defined stages, benchmarks so you know what "good" looks like, and a leak-fixing order of operations so you're not optimizing the wrong stage. Defining TOFU/MOFU/BOFU is table stakes - what you need is a framework that tells you where your funnel is broken and what to fix first.
Implement three things this week:
- Define MQL/SQL entry and exit criteria with lead scoring thresholds (50 points = MQL, 100+ = SQL)
- Build one dashboard tracking conversion rates at every stage plus pipeline velocity
- Run one focused leak test - either landing page positioning or nurture cadence, not both
Pipeline velocity formula: (Opportunities x Avg Deal Value x Win Rate) / Sales Cycle Length. This gives you daily revenue velocity - the single best north-star metric for funnel health. If you only track one number, track this one.
Benchmarks by Funnel Stage
Without benchmarks, you're optimizing blind. Here's what healthy looks like across three industries, based on First Page Sage's multi-year benchmark report covering data from 2017-2025:
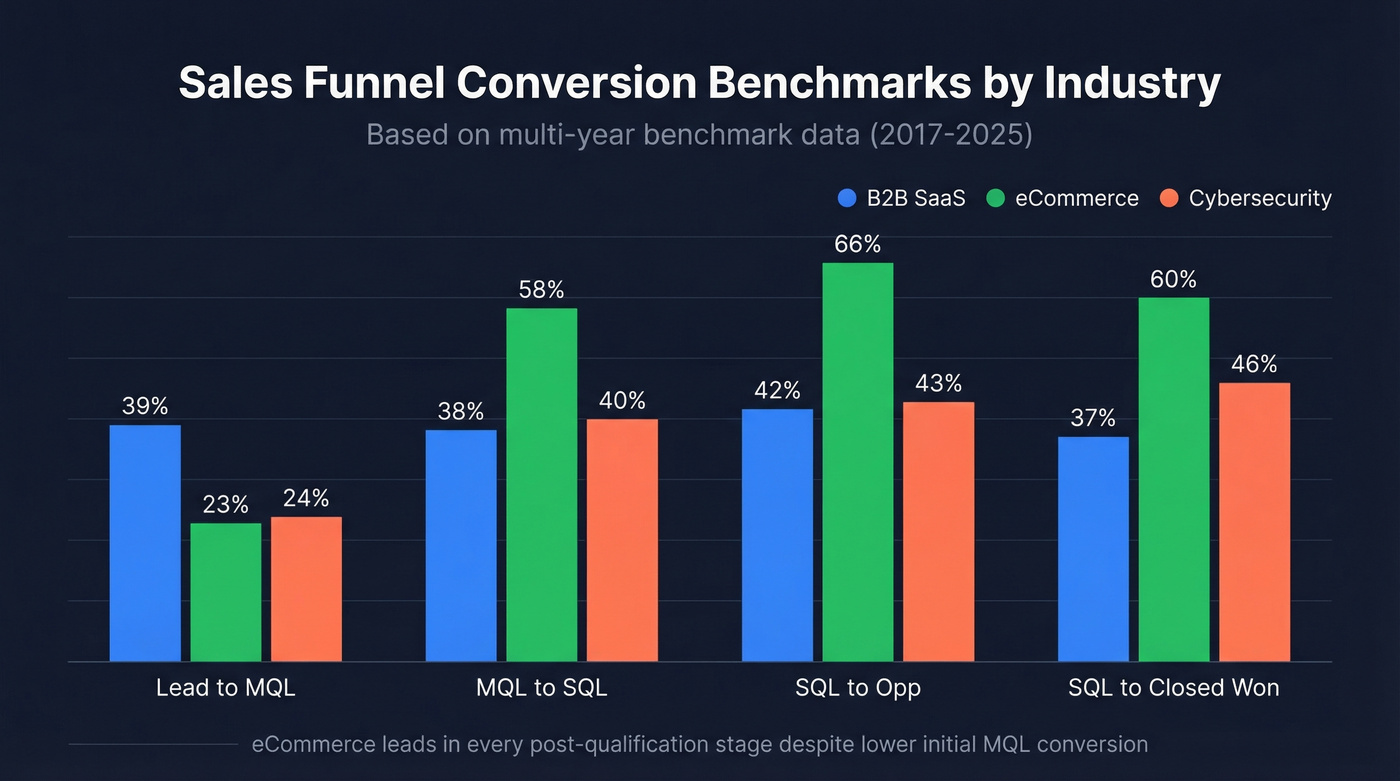
| Industry | Lead to MQL | MQL to SQL | SQL to Opp | SQL to Closed Won |
|---|---|---|---|---|
| B2B SaaS | 39% | 38% | 42% | 37% |
| eCommerce | 23% | 58% | 66% | 60% |
| Cybersecurity | 24% | 40% | 43% | 46% |
B2B SaaS generates a higher share of MQLs from leads, but the real story is what happens after qualification. eCommerce is much stronger at every post-qualification stage - MQL to SQL, SQL to Opp, and SQL to Closed Won - than the other two industries in this benchmark set.
Broader B2B SaaS baselines: lead-to-customer conversion runs 2-5%, median sales cycle is 84 days, and typical win rates land between 20-30%. If your numbers are materially below these, you've got a structural problem, not a tweaking problem.
Define Stage Entry and Exit Criteria
Here's the thing: most funnel problems aren't conversion problems. They're definition problems.
If your marketing team calls something an MQL and your sales team disagrees, every metric downstream is garbage. We've seen teams argue for weeks about "low conversion rates" that turned out to be nothing more than a disagreement about what counted as qualified.
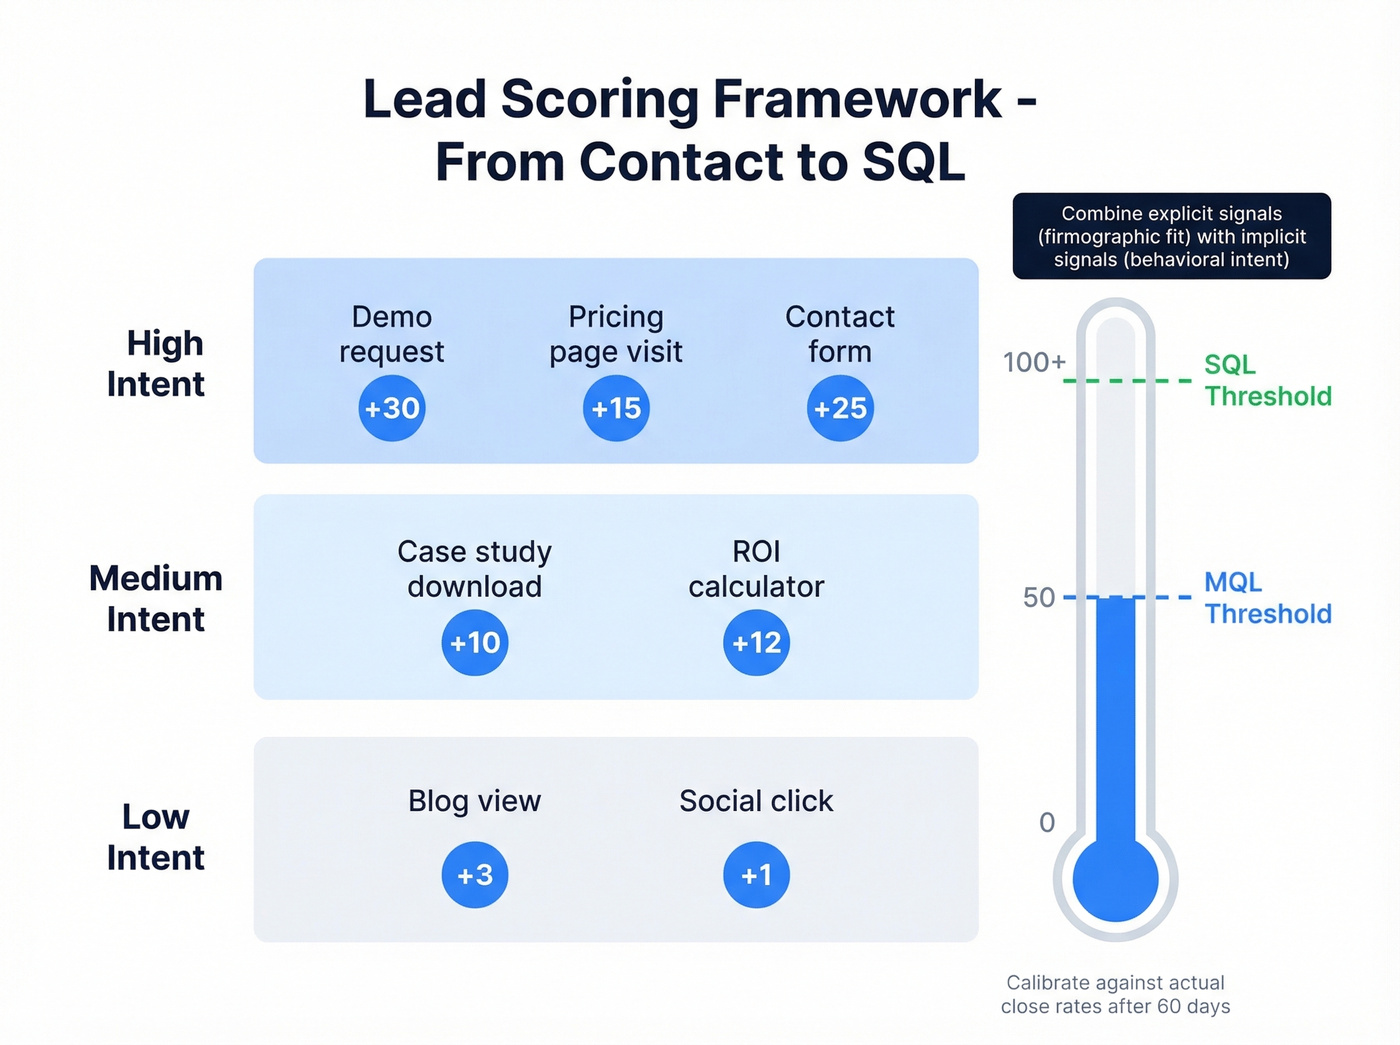
Stop adding funnel stages. Add rules. Use a dual-scoring framework combining explicit signals (firmographic fit) with implicit signals (behavioral intent). Based on Salespanel's lead scoring framework:
- High intent: Demo request (+30), pricing page visit (+15), contact form (+25)
- Medium intent: Case study download (+10), ROI calculator (+12)
- Low intent: Blog view (+3), social click (+1)
Set thresholds at 50 points for MQL and 100+ for SQL. Calibrate against your actual close rates after 60 days - the point is having any quantified threshold rather than letting reps cherry-pick leads based on gut feeling.
To go deeper on scoring models and thresholds, see our lead scoring guide.
Bad lead scoring doesn't matter if half your emails bounce. Prospeo's 5-step verification delivers 98% email accuracy - so your MQL and SQL thresholds actually reflect buyer intent, not data quality problems. Snyk cut bounce rates from 35% to under 5% and saw AE-sourced pipeline jump 180%.
Stop scoring leads you can't reach. Start with verified data at $0.01/email.
Fix Leaks in the Right Order
A practitioner on r/indiehackers shared full before/after funnel numbers that doubled revenue from $8,140 to $16,280/month with nearly identical traffic (~2,900 visitors). The lifts came from fixing stages in sequence, not shotgunning changes across the funnel.
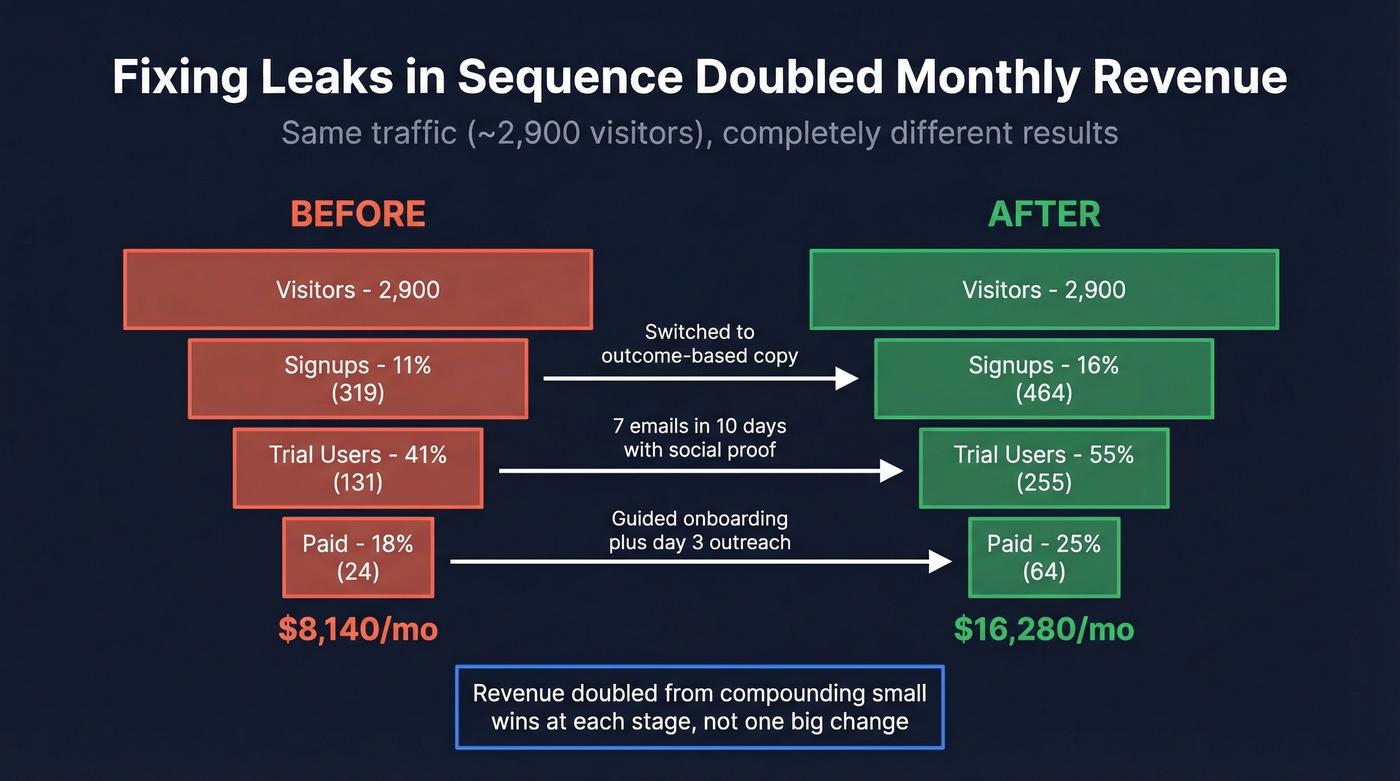
The specific moves tell the whole story. Visitor-to-signup went from 11% to 16% after switching copy from feature-based ("AI video editing platform") to outcome-based ("Save 4+ hours weekly"). Signup-to-trial jumped from 41% to 55% by compressing the email nurture from 3 emails over 2 weeks to 7 emails over 10 days with heavier social proof. Trial-to-paid climbed from 18% to 25% through guided onboarding plus personal outreach on day 3. That's a high converting sales funnel built not from one dramatic change, but from compounding small wins at each stage.
We've seen this pattern repeatedly: a team "improves" the landing page and leads go up, but revenue stays flat because MQL-to-SQL collapsed. Fix stages in order. Measure each transition independently.
If you want a stage-by-stage tracking checklist, use our funnel metrics breakdown.
Fix TOFU Quality Before You Optimize
Your dashboard says conversion dropped, but the real issue might be simpler: unreachable leads and email bounces.
When a significant portion of your contact list bounces - Snyk's team was seeing 35-40% bounce rates before switching to verified contact data - your funnel is measuring bad data, not buyer intent. Every phantom bounce inflates your denominator and makes real conversion rates look worse than they are. Buyers don't move linearly through funnels anymore; they loop across channels, revisit content, and involve committees. Ballistic Arts documented a 650% YoY increase in contact form submissions for ScoliClinic after rebuilding around actual buyer behavior instead of assumed linear paths.
But none of that optimization matters if your contact data is rotten at the source. Snyk dropped their bounce rate from 35-40% to under 5% after switching to Prospeo's verified emails, and AE-sourced pipeline jumped 180%. That's what clean top-of-funnel data does to every metric downstream - it turns your funnel from a guessing game into something you can actually diagnose.
If bounce is part of the problem, start with email bounce rate benchmarks and fixes.

Build Your Funnel Dashboard
Coupler's dashboard framework identifies four report types for end-to-end visibility: multi-stage conversion tracking (updated weekly), marketing channel attribution (revenue, not just leads), geographic performance analysis, and revenue correlation over time.
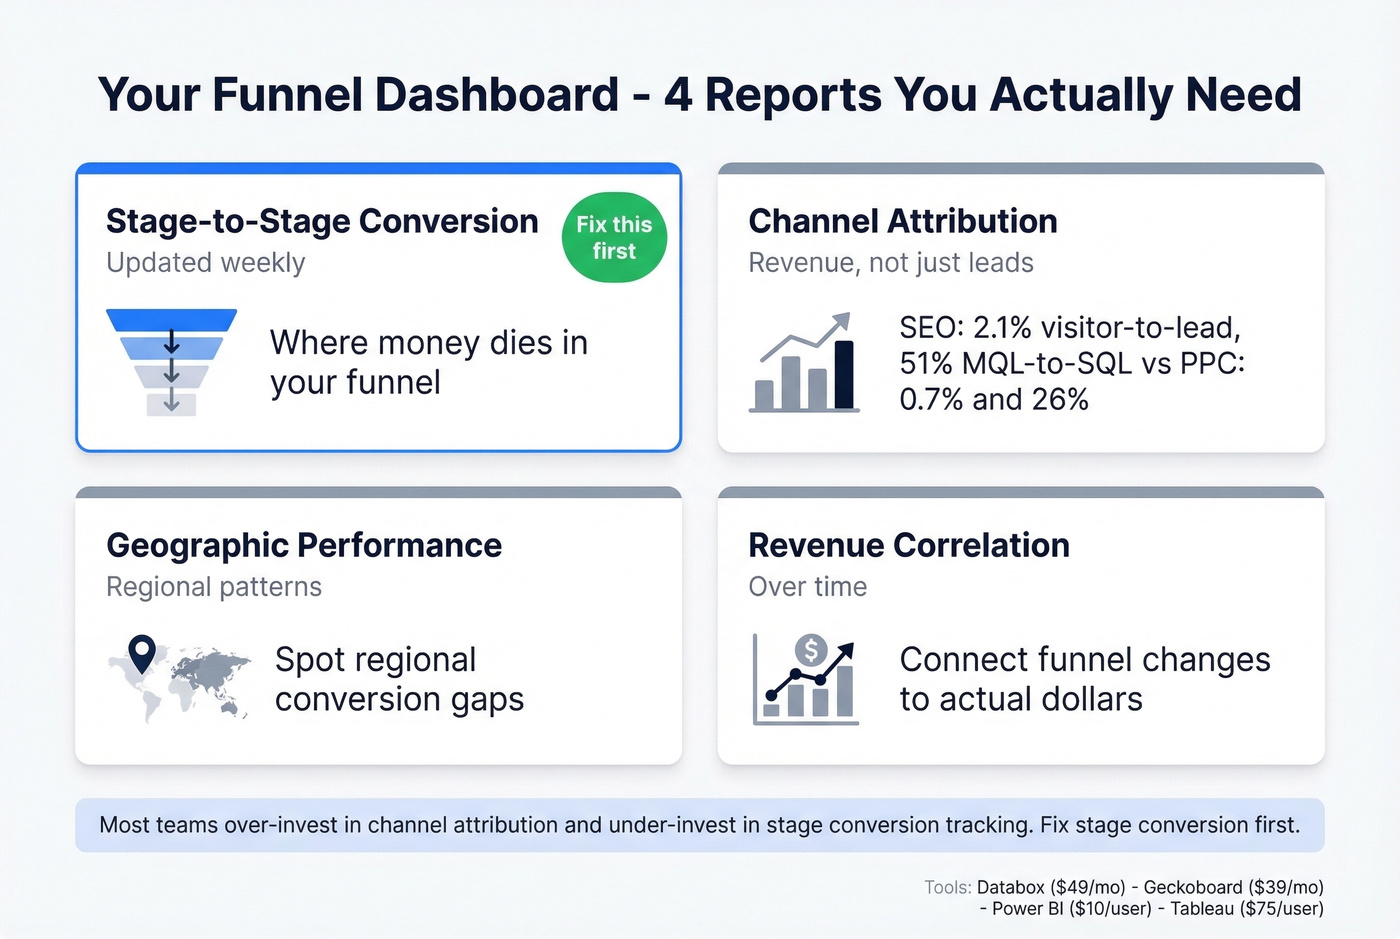
Let's be honest - most teams over-invest in channel attribution dashboards and under-invest in stage-to-stage conversion tracking. Channel attribution tells you where leads come from. Stage conversion tells you where money dies. Fix the second one first.
Channel performance varies wildly. SEO drives a 2.1% visitor-to-lead rate with 51% MQL-to-SQL conversion, while PPC manages just 0.7% and 26% respectively. For tooling, Databox ($49/mo), Geckoboard ($39/mo), Power BI ($10/user/mo), or Tableau ($75/user/mo) all work - pick the one that connects to your CRM natively and move on. Don't spend three months evaluating dashboard software when you don't have stage definitions nailed down yet.
If your reporting is messy because your CRM setup is inconsistent, see these examples of a CRM and what “good” looks like in practice.
Mistakes That Kill Funnels
Optimizing bottom-funnel conversions without enough volume. Ad platforms need dozens of conversions per week for stable learning. A practitioner on r/PPC raised this exact issue - optimizing for later-stage conversions starved the algorithm of signal, and CPL spiked. If you're running fewer than 30 conversions per week at a given stage, optimize for the stage above it instead.
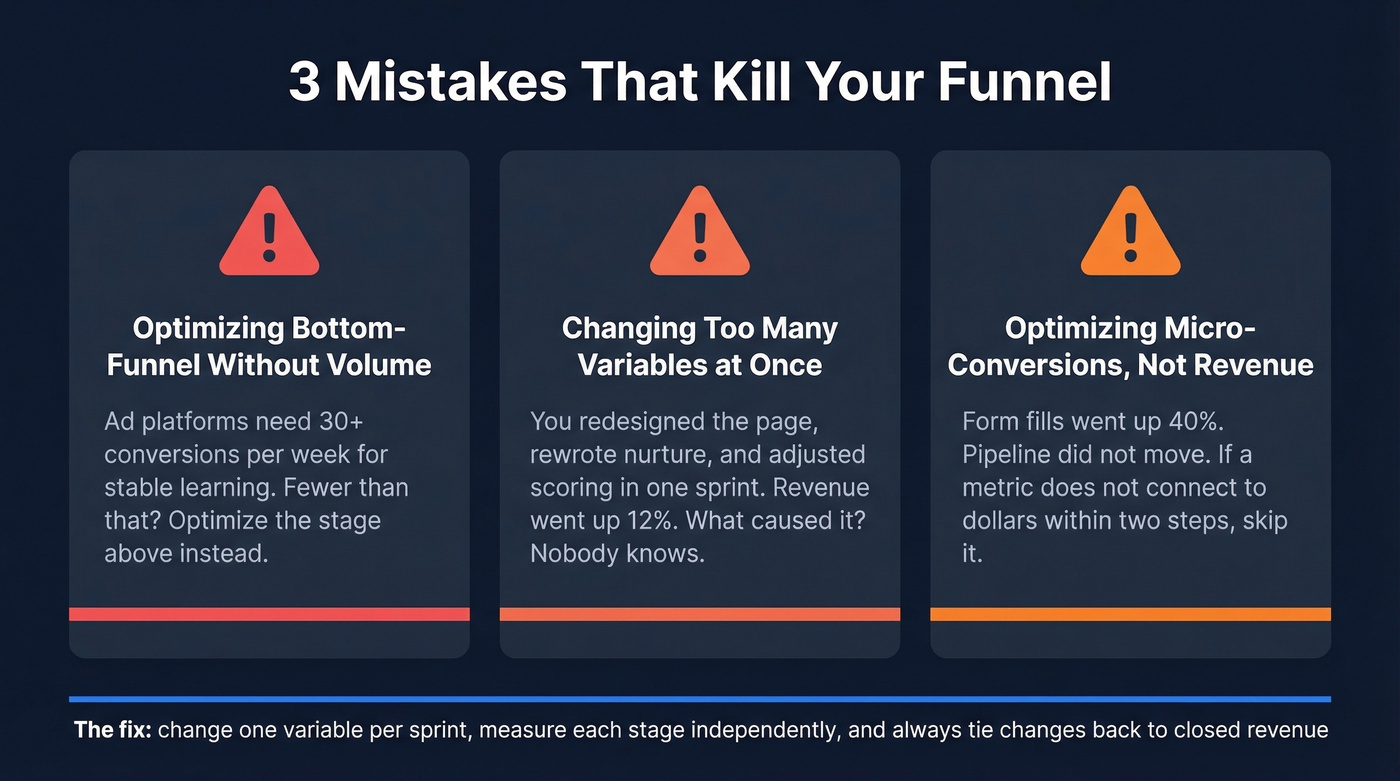
Changing too many variables at once. In our experience, this is the most common killer. You redesigned the landing page, rewrote the nurture, and adjusted scoring in one sprint. Revenue went up 12%. What caused it? Nobody knows. You've learned nothing and can't repeat it.
Optimizing micro-conversions instead of revenue. Form fills went up 40%. Pipeline didn't move. Always tie funnel changes back to closed revenue - if a metric doesn't connect to dollars within two steps, skip it and measure something that does.
If you’re trying to improve the “dollars” metric itself, start with sales conversion rate benchmarks and levers.
Every funnel stage in your dashboard is inflated by unreachable contacts. Prospeo refreshes 300M+ profiles every 7 days - not the 6-week industry average - so your conversion rates reflect real buyer behavior, not stale data. Stack Optimize built to $1M ARR with under 3% bounce rates.
Clean your top-of-funnel and watch every metric downstream improve.
FAQ
What's a good lead-to-customer conversion rate?
For B2B SaaS, 2-5% is the standard baseline. eCommerce and transactional models run higher (8-15%); enterprise deals with 6+ month cycles often land below 2%. Your industry, average deal size, and sales motion all shift the number - don't benchmark against a company with a fundamentally different go-to-market.
How is pipeline velocity calculated?
Pipeline velocity = (Number of Opportunities x Average Deal Value x Win Rate) / Sales Cycle Length. The output is your daily revenue velocity - how much potential revenue moves through your funnel per day. It captures volume, value, efficiency, and speed in one metric, which is why it's the best single number for funnel health.
How do I know if my funnel data is accurate?
Check email bounce rates and contact reachability first. If bounce rates exceed 4-5%, your conversion metrics are measuring bad data, not buyer behavior. Clean your list, re-run the numbers, and you'll often find the "conversion problem" was a data quality problem all along.
What separates a high converting funnel from an average one?
It's rarely one silver-bullet tactic. The highest-converting funnels share three traits: tightly defined stage criteria so no lead slips through uncategorized, verified contact data so metrics reflect reality, and a sequential optimization process that fixes the weakest stage first rather than spreading effort everywhere at once.