The Sales Growth Formula: Every Variant, Real Benchmarks, and the Mistakes That Distort Your Numbers
Every sales growth formula guide shows you the same equation, gives you a toy example with round numbers, and calls it a day. None of them tell you whether your number is actually good, what to do when the formula breaks, or why your CFO keeps asking for a different calculation than the one you just ran.
Here's the real problem: your CFO wants CAGR, your VP of Sales is quoting QoQ momentum, and the board deck uses a third number entirely. They're all running the same formula on different inputs and calling it "growth." The calculation itself is straightforward, but knowing which variant to use, what the output actually means, and where the math quietly lies to you is where most teams get it wrong.
Quick Reference
Basic formula:
(Current Period Sales - Prior Period Sales) / Prior Period Sales x 100CAGR formula:
(Ending Revenue / Starting Revenue)^(1 / Number of Years) - 1Benchmark anchor: Total market 5-year revenue CAGR: 12.77% across 5,994 public companies (Damodaran, January 2026)
One rule: If you only learn one variant, learn CAGR. Arithmetic averages lie.
The Core Revenue Growth Calculation
The formula itself is simple. Take your current period's sales, subtract the prior period's sales, divide by the prior period's sales, and multiply by 100 to get a percentage.
Sales Growth Rate = (Current Period Sales - Prior Period Sales) / Prior Period Sales x 100
A realistic example: your team closed $4.2M in Q1 2026 and $3.6M in Q1 2025. The math: ($4.2M - $3.6M) / $3.6M x 100 = 16.7% year-over-year growth. That's a number you can actually put in a board deck.
You'll sometimes see the formula written differently: (Current / Prior) - 1. This trips people up - it's a common confusion on r/Accounting. When you divide $4.2M by $3.6M, you get 1.167 - that's the multiplier. Your revenue is 1.167x what it was before. Subtracting 1 strips out the "base" and isolates the growth portion: 0.167, or 16.7%. Both formulas produce the same result. The subtraction just converts a multiplier into a growth rate.
Which Variant Should You Use?
The basic formula covers one period to the next. But sales teams, finance teams, and board members all want different cuts of the same data. Here are the variants that matter, when to use each, and where they'll mislead you.
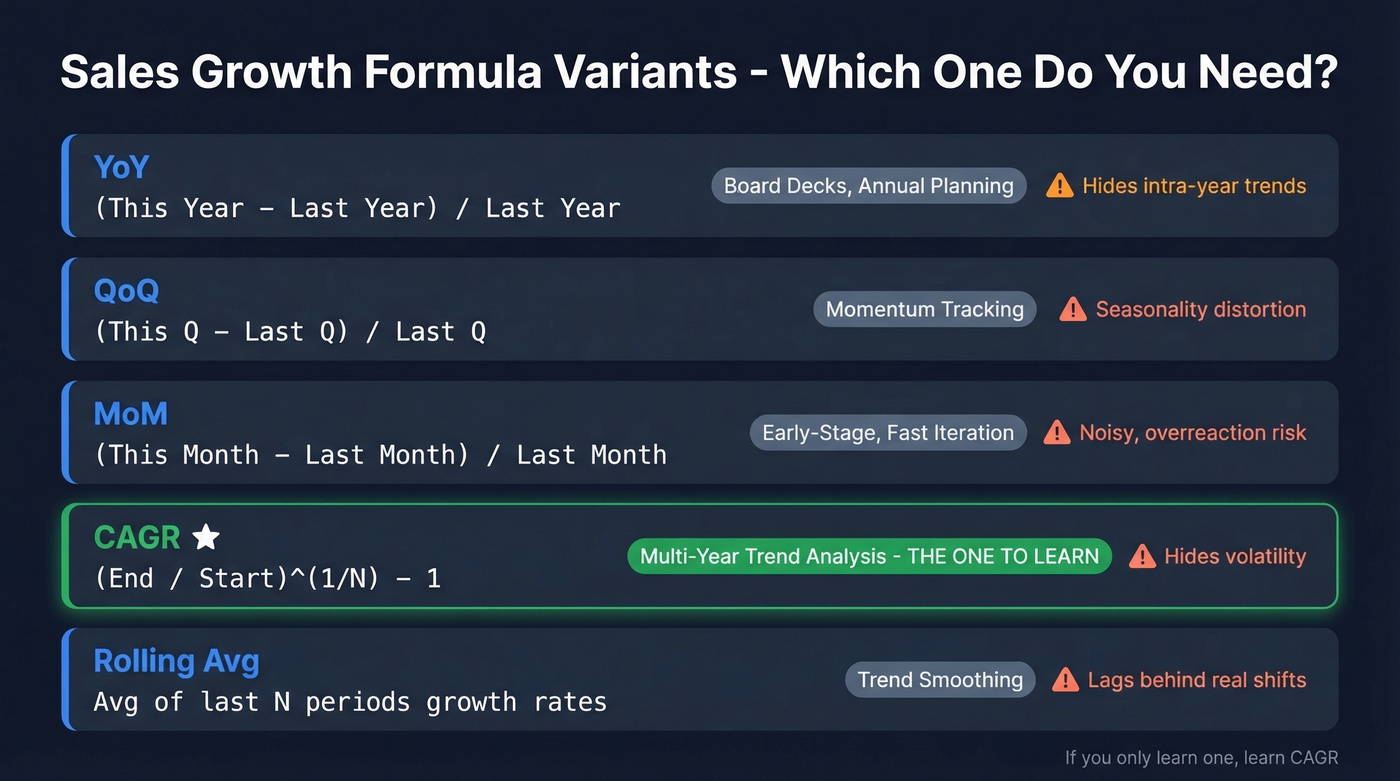
| Variant | Formula | Best Use Case | Pitfall |
|---|---|---|---|
| YoY | (This Year - Last Year) / Last Year |
Annual planning, board reporting | Hides intra-year trends |
| QoQ | (This Q - Last Q) / Last Q |
Momentum tracking | Seasonality distortion |
| MoM | (This Month - Last Month) / Last Month |
Early-stage, fast iteration | Noisy, overreaction risk |
| CAGR | (End/Start)^(1/N) - 1 |
Multi-year trend analysis | Hides volatility |
| Rolling Avg | Avg of last N periods' growth | Trend smoothing | Lags behind real shifts |
Year-over-Year (YoY)
(Current Year Sales - Prior Year Sales) / Prior Year Sales x 100
This is the default for annual reporting and investor conversations. If your company did $18M in 2025 and $15M in 2024, that's 20% YoY growth. Use it for board decks, annual planning, and any context where you're comparing full calendar or fiscal years.
Quarter-over-Quarter and Month-over-Month
Same formula, shorter timeframes. QoQ compares this quarter to last quarter; MoM compares this month to last month.
The trap is seasonality. If you're comparing Q4 (holiday spike) to Q1 (post-holiday slump), you'll see a decline that has nothing to do with your team's performance. Always compare like-for-like periods - Q4 to prior Q4, January to prior January. QoQ is useful for tracking momentum within a year, but don't confuse seasonal patterns with real trend changes.
CAGR (Compound Annual Growth Rate)
CAGR = (Ending Revenue / Starting Revenue)^(1 / Number of Years) - 1
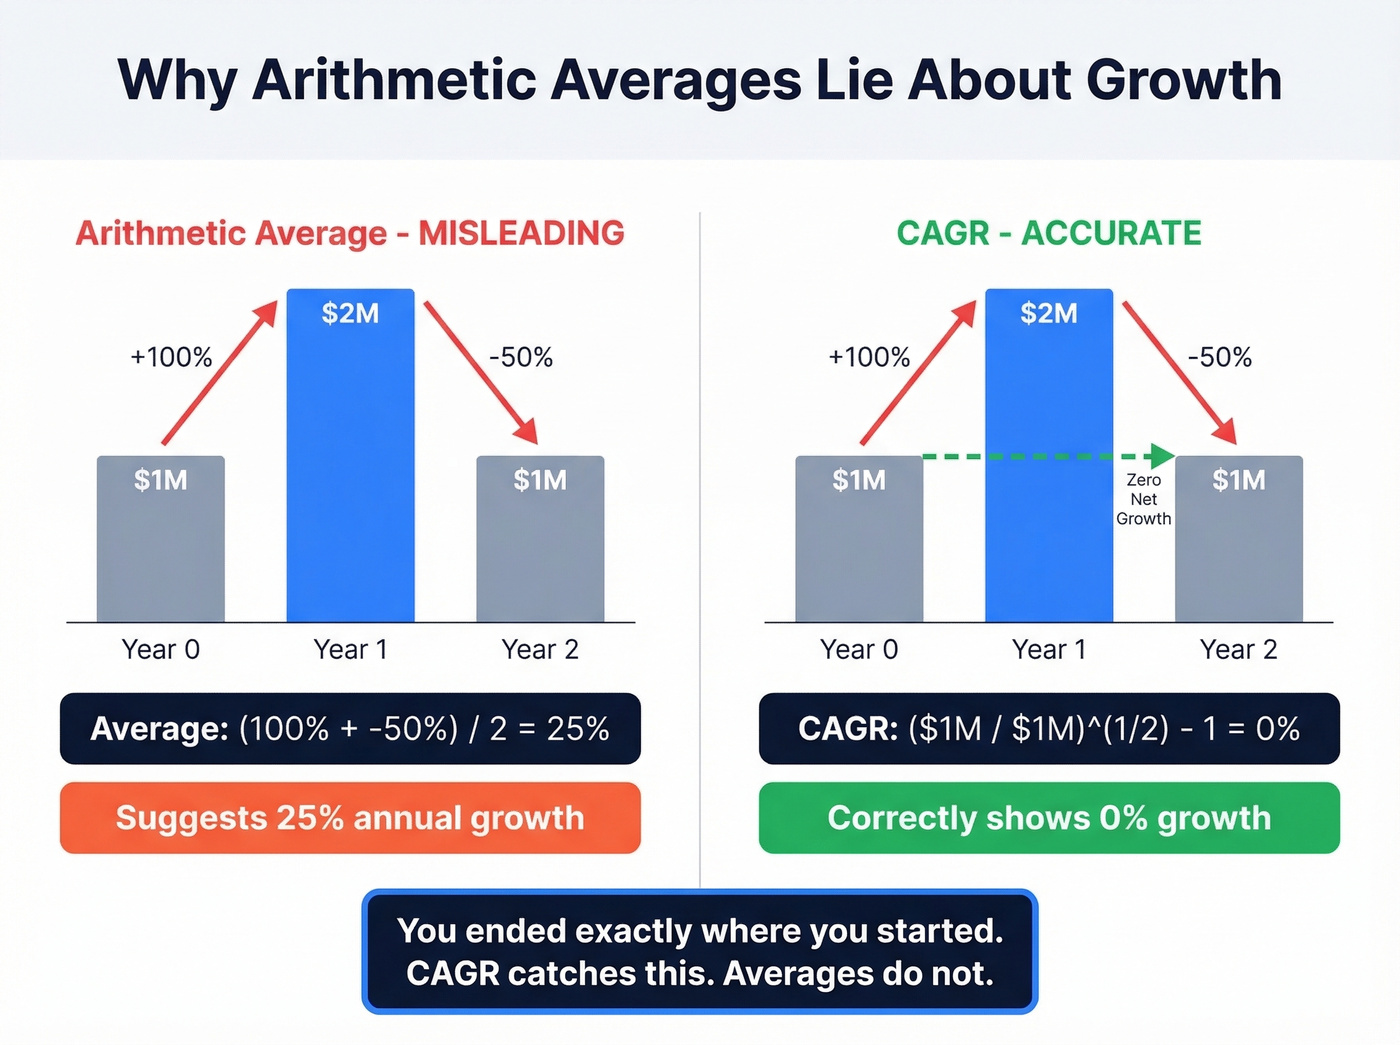
This is the variant that matters most for multi-year analysis, and it's the one most people get wrong.
Say a company's revenue doubles in Year 1 (100% growth) and then drops by half in Year 2 (-50% growth). The arithmetic average of those two years is 25%. Sounds great, right? Except the company ended exactly where it started. The actual compounded growth is 0%.
CAGR captures this correctly. It tells you the single, steady growth rate that would've taken you from your starting revenue to your ending revenue over N years. Use CAGR for multi-year comparisons. Always. Arithmetic averages of growth rates are misleading because they ignore compounding - a point that comes up repeatedly in practitioner communities.
Rolling Averages
A 4-quarter rolling average takes the average growth rate of the last four quarters and updates each period. It smooths out noise and seasonality, but it also lags behind real shifts.
Rolling 4Q Avg = (Q1 Growth + Q2 Growth + Q3 Growth + Q4 Growth) / 4
Use rolling averages alongside CAGR when you need to spot inflection points. CAGR tells you the destination; rolling averages show you the journey.
2026 Benchmarks: What's a Good Growth Rate?
"Good" depends entirely on your industry, company stage, and what you're comparing against. Let's look at what the data actually says.
By Industry (Public Companies)
Damodaran's January 2026 dataset provides 5-year revenue CAGRs across sectors:
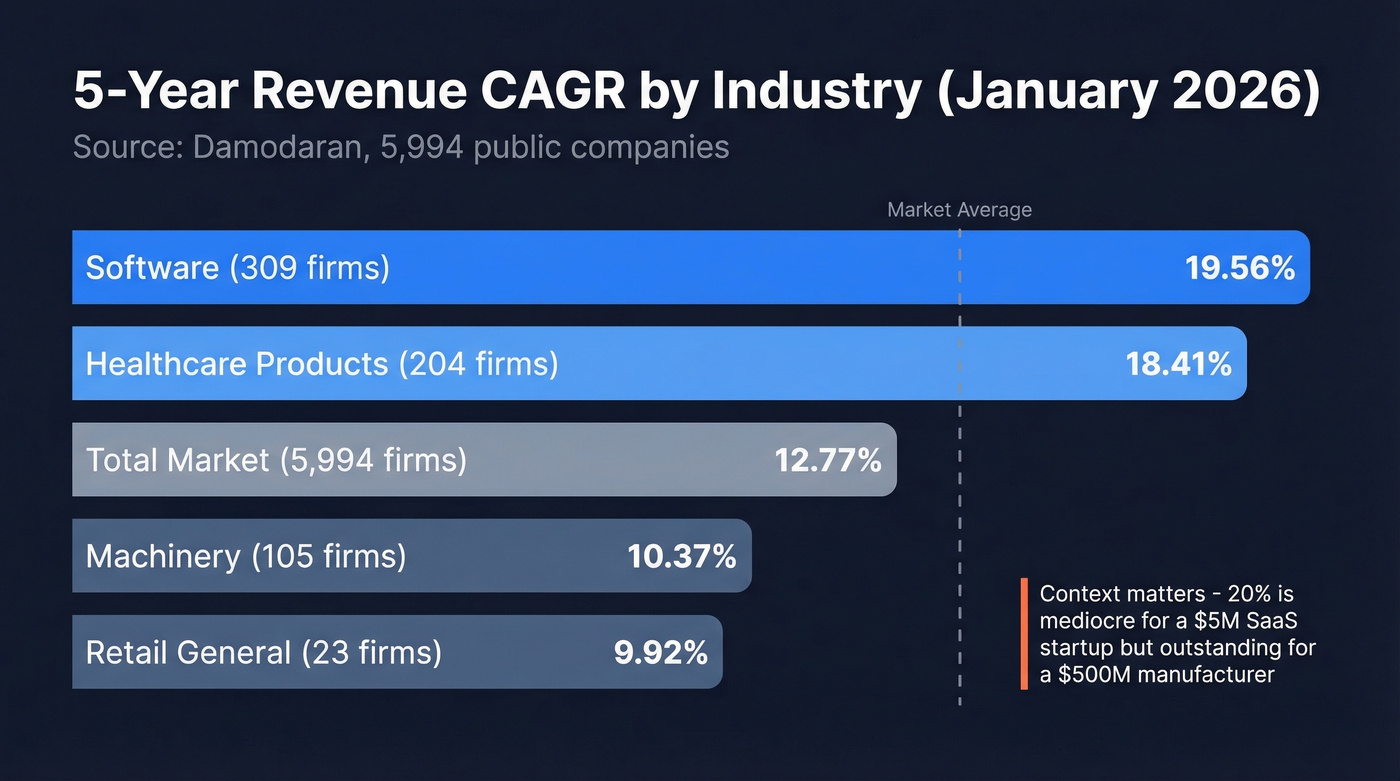
| Industry | 5-Year Revenue CAGR | Firms |
|---|---|---|
| Software | 19.56% | 309 |
| Healthcare Products | 18.41% | 204 |
| Total Market | 12.77% | 5,994 |
| Machinery | 10.37% | 105 |
| Retail (General) | 9.92% | 23 |
These are public-company numbers, so they skew larger. But they're the most reliable cross-industry benchmark available, and they give you a credible anchor for any "is our growth rate good?" conversation.
Executive Expectations for 2026
A Chief Executive Research survey of 1,030 companies found that executives expect average revenue growth of 7.9% in 2026, up from 6.9% projected for 2025 and 5.6% actual in 2024. The trend shows accelerating revenue growth across the board. But more than one-third of companies had to reforecast revenues mid-year in 2025, so don't treat forecasts as gospel.
SaaS-Specific Benchmarks
The KeyBanc/Sapphire Private Company SaaS Survey shows ARR growth reaccelerating from 15% in 2024 to 20% in 2025. Gross retention is climbing back toward 90% after dipping to 86% in 2023, and net retention remains above 100%. AI is widening the gap between winners and laggards - more than 50% of SaaS companies plan to increase AI spend by more than 21%, and 67% are already monetizing AI features. If you're in SaaS and growing below 15%, you're losing ground to peers.
The "5% Rule" for Mature Companies
Zendesk's sales growth guide references a common heuristic: large, mature companies target roughly 5% annual growth. That tracks with S&P 500 median revenue growth, which typically runs 5-8%. If you're a Fortune 500 company growing at 12%, that's exceptional. If you're a Series B startup growing at 12%, your investors are worried.
Here's the thing: most companies obsess over their growth rate number when they should obsess over whether it's the right kind of growth. A 25% growth rate fueled by deep discounting and unsustainable customer acquisition costs is worse than 12% growth with healthy unit economics. The formula doesn't tell you that. Your margins do.
Context is everything. A 20% growth rate is mediocre for a $5M ARR SaaS company and outstanding for a $500M industrial manufacturer.
A great sales growth rate means nothing without the pipeline to sustain it. Prospeo's 300M+ verified contacts with 98% email accuracy help teams book 26% more meetings than ZoomInfo - at 90% lower cost.
Stop calculating growth you wish you had. Start building pipeline that delivers it.
Organic vs. Inorganic Growth
Here's a number that looks great on paper: AAR Corp reported Q2 FY2026 sales of $795M, up 16%. Impressive - until you dig one line deeper and find that organic growth was 12%. The remaining 4 percentage points came from acquisitions. If your growth rate includes acquired revenue, you're measuring your CFO's deal-making, not your sales team's performance.
Organic growth measures revenue increases from your existing business - same products, same teams, same go-to-market. Inorganic growth includes revenue from acquisitions, mergers, or major partnerships. The adjustment is straightforward: remove acquired revenue from the current period before computing growth. If you acquired a company that contributed $2M this quarter, subtract that $2M from your current period sales before running the formula. This gives you the organic rate, the number that actually reflects whether your sales engine is working.
We've seen teams celebrate "30% growth" that was really 8% organic plus a big acquisition. The board eventually figures this out, and it's not a fun conversation.
Common Mistakes That Distort Your Numbers
Division by Zero
When prior period sales equal zero, the formula breaks. This happens more often than you'd think - new product lines, new territories, new reps who had no prior-period quota. It's a recurring pain point on r/excel.
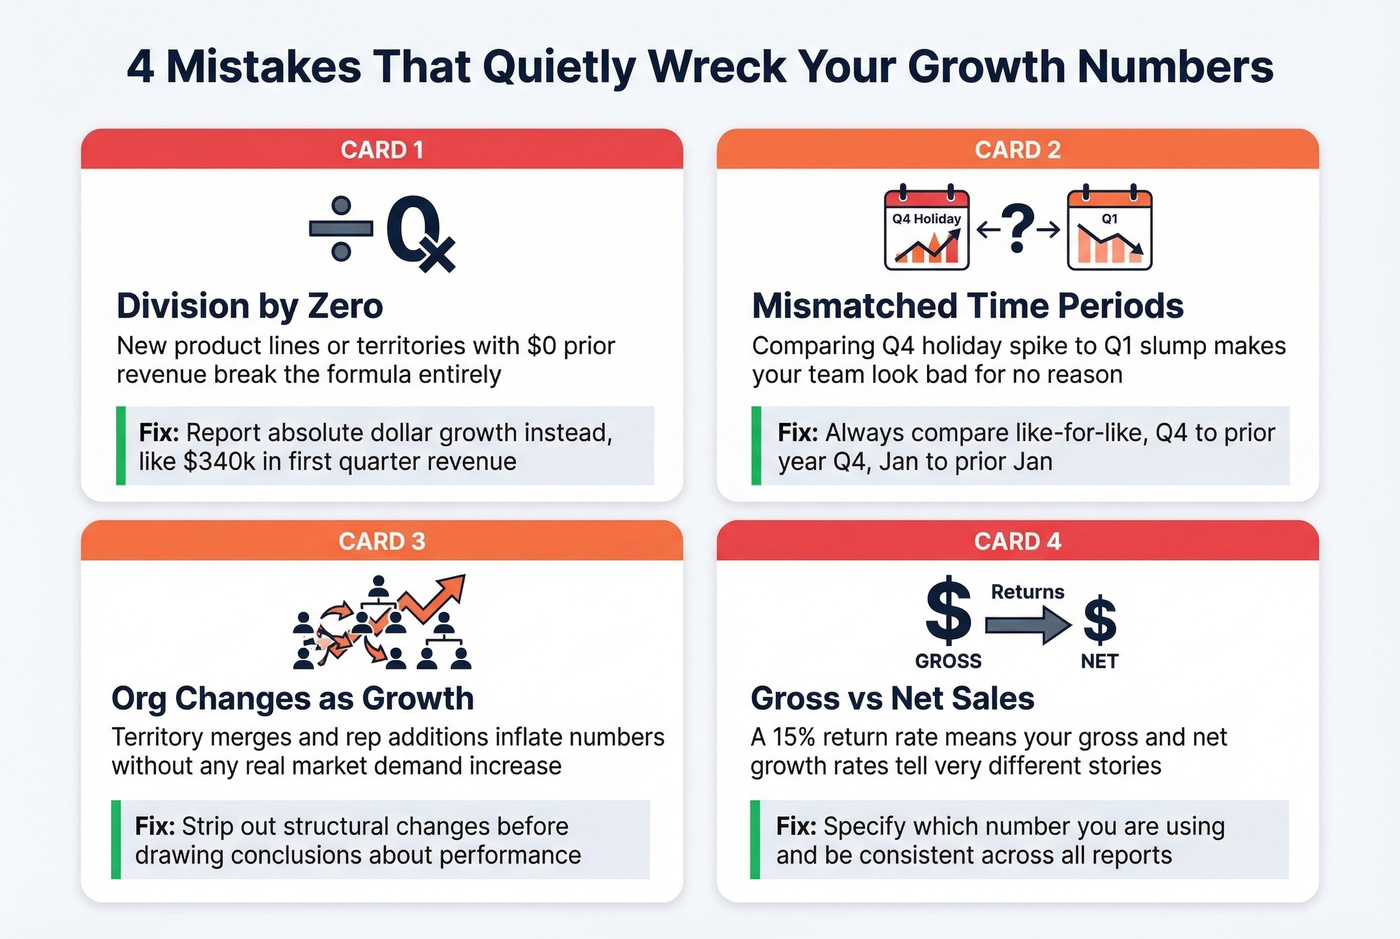
The fix: don't force a percentage where one doesn't exist. Report absolute dollar growth instead ("$340K in first-quarter revenue from the new product line") or use an IFERROR wrapper in Excel to flag these cases cleanly.
Comparing Mismatched Time Periods
Comparing Q4 to Q1 instead of Q4 to prior-year Q4 is one of the most common mistakes in growth reporting. Seasonality makes sequential comparisons nearly useless for most businesses. Always compare like-for-like periods. If someone shows you a QoQ decline from Q4 to Q1, ask for the YoY number before reacting.
Org Changes Masquerading as Growth
If you restructured territories, added reps mid-year, or merged two teams, your growth rate reflects the org change - not market demand. A territory that "grew 40%" after absorbing half of another territory's accounts didn't actually grow 40%. Strip out the structural changes before drawing conclusions about sales performance.
Gross vs. Net Sales
Are you using gross revenue or net revenue after returns, discounts, and allowances? For a SaaS company with minimal returns, it barely matters. For an e-commerce company with a 15% return rate, the difference is significant. Specify which number you're using, and be consistent across periods.
Arithmetic Average vs. CAGR
This deserves repeating because it's the most dangerous mistake. A stock gains 100% in Year 1 and loses 50% in Year 2. Arithmetic average: 25%. Actual return: 0%. The same math applies to revenue growth rates. If you're averaging annual growth rates across multiple years, you're almost certainly overstating performance. Use CAGR.
Cherry-Picked Timeframes
CAGR is sensitive to start and end dates. Pick a start date right after a bad quarter and an end date right after a record quarter, and you can make any business look like a rocket ship. One-time events - a massive contract, a COVID-era spike, a product recall - can distort multi-year CAGRs dramatically. Use rolling averages alongside CAGR to keep yourself honest.
Price vs. Volume Decomposition
Knowing that sales grew 60% is useful. Knowing why - 33% more units and a 20% price increase - is what drives decisions. This is the revenue bridge framework, and it's the question that FP&A teams ask constantly.
Let's walk through it with real numbers.
Period 1: $375 revenue, 150 units, $2.50 price per unit Period 2: $600 revenue, 200 units, $3.00 price per unit
Total revenue change: $225 (60% growth). Now decompose it.
Volume effect: Hold price constant at the old price ($2.50) and calculate the revenue from the additional units. (200 - 150) x $2.50 = $125.
Price effect: Hold volume constant at the new volume (200 units) and calculate the revenue from the price increase. ($3.00 - $2.50) x 200 = $100.
Check: $125 + $100 = $225. The two effects sum to the total change.
Volume drove 56% of the growth; price drove 44%. That distinction matters enormously for strategy. If all your growth is coming from price increases, you've got a ceiling approaching. If it's all volume, you might have pricing power you aren't using.
Excel and Google Sheets Implementation
Here's a simple template layout you can build in five minutes. Columns: Period | Sales | Prior Period Sales | YoY % | Rolling 4-Period Avg | CAGR.
Basic growth rate (cell D2):
=(B2-B1)/B1
CAGR across 5 years (assuming B1 is Year 1 and B6 is Year 6):
=(B6/B1)^(1/5)-1
Zero-baseline protection:
=IFERROR((B2-B1)/B1,"N/A - new line")
Format the growth rate cells as percentages. For the rolling average column, use =AVERAGE(D2:D5) and drag down. That gives you a 4-period rolling growth average that updates each row.
This isn't fancy, but it covers what most sales and finance teams need. For something more sophisticated, add a column for organic vs. total growth and a separate tab for the price-volume decomposition we covered above.
Turning Growth Data Into Actual Results
Formulas tell you where you are. They don't move the needle.
Three levers actually drive sales growth: pipeline quality, conversion optimization, and expansion revenue. Each one compounds the others. Pipeline quality means getting more of the right prospects into your funnel - not just more names. Conversion optimization means tightening your sales process so a higher percentage of qualified pipeline turns into closed revenue. Expansion revenue means growing existing accounts through upsells, cross-sells, and usage-based growth. Most teams over-index on the first lever and ignore the third, which is a mistake since expansion revenue converts far better than new business.
All three levers depend on something most teams underestimate: data quality. Your growth rate is only as good as the data feeding your pipeline. If 30% of your contact data bounces, your pipeline numbers are fiction, and every metric downstream - including your reported growth rate - is built on phantom opportunities. We've watched this play out with our own customers. Meritt saw their bounce rate drop from 35% to under 4% after switching to Prospeo, and pipeline tripled from $100K to $300K per week. That's not a formula trick. It's what happens when reps actually reach the people they're targeting.
Meritt tripled their weekly pipeline from $100K to $300K using Prospeo's verified data. When your growth formula needs real numbers behind it, 143M+ verified emails and 125M+ direct dials make the difference.
Turn your growth targets into actual revenue with data that connects.
FAQ
What is the sales growth formula?
(Current Period Sales - Prior Period Sales) / Prior Period Sales x 100. This gives you the percentage change in revenue between two periods. Use it for YoY, QoQ, or MoM comparisons - just make sure you're comparing like-for-like timeframes to avoid seasonality distortion.
How do you calculate CAGR for sales?
(Ending Revenue / Starting Revenue)^(1 / Number of Years) - 1. This tells you the steady annual growth rate that would've taken you from start to finish. Use it instead of arithmetic averages for any multi-year analysis - arithmetic averages systematically overstate growth.
What's a good sales growth rate in 2026?
The total public market 5-year CAGR is 12.77% across nearly 6,000 firms. SaaS companies target 20%+ ARR growth; mature enterprises aim for 5-8%. Executives across 1,030 companies expect 7.9% average growth in 2026.
How do you calculate growth from a zero baseline?
You can't use the standard percentage formula - it's division by zero. Report absolute dollar growth instead ("$150K in first-quarter revenue from the new territory") or use Excel's IFERROR function to flag new product lines separately rather than forcing a meaningless percentage.
How does data quality affect sales growth tracking?
Bad contact data inflates pipeline numbers, distorts conversion rates, and makes growth metrics unreliable. If a third of your emails bounce, your pipeline-to-revenue math is built on phantom opportunities. Cleaning up your data foundation - through verified contact databases and regular refresh cycles - is the fastest way to get honest numbers underneath your growth calculations and start improving the real rate.