Sales KPI Tracking: The System, Not Just the Metrics
84% of reps missed quota last year. Most teams don't have a motivation problem - they have a tracking problem. Too many dashboards, not enough decisions.
A solo seller on r/sales summed it up perfectly: their entire "analytics stack" was a custom Google Sheet tracking days since last close, prospecting attempts, response rates, lead-to-close conversion, and net commission. Scrappy, but honest - because it matched how they actually worked. Meanwhile, 45% of reps say they're overwhelmed by tools, and the average rep spends roughly two hours per day actually selling.
The fix isn't more dashboards. It's a system.
The Short Version
- Track 10-12 KPIs max, grouped by revenue, pipeline, activity, and efficiency.
- Pick a CRM (HubSpot's free tier works), layer in data quality tooling, and build role-based views.
- Run a weekly/monthly/quarterly review cadence - a dashboard nobody opens is worse than no dashboard at all.
- Fix your data before you fix your dashboard. If 40% of pipeline contacts have bounced or dead info, every KPI is a lie.
Here's the thing: most companies respond to missed quotas by adding more KPIs. That's not a strategy. It's a coping mechanism. Track fewer things, but track them ruthlessly.
KPIs vs. Metrics vs. OKRs
A KPI measures reality. An OKR sets the goal. A target gives the KPI context - same KPI, different expectation depending on stage, segment, and strategy.
You need both leading and lagging indicators. Lagging KPIs tell you what happened: revenue, win rate, quota attainment. Leading KPIs tell you what's likely to happen: pipeline coverage, response rates, meetings booked. "Emails sent" is a metric, not a KPI - until you can explain how it drives a business outcome.
The 12 KPIs That Actually Matter
Most guides list 20-30 KPIs. That's a data dump, not a strategy. If you can't explain why a metric is on your dashboard, remove it.
| KPI Name | Formula | Benchmark | Leading/Lagging |
|---|---|---|---|
| Revenue | |||
| Monthly sales growth | (This mo - last mo)/last mo | 5-15% MoM (growth-stage) | Lagging |
| Win rate | Closed-won / total opps | 21% avg B2B | Lagging |
| Median deal size | Revenue / # deals | ~$4K median | Lagging |
| Quota attainment | Attained / quota | 100% target; 60-70% typical | Lagging |
| Pipeline | |||
| Pipeline coverage | Pipeline / next period quota | 3:1 min | Leading |
| Pipeline velocity | (# opps x win% x ACV)/cycle | Improve QoQ | Leading |
| Sales cycle length | Avg days to close | +32% since 2021 | Lagging |
| Forecast accuracy | Forecast vs actual | 97% say better data would help | Lagging |
| Activity | |||
| Calls-to-meeting ratio | Meetings / calls | 1:8 to 1:15 | Leading |
| Email open rate | Opens / delivered | 20-30% | Leading |
| Email response rate | Replies / delivered | 8-10% | Leading |
| Efficiency | |||
| Revenue per rep hour | Revenue / selling hours | $150-$400/hr (B2B SaaS) | Leading |
| Lead response time | Time to first touch | <5 min | Leading |
Revenue KPIs
These are your scoreboard - non-negotiable, but easy to misread because they're lagging. A bad month often traces back to pipeline created 6-10 weeks earlier, not something that happened last Tuesday. Reps and managers own these.
Pipeline KPIs
This is where RevOps earns its keep. If coverage is under 3:1, you're not "behind" - you're mathematically dead unless win rate or deal size spikes dramatically. And forecast accuracy? That's usually a data problem wearing a strategy costume. Managers and ops own these.
Activity KPIs
These only matter when tied to conversion. A rep can send 2,000 emails and create zero pipeline if deliverability is cooked or targeting is sloppy. Use open and response rates as early warning signals, not vanity metrics. Reps own these.
Efficiency KPIs
The adult table. Reps spend roughly two hours per day actually selling - the rest is admin, data entry, and tool-switching. Revenue per rep hour forces you to confront those time sinks and decide whether your process scales. VPs and ops own these for headcount and territory planning.
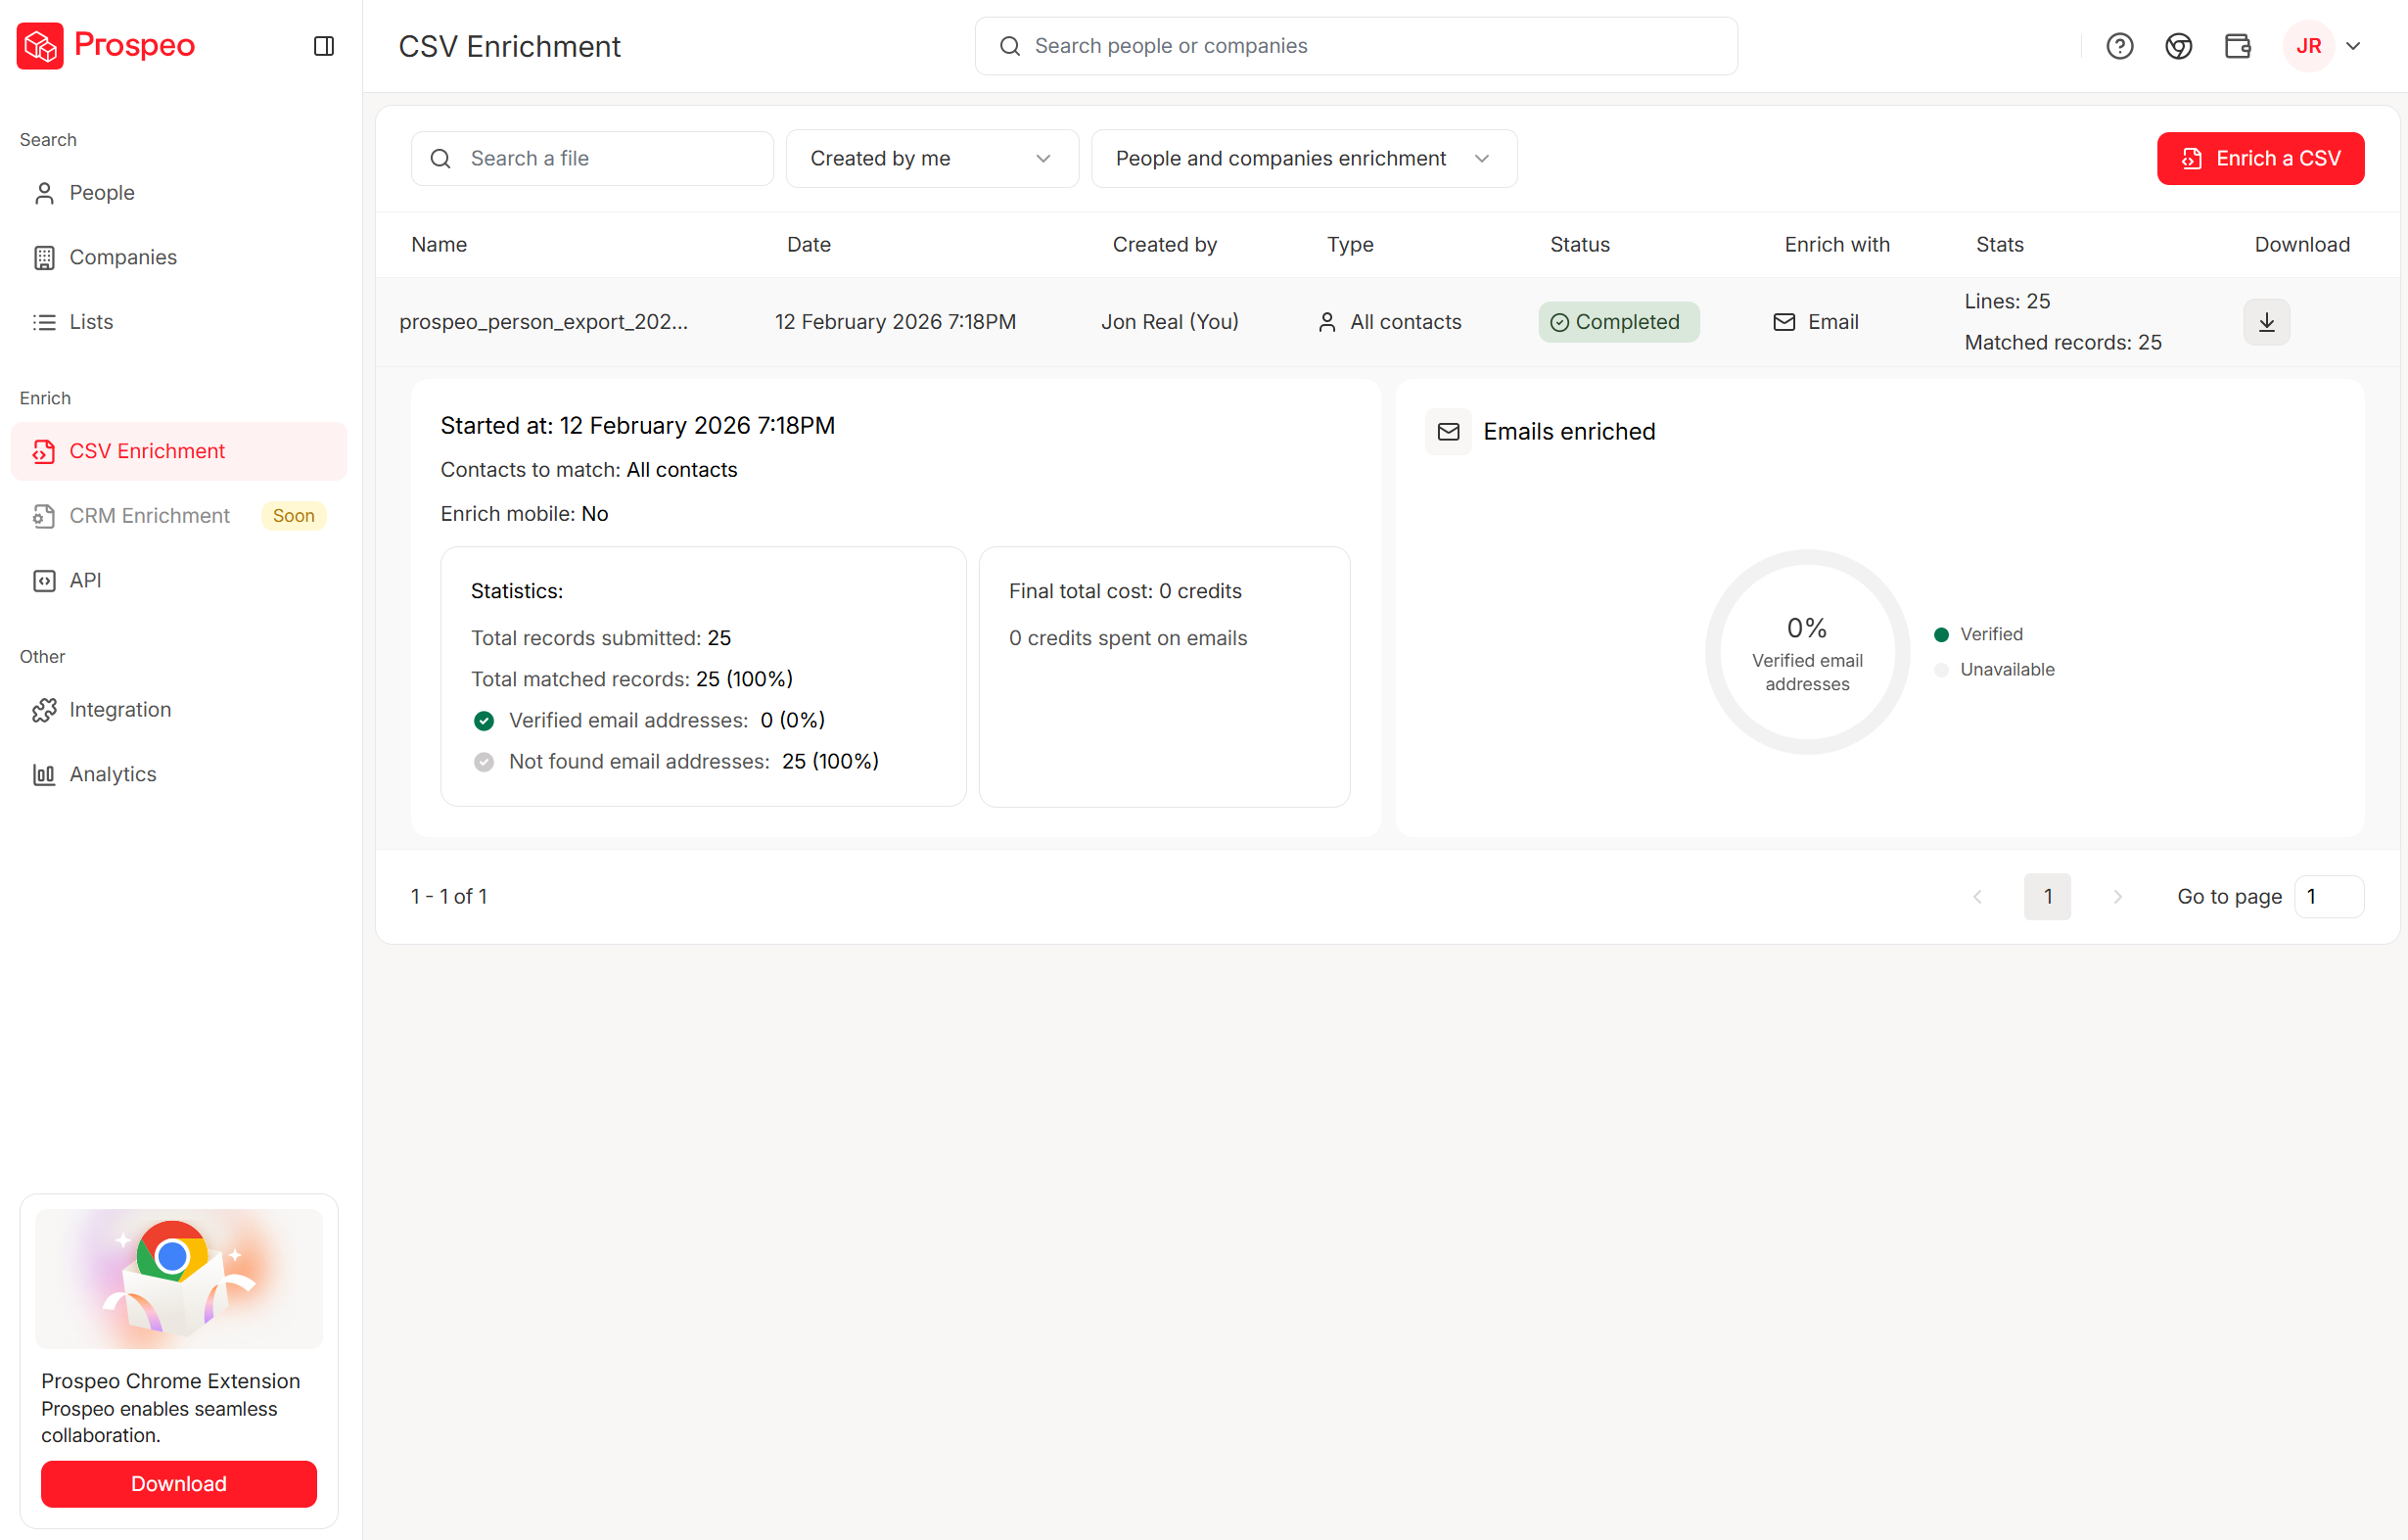
Every KPI on your dashboard is a lie if 40% of your pipeline contacts have bounced emails. Prospeo's 5-step verification and 7-day data refresh cycle cut bounce rates from 35% to under 4% - so your activity, pipeline, and efficiency metrics finally reflect reality.
Clean data in, trustworthy KPIs out. It starts at $0.01 per email.
How to Build Your Tracking System
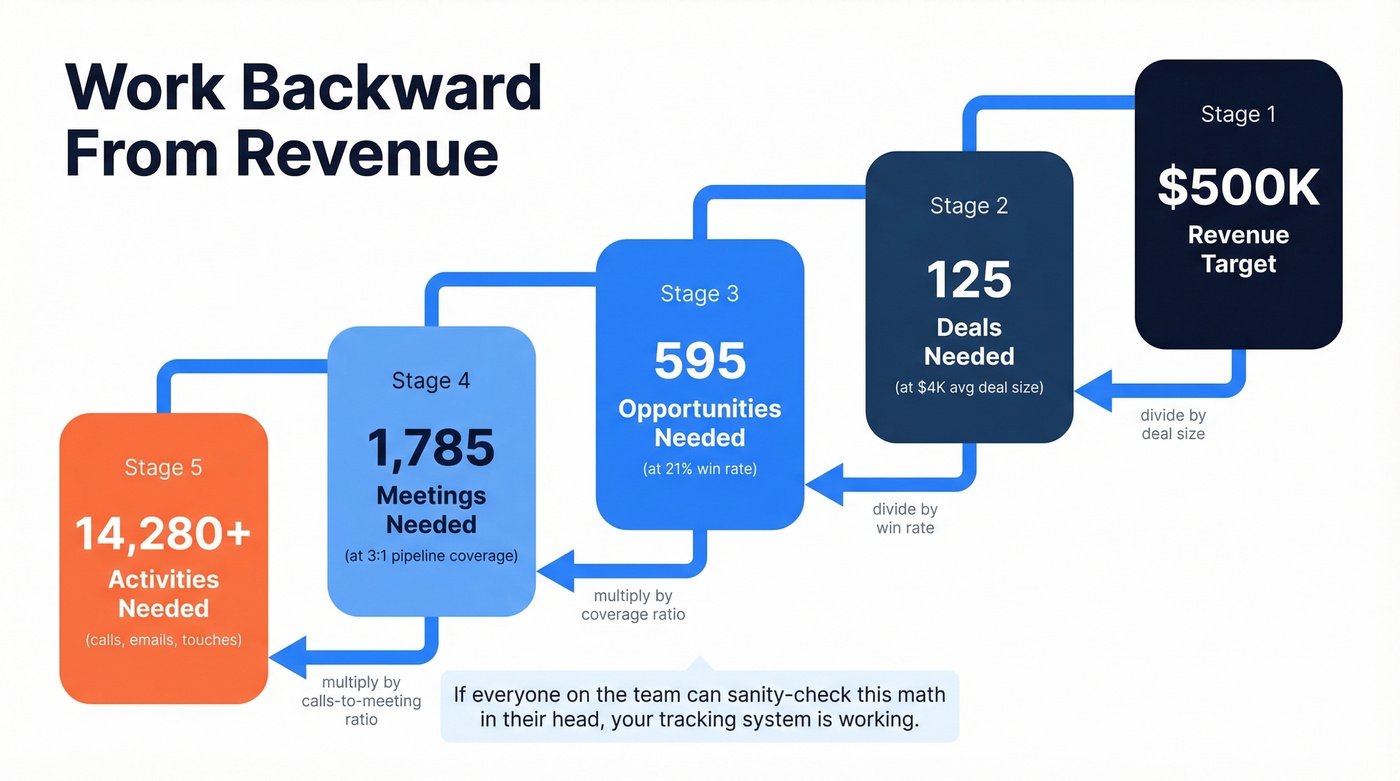
Step 1 - Work Backward From Revenue
Start with the revenue number, then reverse-engineer: revenue -> deals needed -> opps needed -> meetings needed -> activities needed. This forces every metric to justify its existence. We've tested this approach in bake-offs between fancy BI tools and simple scorecards, and the simple model wins because everyone on the team can sanity-check the math in their head.
Step 2 - Choose Your Stack
A starter stack that works: HubSpot CRM (free) for your system of record, Google Sheets for custom views until you outgrow it, and a data quality layer for verification and enrichment.
If you want a plug-and-play Sheets starting point, Coefficient offers free Google Sheets dashboard templates for sales performance, opportunity tracking, accounts, and pipeline creation.
Mobile access matters more than people admit. Teams using mobile CRM hit targets 65% of the time vs. 22% without it. That gap shows up fast in activity logging and follow-up discipline.
Step 3 - Fix Data Before Building Dashboards
Let's be honest: KPI tracking fails because the underlying CRM is messy. Inconsistent naming, missing rep attribution, untracked returns - your "revenue" KPI is inflated and your conversion math is nonsense.
Contact data rots fast. In real pipelines, 40% of contacts have bounced or outdated info. That's why your "response rate" and "speed-to-lead" charts look random. One team we worked with ran a pipeline audit using Prospeo and cut bounce rates from 35% to under 4%, which immediately made outreach KPIs and stage conversion rates trustworthy again. A 7-day data refresh cycle - versus the industry-standard 6 weeks - means pipeline metrics reflect real opportunities instead of dead records.
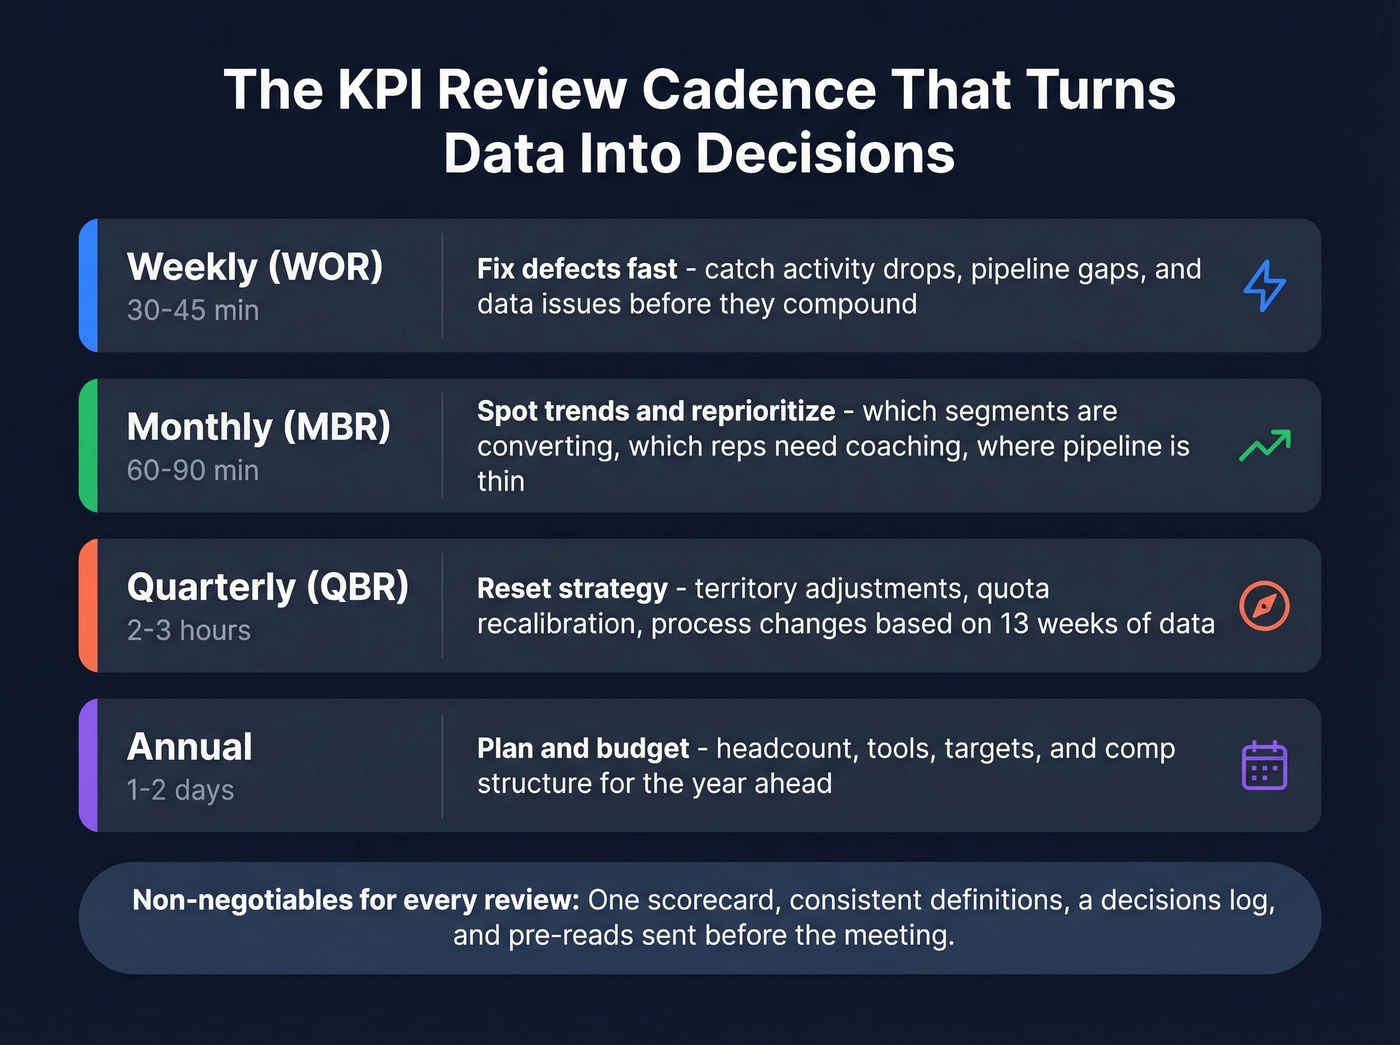
The KPI Review Cadence
A dashboard nobody opens is worse than no dashboard. The cadence turns data into decisions.
| Review | Frequency | Time | Purpose |
|---|---|---|---|
| WOR | Weekly | 30-45 min | Fix defects fast |
| MBR | Monthly | 60-90 min | Trends + priorities |
| QBR | Quarterly | 2-3 hrs | Reset strategy |
| Annual | Yearly | 1-2 days | Plan + budget |
One scorecard, consistent definitions, a decisions log, and pre-reads distributed before the meeting - not during it. In our experience, "dashboard projects" die because every meeting re-litigates what "qualified opportunity" means instead of making actual calls. A thread on r/sales put it bluntly: dashboards report performance, but they don't feed planning. The cadence is what bridges that gap.
As AI-assisted forecasting matures - 81% of sales teams now use some form of AI - expect the QBR to shift from "what happened" to "what the model predicts." But the cadence itself stays the same.
Five Common Tracking Mistakes
Misalignment with company goals. If the business is shifting upmarket and you're still optimizing for raw activity volume, you'll "hit KPIs" and miss revenue. We've seen this play out at three different companies in the last year alone - the dashboard looked green while the board deck looked red.
Tracking too many KPIs. Teams either drown in 40 tiles or obsess over one number and distort behavior. Wells Fargo's cross-sell targets are the cautionary tale everyone should study: the wrong KPI creates the wrong behavior at scale.
Bad underlying data. Garbage in, garbage out. Inconsistent naming, missing rep attribution, sloppy data entry, and untracked returns silently corrupt every metric downstream. This is the most common problem and the least glamorous to fix.
Perverse incentives. When reps game a metric instead of pursuing the outcome it represents, the KPI is broken. Watch for activity inflation - high call counts with zero meetings booked is the classic red flag.
No review cadence. The dashboard becomes wall art, and performance drifts until it's a fire drill. Skip this mistake and you'll avoid half the others on this list.
Tools for Tracking Sales KPIs
| Tool | Category | Starting Price |
|---|---|---|
| HubSpot Sales Hub | CRM | Free; $20/user/mo |
| Salesforce Sales Cloud | CRM | $25/user/mo |
| Pipedrive | CRM | $15-$25/user/mo |
| monday Sales CRM | CRM | $10-$12/seat/mo |
| SimpleKPI | KPI Dashboard | $14-$129/mo |
| Tableau | BI/Analytics | $15-$70/user/mo |
| Prospeo | Data Quality | Free (75 emails/mo); ~$0.01/email |
Skip the BI tools if you're under 10 reps - you don't need Tableau yet. For everyone else, the real bottleneck isn't visualization. It's data quality. HubSpot CRM (free) plus a verification layer plus Google Sheets for custom views will carry you further than most teams expect. Upgrade to SimpleKPI or Tableau when you genuinely outgrow it.
If you're tightening definitions and ownership, it helps to borrow a sales operations metrics framework so your scorecard doesn't drift.
Reps spend two hours a day selling. Don't waste those hours on dead contacts. Prospeo enriches your CRM with 50+ data points per contact at a 92% match rate - so response rates, speed-to-lead, and revenue per rep hour actually improve.
Stop optimizing dashboards built on bad data. Fix the source.
FAQ
What's the difference between a sales KPI and a sales metric?
A metric is any measurable data point - calls made, emails sent, pages visited. A KPI is a metric tied directly to a business goal and used to make decisions. All KPIs are metrics, but not all metrics deserve a spot on your dashboard.
How many sales KPIs should I track?
Track 10-12 maximum, split across revenue, pipeline, activity, and efficiency. That mix gives you full-funnel visibility without dashboard overload. If you can't explain what decision a KPI drives, cut it from the scorecard.
How often should I review sales KPIs?
Weekly for operational fixes (30-45 min), monthly for trend analysis (60-90 min), and quarterly for strategy resets (2-3 hrs). The cadence matters more than the dashboard because it forces decisions and follow-through.
How do I keep KPI data accurate?
Start by auditing contact records in your CRM - bounce rates above 10% corrupt every downstream metric. A data quality layer with a short refresh cycle keeps pipeline and activity KPIs reflecting real opportunities instead of stale records.
What's the minimum stack for sales KPI tracking?
A CRM (HubSpot's free tier works), a data quality layer to keep contact records accurate, and a spreadsheet for custom views. The stack matters less than the data hygiene underneath it - clean data makes every KPI trustworthy.