Sales & Operations Planning: The Practitioner's Playbook
You're sitting in a quarterly business review, staring at $2M in excess inventory while the customer service team fields complaints about missed delivery targets. The demand plan said one thing. Supply did another. Finance found out last.
This is what happens when sales operation planning exists on paper but not in practice.
So what's S&OP in practical terms? Sales and operations planning is the cross-functional process that aligns demand, supply, finance, and product decisions into a single integrated plan. Oliver Wight formalized it in the 1980s, and decades later, most companies still get it wrong - not because the concept is complicated, but because the execution requires discipline that organizations consistently underestimate.
Need to justify S&OP to your CFO? Jump to The Business Case - the EBITDA and inventory numbers do the talking. Need to actually run S&OP meetings? Jump to [The Monthly Cadence Template](#monthly-sop-cadence - a-4-meeting-template). Your S&OP exists but nothing changes? Jump to [Why S&OP Fails](#why-sop-fails - 5-root-causes).
The Business Case for S&OP
Let's start with the numbers executives care about. AlixPartners research puts the impact of prioritizing S&OP at 5-10% improvement in EBITDA and 10-30% reduction in inventory levels. For a $200M manufacturer, that's $10-20M in EBITDA. Those aren't marginal gains.
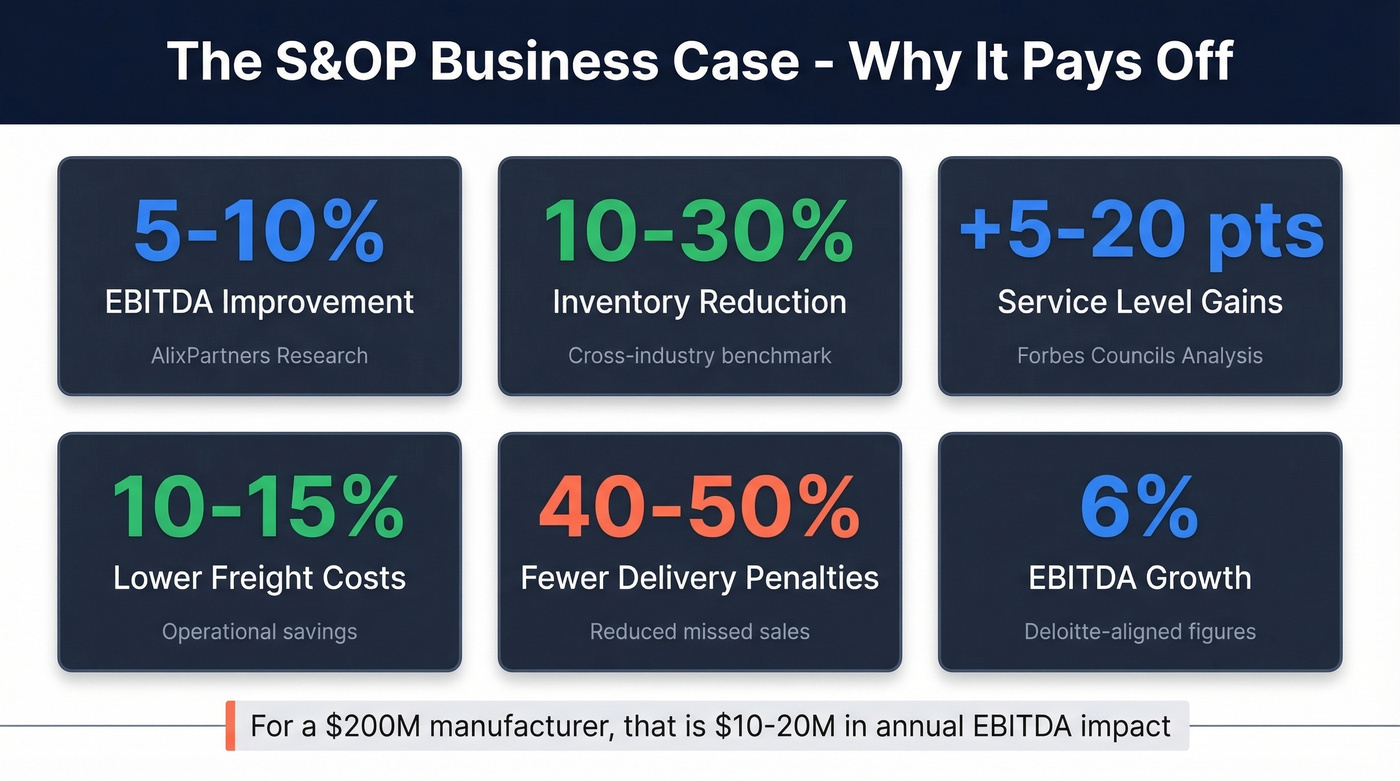
The downstream effects stack up. A Forbes Councils analysis attributes effective planning to +5-20 points in service levels, 10-15% lower freight costs, and 40-50% fewer delivery penalties and missed sales. Separate Deloitte-aligned figures point to 6% EBITDA growth, 10% improvement in on-time deliveries, and 25% inventory reduction.
Eaton provides a concrete case. In an ASCM case study, Eaton reduced days of on-hand inventory by 10% as of 2020 and was tracking toward a 20% total reduction by the end of 2022. That's a Fortune 500 industrial manufacturer delivering measurable results across the business - not a pilot program.
Here's the uncomfortable truth: the reason S&OP gets deprioritized isn't that the ROI is unclear. It's that the benefits take time, cross-functional collaboration is genuinely hard, and the initiative competes with shinier digital transformation projects. But no supply chain transformation delivers sustained results without S&OP as the backbone. AlixPartners calls S&OP neglect the key reason supply chain transformations fall short - and we've seen that play out repeatedly.
The 6-Step S&OP Process
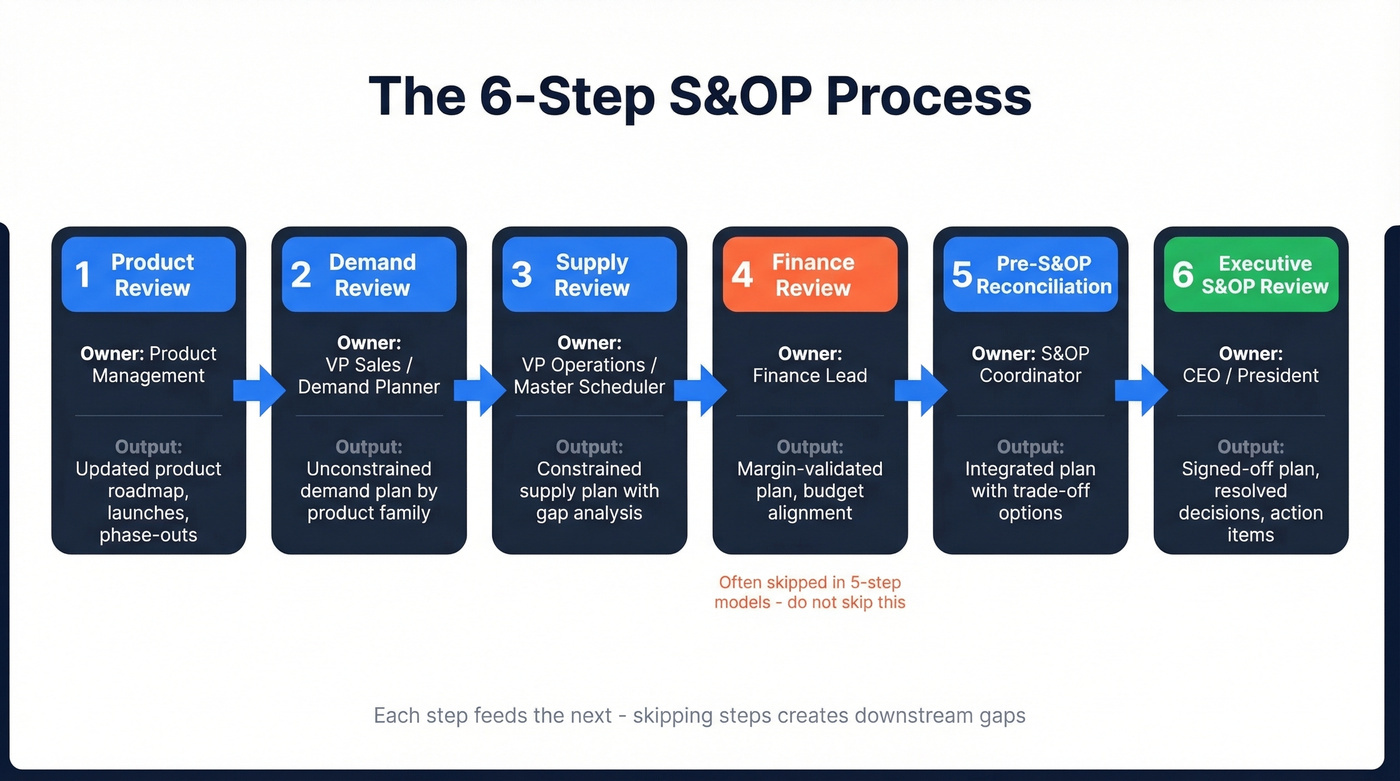
Many frameworks describe S&OP as a five-step process. We use six. The difference matters.
Product Review
This is where S&OP starts - not with a forecast, but with the portfolio. Product management reviews upcoming launches, phase-outs, discontinuations, and engineering changes. The output is an updated product roadmap that feeds every downstream step. Skip this, and your demand plan will include products that don't exist yet while missing ones about to launch. Product Management owns this step, with inputs from new product timelines, end-of-life decisions, and portfolio rationalization data.
Demand Review
This matters more than any other step. Constraining demand too early hides the real gap between what customers need and what you can deliver. The demand planning team builds an unconstrained demand plan - what the market wants, regardless of whether you can supply it. The VP of Sales or Demand Planner owns this output: unconstrained demand by product family, including bookings, shipments, and backlog by demand stream.
Sales and marketing input is non-negotiable here. A demand plan built solely by the planning team is a math exercise, not a market signal.
Supply Review
Operations takes the unconstrained demand plan and maps it against capacity, materials, and labor constraints. The output is a constrained supply plan by product family and site. Where supply can't meet demand, the team documents the gap and proposes alternatives - overtime, outsourcing, allocation rules. The VP of Operations or Master Scheduler owns this, delivering a constrained supply plan with identified gaps and recommended actions.
Finance Review
Many five-step S&OP models don't separate this as its own step - and that's a mistake. Finance validates whether the integrated demand-supply plan aligns with margin targets, budget assumptions, and capital constraints. Without this step, you end up with a plan that's operationally feasible but financially underwater. If the plan requires $3M in overtime to hit service targets, finance needs to weigh that against the margin impact before it reaches the executive table.
This step also solves a hidden failure mode: when sales talks units, operations talks capacity, and finance talks dollars, nobody's speaking the same language. Making finance the common denominator is what the Finance Review forces.
Pre-S&OP Reconciliation
The S&OP Coordinator pulls together the product, demand, supply, and finance outputs into a single proposed plan. Trade-off recommendations get documented - not resolved. The goal is to present the executive team with clear options, not a fait accompli. The output includes constrained shipping, bookings/backlog, production plan, inventory plan, and capability plan per product family. This is the heaviest lift in the cycle, and it's where a strong coordinator earns their salary.
Executive S&OP Review
The CEO or President reviews the plan family by family, resolves open issues, captures action items, and signs off. This isn't a rubber stamp. If the executive meeting doesn't produce decisions, it's a status update - cancel it and get that hour back. The executive review should take 60-90 minutes for a mid-size company. If it's running three hours, you're doing Pre-S&OP reconciliation in the wrong room.
Monthly S&OP Cadence - A 4-Meeting Template
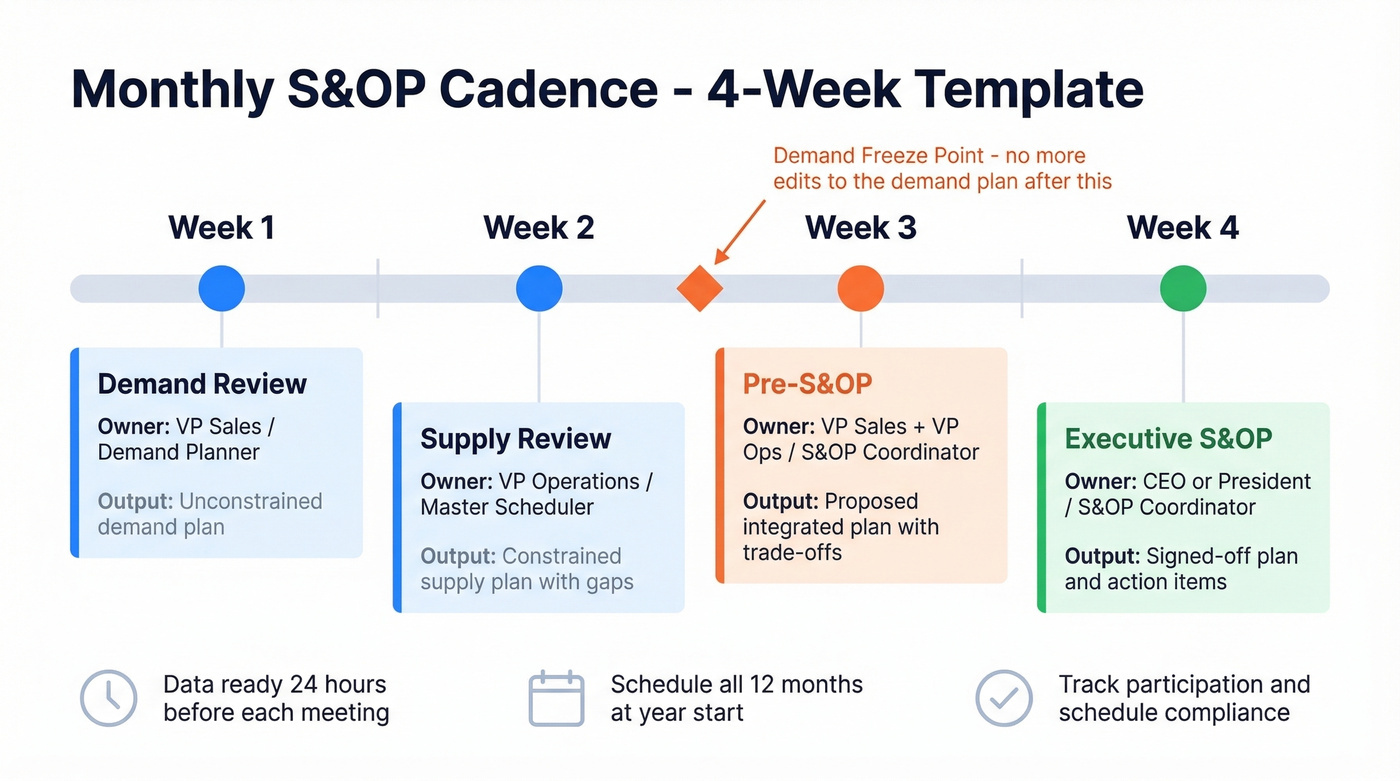
A four-meeting monthly cadence is the standard template. Each meeting has a distinct output, a clear owner, and a defined responsible party.
| Meeting | Output | Owner / Responsible | Timing |
|---|---|---|---|
| Demand Review | Unconstrained demand plan | VP Sales / Demand Planner | Week 1 |
| Supply Review | Constrained supply plan | VP Operations / Master Scheduler | Week 2 |
| Pre-S&OP | Proposed integrated plan | VP Sales + VP Ops / S&OP Coordinator | Week 3 |
| Executive S&OP | Signed-off plan + actions | CEO/President / S&OP Coordinator | Week 4 |
Three operational rules make this cadence work. First, all data must be prepared 24 hours in advance - if people are building slides during the meeting, you've already lost. Second, schedule all 12 months of meetings at the start of the year, six months minimum. Cancellations are the first sign of decay. Third, measure adherence: participation rates, data readiness, and schedule compliance.
One concept that separates functional S&OP from performative S&OP: the demand freeze point. At a defined point in the monthly cycle, edits to the demand plan stop. Without this discipline, the plan keeps shifting and supply can never stabilize against a moving target. Rockwell Automation's implementation guide identifies defining this freeze point as a prerequisite for moving the process forward each month.
Some vendors - Kinaxis in particular - argue that monthly cadence is too linear and push for more continuous, concurrent planning. There's merit to that for digitally mature organizations. But for most companies, nailing the monthly discipline is the prerequisite before moving to continuous planning. Walk before you run.
Roles and Responsibilities
Clear ownership is what separates S&OP that drives decisions from S&OP that produces slide decks.
| Role | Accountable For | Key Responsibility |
|---|---|---|
| CEO / COO | Final decisions, sponsorship | Chairs executive review |
| VP Sales | Demand forecast ownership | Validates market assumptions |
| VP Operations | Supply plan feasibility | Chairs supply review |
| Demand Planner | Forecast rollup + analysis | Builds unconstrained plan |
| Master Scheduler | Supply attributes + constraints | Maintains capacity model |
| S&OP Coordinator | Process engine | Meeting prep, data flow, action tracking |
| Finance Lead | Budget + margin validation | Validates financial feasibility |
The S&OP Coordinator role deserves special attention. This person doesn't own the plan - they own the process. They're responsible for data flowing between meetings, pre-reads going out on time, action items getting tracked, and the overall cadence running on schedule. In our experience, the single highest-leverage hire for an S&OP program isn't a fancy planning tool. It's a strong coordinator.
Here's the litmus test: does the executive review end with signed-off actions and resolved trade-offs, or does it end with "let's take that offline"? If it's the latter, you don't have S&OP. You have a monthly PowerPoint ritual.
KPIs and Benchmarks
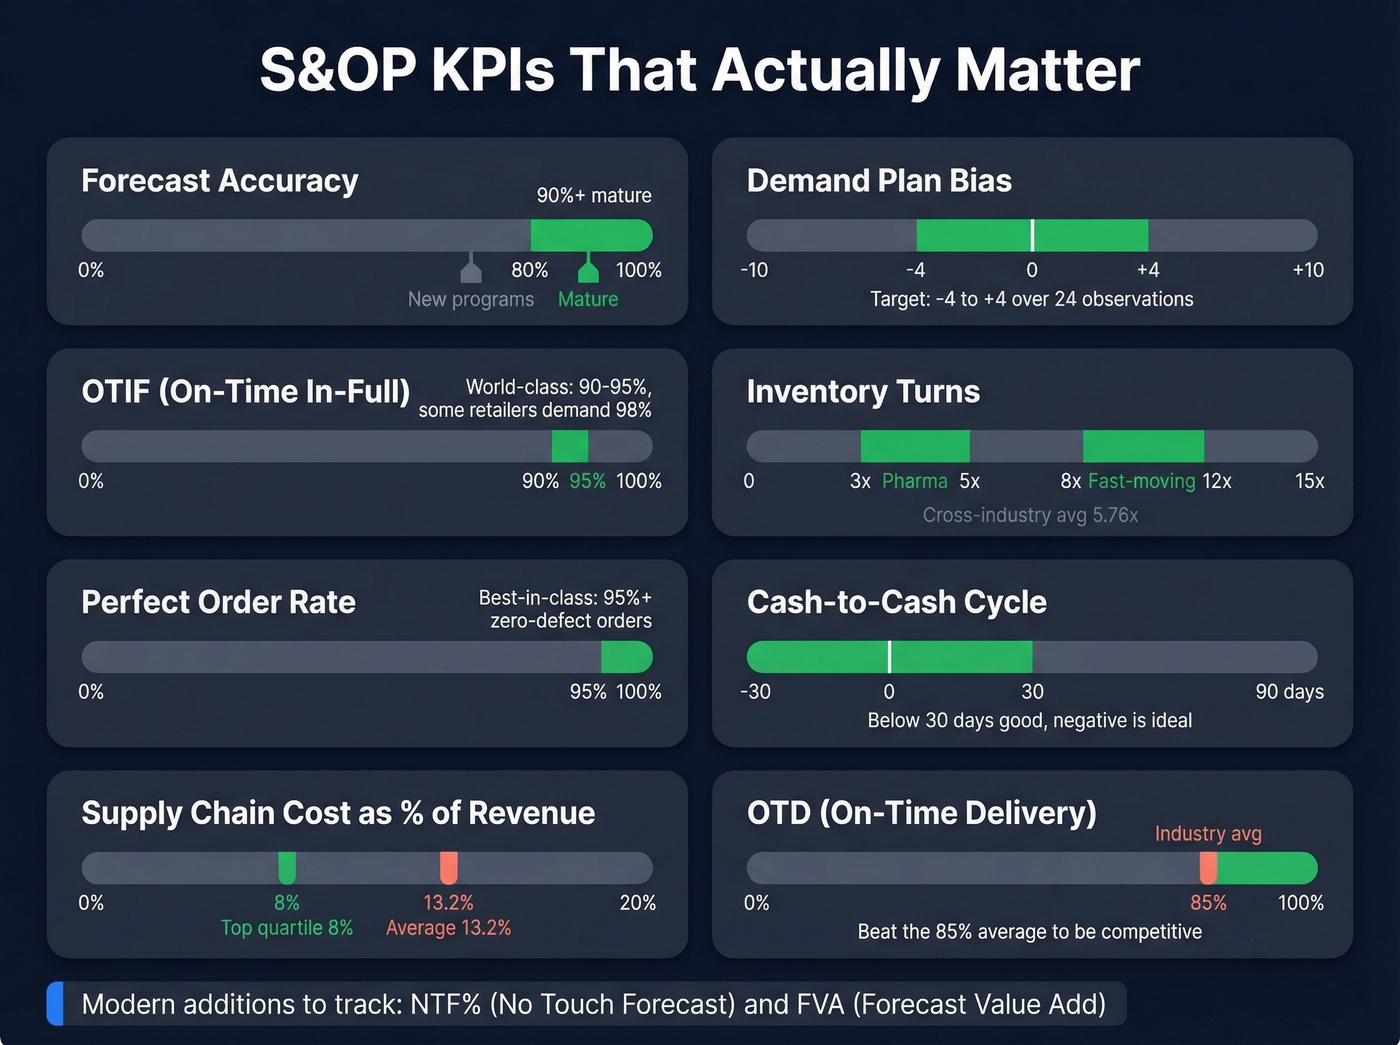
You can't improve what you don't measure, but you can definitely measure the wrong things. Here are the KPIs that matter, with benchmark ranges that reflect what "good" actually looks like:
| KPI | Formula / Definition | Target Range | Context |
|---|---|---|---|
| Forecast Accuracy | 1 - (|Actual - Forecast| / Actual) | 90%+ mature; 80%+ new | Some benchmarks cite 75-85% for stable lines |
| Demand Plan Bias | Sum(Forecast - Actual) / n | -4 to +4 over 24 obs | Persistent bias signals process issues |
| OTIF | On-time + in-full % | 90-95% world-class | Some retailers demand 98% |
| Inventory Turns | COGS / Avg Inventory | 8-12 fast-moving; 3-5 pharma | Cross-industry avg ~5.76x |
| Perfect Order Rate | % orders with zero defects | 95%+ best-in-class | On-time, complete, undamaged, accurate docs |
| Cash-to-Cash Cycle | DIO + DSO - DPO | <30 days; negative is ideal | Working capital efficiency |
| Supply Chain Cost | Total SC cost / Revenue | ~8% top quartile; 13.2% avg | Includes logistics, warehousing, planning |
| OTD | On-time delivery % | Beat 85% avg | Beating average is competitive |
Two modern metrics worth adding to your dashboard. NTF% (No Touch Forecast %) measures the percentage of forecast grains that don't require planner intervention - a proxy for forecast automation maturity. FVA (Forecast Value Add) measures whether human overrides actually improve forecast accuracy or make it worse. Both force honest conversations about where planners add value versus where they're just adjusting numbers for comfort.

Forecast accuracy starts with data accuracy. If a meaningful share of prospect records in your CRM are outdated, pipeline-based demand forecasts inherit that error from day one. Tools like Prospeo, with a 7-day data refresh cycle and 98% email accuracy, keep the CRM data feeding your demand planning process reliable - so your S&OP inputs aren't six weeks stale before the cycle even begins.
S&OP alignment starts with reaching the right stakeholders. When your demand review depends on accurate sales input, bad contact data breaks the entire cycle. Prospeo gives you 300M+ profiles with 98% email accuracy and 125M+ verified mobiles - refreshed every 7 days.
Stop planning around contacts you can't actually reach.
S&OP vs. IBP vs. S&OE
These three acronyms cause more confusion than they should. Let's break them down.
S&OP vs. IBP:
| Dimension | S&OP | IBP |
|---|---|---|
| Origin | 1980s (Oliver Wight) | Early 2000s |
| Horizon | 6-12 months | 24+ months |
| Finance Role | Peripheral | Central |
| Scope | Demand-supply balance | Full portfolio + financial integration |
IBP isn't a replacement for S&OP - it's an evolution. Oliver Wight positions S&OP as the foundation and IBP as the maturity stage where finance, strategy, and portfolio management become fully integrated into the planning cycle. Most companies claiming to do IBP are actually doing S&OP with a finance slide bolted on. That's fine - just be honest about where you are.
S&OP vs. S&OE:
| Dimension | S&OP | S&OE |
|---|---|---|
| Cadence | Monthly | Daily / Weekly |
| Horizon | 3-24 months | 0-13 weeks |
| Focus | Planning alignment | Execution of the plan |
| Tech | APS / IBP platforms | ERP / WMS / TMS + real-time analytics |
S&OE is the execution bridge. Without it, your monthly S&OP plan sits in a slide deck while operations runs on gut feel and firefighting. S&OE takes the signed-off plan and manages short-term deviations - demand spikes, supply disruptions, logistics delays - through weekly or daily touchpoints.
Why S&OP Fails - 5 Root Causes
Five root causes account for the vast majority of failures in sales operation planning. We've seen all of them, usually in combination.
1. No executive sponsorship. Without a CEO or COO actively chairing the executive review, S&OP devolves into a reporting exercise within two quarters. The symptom: functional leaders start sending delegates. The fix: the executive sponsor must attend every meeting and visibly make decisions. If the CEO cancels twice, the program is dead - they just don't know it yet.
2. Missing functional leaders. Anaplan's S&OP guide calls this the "empty seat" problem. When finance, sales, or marketing don't show up, critical inputs - new product launches, promotional plans, budget constraints - get missed. The plan becomes operationally focused but commercially blind. Remedy: make attendance a performance metric for functional VPs.
3. Inadequate technology. Excel is still the dominant S&OP tool at most mid-market companies. That limits scenario modeling, makes version control a nightmare, and turns the coordinator into a spreadsheet jockey. But don't blame Excel - premature software purchases are the real enemy. We've watched teams spend $200K on planning software before they had a functioning monthly cadence. Fix the process first. Buy the tool second.
4. Non-value-added meetings. When teams show up unprepared, meetings become status updates instead of decision forums. The consensus on Reddit's supply chain communities echoes this: S&OP isn't a quick win, and meetings without prep are the fastest way to kill momentum. Enforce the 24-hour data prep rule and publish a pre-read. If the pre-read isn't ready, cancel the meeting.
5. No execution bridge. Without S&OE, the monthly plan has no mechanism to adapt to reality. Demand shifts in week two, but the next S&OP cycle isn't until week four. The gap gets filled with ad hoc decisions, email chains, and firefighting. Implement weekly S&OE touchpoints covering the 0-13 week horizon.
The biggest threat to your S&OP isn't bad software - it's bad data. Demand forecasts are built on sales pipeline data, and if CRM contacts are stale or bouncing, the entire planning output is compromised before the first meeting starts.
Your S&OP process needs cross-functional buy-in from decision-makers across sales, ops, and finance. Prospeo's 30+ filters - including department headcount, job changes, and buyer intent - help you identify and connect with the exact stakeholders who drive planning decisions.
Find every decision-maker in the room for $0.01 per email.
Assessing Your S&OP Maturity
Before you can improve S&OP, you need an honest baseline. The IBF S&OP Maturity Self-Assessment is the most practical framework available. It evaluates four dimensions - People, Process, Analytics, and Technology - across 13 attributes, each scored on a 0-100% scale. The output assigns a maturity level from Emerging through Vanguard.
In practice, low scores cluster predictably. Metrics and Analytics are almost always the weakest dimensions: functional metrics aren't tied to business objectives, reporting is descriptive rather than diagnostic, and trade-off analysis is manual or nonexistent. Technology scores tend to be slightly better, if only because companies have at least invested in ERP systems, even if they're not using them for planning.
The temptation is to attack the lowest score first. Resist it. Combine your maturity results with a SWOT analysis to prioritize based on impact, not just weakness. A Process score of 40% might matter more than an Analytics score of 30% if your meetings aren't producing decisions. Fix the decision-making cadence first, then layer in better analytics.
One practical tip: the IBF assessment is designed for an established S&OP lead with several years of operating experience. If you're just starting out, have two or three cross-functional leaders complete it independently, then compare scores. The gaps between their assessments are often more revealing than the scores themselves.
AI in S&OP - What Works in 2026
Look, AI doesn't fix a broken planning process. It accelerates a working one.
The practitioner consensus is clear: "AI is not the strategy - clarity is." The value comes from defining the decision you're trying to make before applying machine learning to the forecast. Decision quality matters more than forecast error reduction.
Planners spend up to 50% of their time gathering and manipulating data before they ever get to actual forecasting or decision support. Automating that data wrangling - pulling demand signals, cleaning inputs, generating exception reports - frees planners to do what humans do better: asking better questions, challenging assumptions, explaining trade-offs to executives, and building cross-functional trust.
Two metrics keep AI honest. NTF% measures how much of the forecast runs autonomously without planner intervention. FVA measures whether human overrides improve or degrade accuracy. Together, they create accountability for both the algorithm and the planner.
The companies getting real value from AI in planning aren't the ones with the fanciest models. They're the ones with clean data, clear governance, and a culture that normalizes being wrong - as long as you sense the deviation quickly and adjust.
S&OP Software Landscape
If you're evaluating S&OP software, here's the landscape as of 2026. These are typical ranges based on industry benchmarks - actual pricing varies by module count, user seats, and implementation scope.
| Vendor | Positioning | Best For | Est. Annual Cost |
|---|---|---|---|
| SAP IBP | Enterprise standard | SAP-centric orgs | $100K-$500K+/yr |
| Oracle Cloud SCM | Full suite play | Oracle ERP shops | $75K-$400K+/yr |
| Kinaxis RapidResponse | Concurrent planning | Complex supply networks | $100K-$500K+/yr |
| Anaplan | Accessible mid-market | Growing companies | $30K-$150K+/yr |
| o9 Solutions | AI-native platform | Data-rich environments | $100K-$500K+/yr |
| Blue Yonder | Retail/CPG strength | Consumer goods | $75K-$400K+/yr |
Total first-year cost of ownership is typically 2-3x the license fee once you factor in consulting, data migration, change management, and training. Other vendors worth evaluating include E2open, Logility, and DemandCaster - particularly for mid-market companies looking for focused planning tools rather than full-suite platforms.
I'll say it plainly: if your average contract value is under $50K and you're under $500M in revenue, you don't need SAP IBP. Start with Anaplan or a well-structured Excel model with disciplined governance. The process maturity matters more than the platform. I've seen $50M companies run excellent S&OP on spreadsheets and $2B companies run terrible S&OP on Kinaxis. The tool doesn't create the discipline.
Kinaxis is powerful but the UI has a learning curve that frustrates new users. o9 is genuinely innovative but requires heavy configuration - budget for implementation support. SAP IBP is the safe choice if you're already in the SAP ecosystem, but skip it if you haven't nailed the monthly cadence yet.
FAQ
What is sales and operations planning?
Sales and operations planning is the monthly cross-functional process that aligns demand forecasts, supply capacity, financial targets, and product portfolio decisions into a single, executive-approved business plan. It bridges strategy and execution by forcing trade-off decisions across sales, operations, and finance on a regular cadence.
How often should S&OP meetings happen?
Monthly is the standard cadence and works for most organizations. Weekly S&OE meetings bridge the gap for the 0-13 week execution horizon. Don't try to run S&OP weekly - you'll burn out the team and collapse the distinction between planning and execution.
Who should lead the S&OP process?
The CEO or COO sponsors S&OP and chairs the executive review - non-negotiable. An S&OP Coordinator runs day-to-day process: meeting prep, data flow, and action tracking. Without both roles filled, the process stalls within a quarter.
What's the difference between S&OP and demand planning?
Demand planning is one input to S&OP, not a synonym. S&OP balances demand against supply constraints, financial targets, and portfolio decisions across functions. Demand planning produces the forecast; S&OP turns it into an integrated, executable business plan.
How do you keep CRM data accurate for demand forecasting?
Use a B2B data platform with automated refresh cycles rather than relying on manual updates. Prospeo refreshes contact data every 7 days and verifies emails at 98% accuracy, preventing stale pipeline data from corrupting the demand signals that feed your S&OP process.