The 12 Sales Operations KPIs That Actually Matter in 2026
It's Thursday at 4 PM. Your CRO wants the forecast by end of day. You pull up the dashboard, stare at 47 metrics, and realize you can't confidently answer the only question that matters: are we going to hit the number?
You're not alone. 69% of B2B sales reps missed quota in the most recent Ebsta & Pavilion benchmark. The problem isn't effort - most sales operations teams are tracking dozens of sales operations KPIs and understanding none of them. We've watched teams drown in dashboards while the pipeline quietly bleeds out underneath.
Here's the framework we use to cut through that noise. Twelve metrics, organized by cadence, with benchmarks that tell you what "good" actually looks like.
The Five KPIs You Need (Quick Version)
If you track nothing else, track these five. They cover activity, efficiency, and predictability.
- Pipeline velocity - the single number that ties activity to revenue. Healthy B2B teams target consistent month-over-month improvement.
- Win rate - 20-30% is average; 35-40% is best-in-class. Below 20%, your qualification process is broken.
- Sales cycle length - 3-6 months for most B2B. Segment by deal size or it's meaningless.
- Pipeline coverage ratio - 3-4x quota minimum. If your win rate is below 25%, you need 4-5x.
- Forecast accuracy - ~70% is solid; 80%+ is excellent. If you're consistently off by more than 30%, your pipeline hygiene needs work.
Start here. Add complexity only when your data maturity supports it.
Leading vs. Lagging Indicators
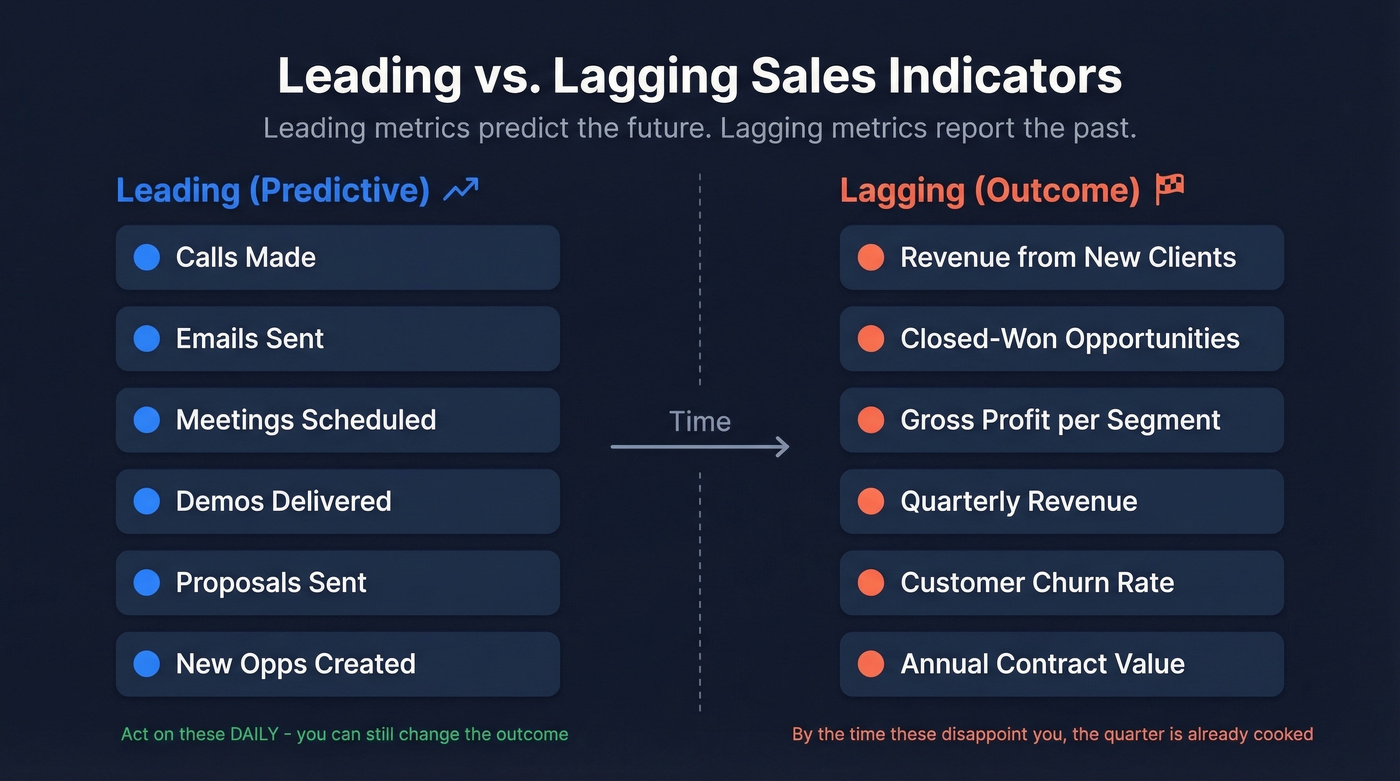
This distinction separates reactive sales orgs from proactive ones. Lagging indicators - revenue, closed-won deals, gross profit - tell you what already happened. Leading indicators - calls made, meetings booked, proposals sent - tell you what's about to happen.
Most teams obsess over lagging metrics and then scramble when the quarter's already lost.
| Leading (Predictive) | Lagging (Outcome) |
|---|---|
| Calls made | Revenue from new clients |
| Emails sent | Closed-won opportunities |
| Meetings scheduled | Gross profit per segment |
| Demos delivered | Quarterly revenue |
| Proposals sent | Customer churn rate |
| New opps created | Annual contract value |
Altus Alliance recommends tracking eight leading indicators - everything from leads created to close ratio - because by the time lagging numbers disappoint you, the quarter is already cooked.
Let's make this concrete. An SDR makes 2,000 calls in a month and generates one opportunity. That lagging metric looks terrible. But the leading metrics reveal the actual problem: maybe 1,800 of those calls went to unverified numbers, or the talk track converted at 0.05% instead of the expected 2-3%. It takes an average of 8-12 meaningful touchpoints before a successful connection. If your team abandons after 3-4 attempts, the pipeline math never works - and you won't see it in the lagging numbers until it's too late.
The fix is simple in theory: review leading indicators daily so you can intervene before lagging metrics go sideways. In practice, it requires discipline and clean data.
The 12 Essential Sales Ops Metrics
We've organized these using Claap's tier framework: daily activity levers, weekly performance checks, and monthly/quarterly strategic metrics. Each KPI includes a formula, benchmark, review cadence, and the role that owns it.
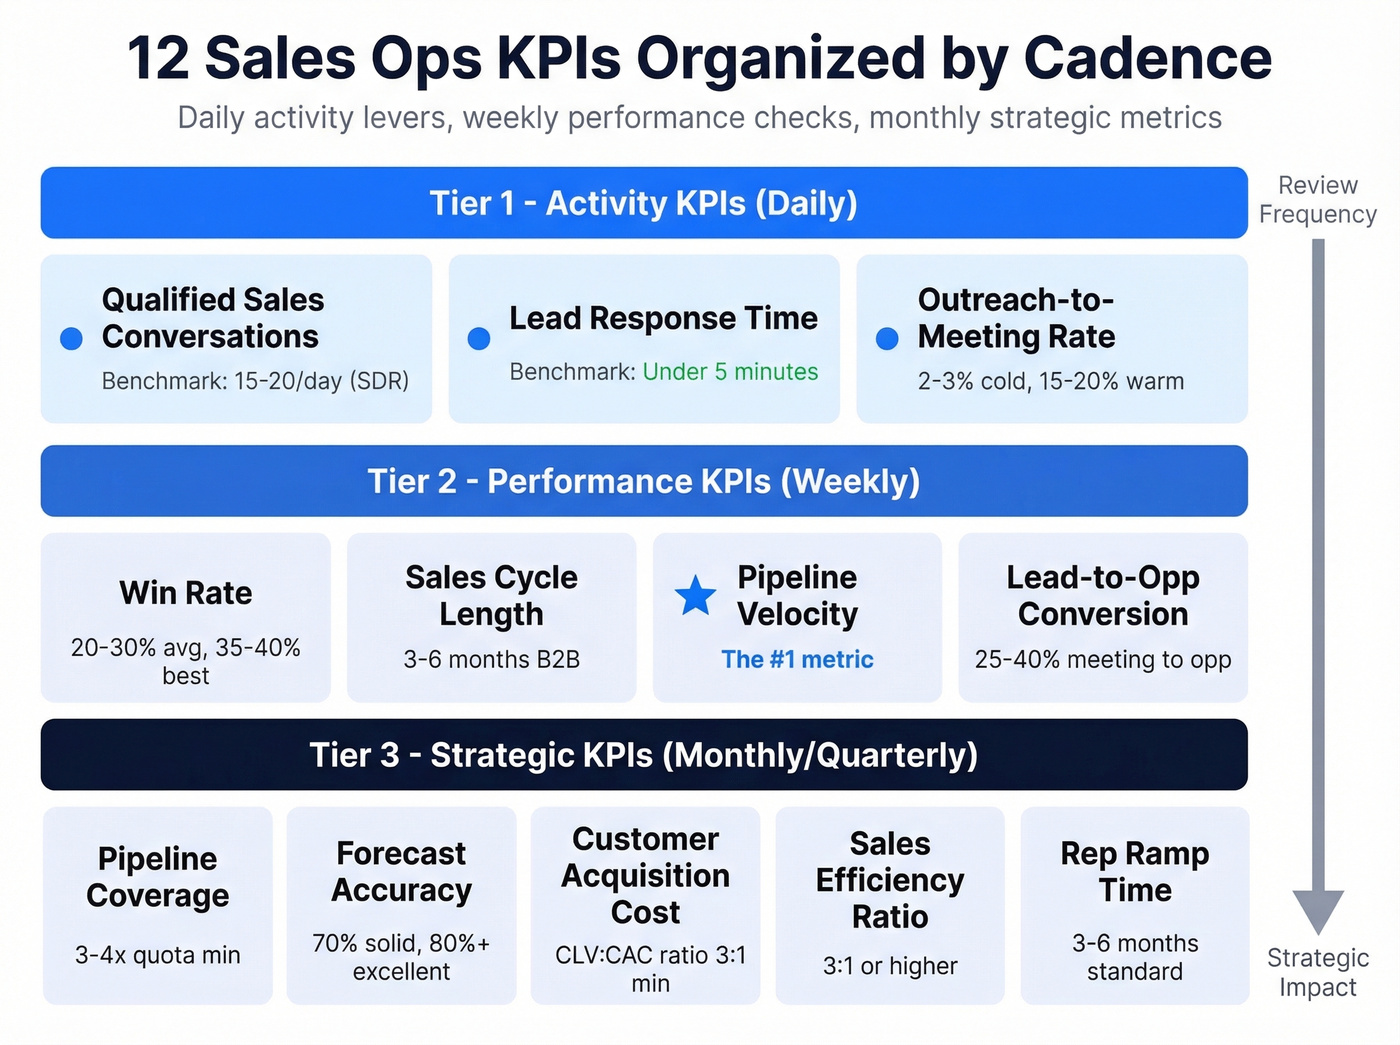
Tier 1 - Activity KPIs (Daily)
Qualified Sales Conversations
A qualified sales conversation is any exchange where a prospect engages on pain, budget, or timeline - not a "hello, wrong number" dial.
Formula: Count of conversations where a prospect engages on pain, budget, or timeline.
SDRs should target 15-20 per day; AEs should hit 8-12. This is your most granular leading indicator and the first place to look when pipeline generation stalls.
Cadence: Daily. Owner: SDR/AE manager.
Lead Response Time
The clock starts the moment a lead fills out a form or triggers an inbound signal.
35-50% of deals go to the first responder, with 8-21x higher conversion when response time drops below five minutes. If your team averages 30+ minutes, you're handing deals to competitors who move faster. That's not a theory - it's math.
Benchmark: Under 5 minutes. Cadence: Daily, with real-time alerts preferred. Owner: SDR manager / marketing ops.
Outreach-to-Meeting Rate
This captures how efficiently your outreach converts into booked meetings - the bridge between activity volume and pipeline creation.
Formula: Meetings booked / outreach attempts x 100.
Cold outreach converts at 2-3%. Warm outreach from inbound leads, referrals, or intent-triggered signals converts at 15-20%. If your cold number is below 1%, check your targeting and messaging before blaming the channel. For teams running warm outreach below 10%, the problem is usually lead scoring or routing - value is leaking somewhere in the handoff.
Cadence: Daily/weekly. Owner: SDR manager.
Tier 2 - Performance KPIs (Weekly)
Win Rate
Here's the thing about win rate: without pipeline quality context, it's a vanity metric. A team with a 50% win rate and 12 opportunities isn't outperforming a team with a 25% win rate and 200 opportunities. Always pair win rate with pipeline volume.
Formula: Closed-won / total opportunities x 100.
20-30% is average for most B2B teams. Best-in-class hit 35-40%. We've seen teams celebrate a 45% win rate while missing quota by 30% - because they weren't generating enough pipeline to begin with.
Cadence: Weekly. Owner: Sales manager / VP Sales.
Sales Cycle Length
Formula: Sum of days to close / number of deals closed.
Three to six months is the B2B norm, but this varies wildly by segment. SMB deals close in 2-6 weeks; enterprise deals can stretch to 9+ months. The critical move is segmenting by deal size - a blended average across $5K and $500K deals tells you nothing useful. Track deal slippage alongside this. Deals that push past their expected close date should stay below 20% of your pipeline, or your forecast accuracy will suffer.
Cadence: Weekly. Owner: Sales ops.
Pipeline Velocity
Pipeline velocity is the single most actionable KPI in sales operations. Full stop. It's the only metric that combines volume, value, efficiency, and speed into one number.
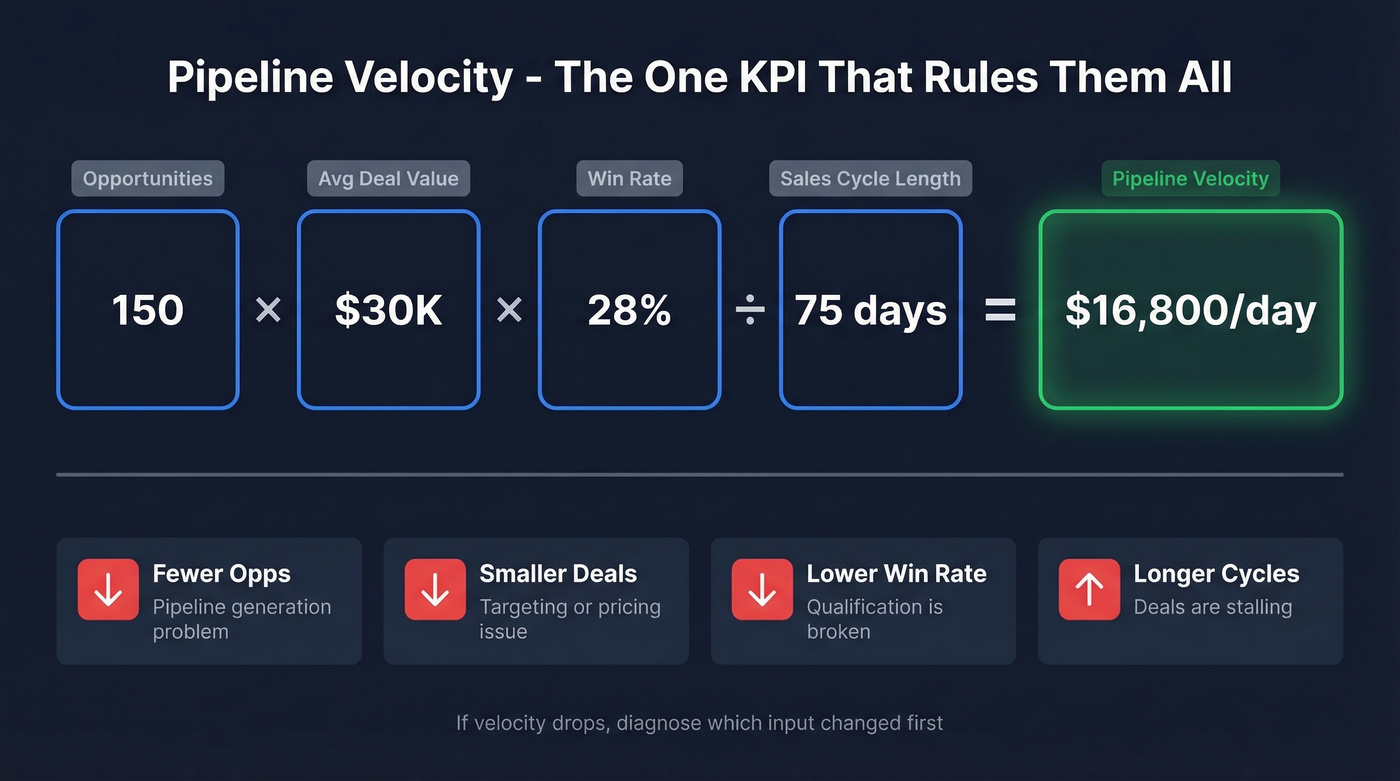
Formula: (Opportunities x avg deal value x win rate) / sales cycle length.
Worked example: 150 opportunities x $30K average deal x 28% win rate / 75-day cycle = $16,800/day in pipeline velocity. If that number drops next week, you can immediately diagnose which input changed - fewer opportunities, smaller deals, lower win rate, or longer cycles. Every other KPI feeds into this one.
In our experience, sales ops practitioners treat pipeline velocity as the first metric they check Monday morning. If you could keep only one KPI, this is it.
Cadence: Weekly. Owner: Sales ops / VP Sales.
Lead-to-Opportunity Conversion
This tracks how effectively your team turns raw leads into qualified pipeline - the handoff point where marketing and sales alignment lives or dies.
Formula: Leads converted to opportunities / total leads x 100.
Meeting-to-opportunity conversion should run 25-40%. Below 25%, either your qualification criteria are too loose (letting bad leads through) or too tight (reps failing to create opportunities they should). This is where RevOps teams earn their keep - diagnosing whether the problem is lead quality, rep behavior, or both.
Cadence: Weekly. Owner: Sales ops / demand gen.
Tier 3 - Strategic KPIs (Monthly/Quarterly)
Pipeline Coverage Ratio
Pipeline coverage tells you whether you have enough active pipeline to realistically hit quota. It's the metric your CFO should watch alongside the forecast.
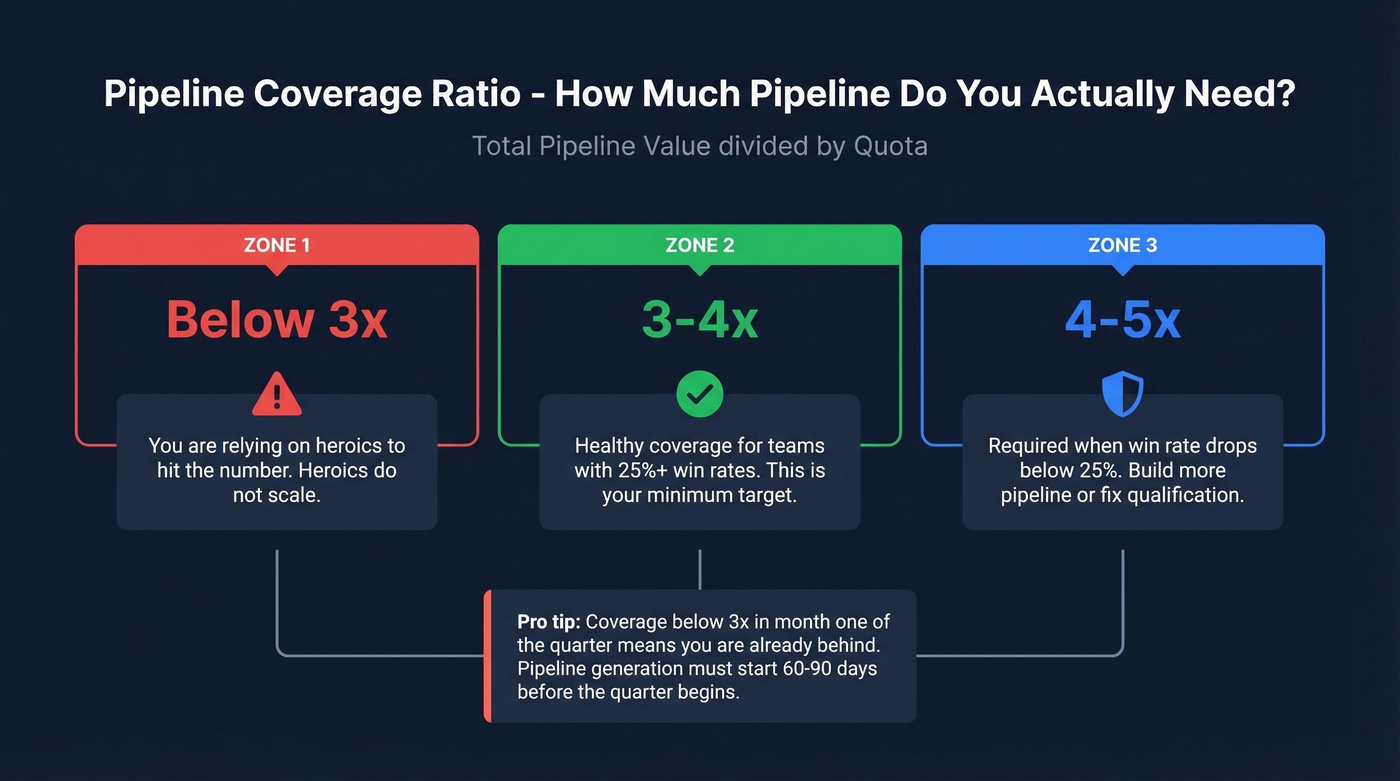
Formula: Total pipeline value / quota.
3-4x quota is the minimum. If your win rate is below 25%, push to 4-5x. Coverage below 3x means you're relying on heroics to hit the number, and heroics don't scale.
Cadence: Monthly. Owner: VP Sales / CRO.
Forecast Accuracy
This measures how close your predicted revenue lands to actual results - the credibility metric for your entire sales operations function.
Formula: 1 - |(actual - forecast) / actual|.
~70% accuracy is solid in most B2B contexts. 80%+ is excellent. A technical note: standard MAPE breaks when actual values are low because the denominator inflates the error. WAPE, which weights by total actuals, is more reliable for teams with lumpy deal flow. Track bias direction too - positive bias means you're under-forecasting, negative means over-forecasting. Consistent bias in one direction is more fixable than random variance.
Cadence: Monthly/quarterly. Owner: Sales ops / CRO.
Customer Acquisition Cost
Formula: Total sales + marketing spend / new customers acquired.
The benchmark that matters isn't CAC in isolation - it's the CLV:CAC ratio. 3:1 is the minimum viable ratio; 4:1 is optimal. Below 3:1, you're spending more to acquire customers than they're worth. MaverickRE flags a common scenario: teams spending $5,000 cumulatively to generate $3,000 in net profit per transaction. That's a business model problem, not a sales problem.
Cadence: Monthly/quarterly. Owner: Finance / RevOps.
Sales Efficiency Ratio
Formula: Revenue generated / cost of sales.
3:1 or higher is the target. This is the executive-level version of "are we spending sales dollars wisely?" It captures everything - comp, tools, travel, enablement - against the revenue those investments produce. Below 2:1, something structural needs to change.
Cadence: Quarterly. Owner: CRO / Finance.
Rep Ramp Time
This is the KPI that quietly destroys sales efficiency when nobody's watching.
3-6 months is standard for B2B roles. Track this alongside annual turnover, which you want below 15%. If ramp time is 6 months and turnover is 30%, you're spending half the year getting reps productive before they leave. We've seen teams cut ramp time nearly in half by pairing this metric with structured onboarding and shadowing programs - the measurement itself forces the investment.
Cadence: Quarterly. Owner: Sales enablement / VP Sales.
Your outreach-to-meeting rate tanks when 1,800 out of 2,000 calls hit unverified numbers. Prospeo gives your SDRs 125M+ verified mobile numbers with a 30% pickup rate - so every activity KPI on your dashboard reflects real conversations, not wasted dials.
Stop measuring activity that never had a chance of converting.
KPI Priorities by Company Stage
Not every KPI matters equally at every stage. Insight Partners analyzed 275+ companies and found that priorities shift dramatically as companies scale toward $100M ARR.
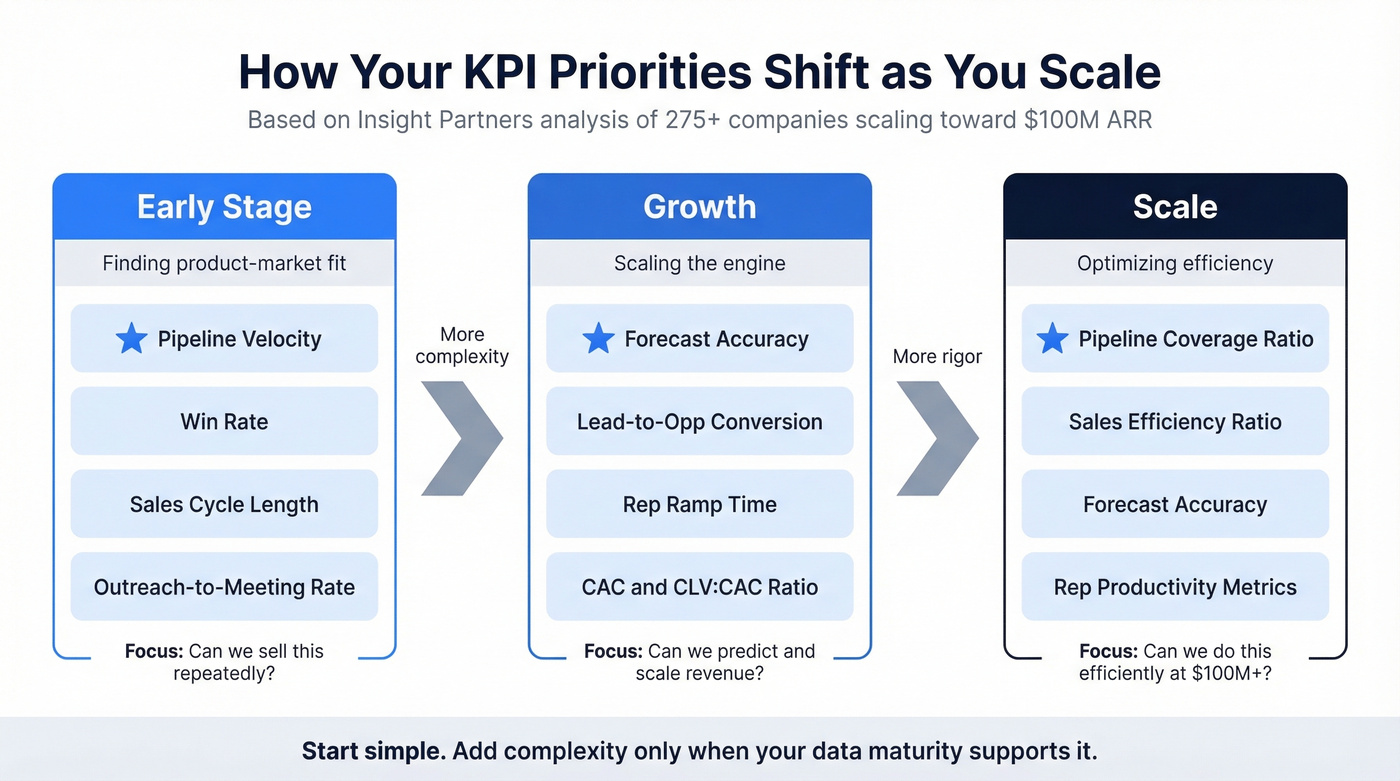
| Early Stage | Growth | Scale |
|---|---|---|
| Pipeline velocity | Forecast accuracy | Coverage ratio |
| Lead conversion | CAC + CLV:CAC | CLV:CAC trends |
| Cycle length | Rep ramp time | Rep retention |
| Win rate | Quota attainment | Market share |
| Outreach-to-meeting | Sales efficiency | Revenue per rep |
Early-stage teams should obsess over pipeline velocity and conversion rates - you're proving the motion works. If you're running deals under $15K, you probably don't need twelve KPIs. Five will do. Prove the funnel math first.
Growth-stage teams add forecast accuracy and CAC because predictability matters when you're hiring aggressively. This is also where rep ramp time becomes critical - every month a new hire isn't productive is a month of burned quota capacity. RevOps teams at this stage typically start formalizing the dashboard cadence we describe below.
At scale, the game shifts to efficiency and retention: coverage ratios, CLV:CAC trends, and whether your reps stick around long enough to justify the ramp investment. The companies that win here track revenue per rep alongside total revenue - growth without efficiency is just expensive growth.
Build Your KPIs Dashboard
The dashboard isn't the hard part. The hard part is making sure the data feeding it is accurate. Real-time analytics, early issue identification, reduced manual reporting - those benefits evaporate if your CRM is full of stale contacts and bounced emails.
Before you build dashboards, clean your data. Prospeo's CRM and CSV enrichment returns 50+ data points per contact at a 92% API match rate - plug it into Salesforce or HubSpot and your KPIs start telling the truth instead of reflecting six-month-old records.
Once the data's clean, customize views by role. Reps need activity metrics and their personal pipeline. Managers need team performance roll-ups and forecast accuracy by rep. Execs need revenue trends, growth rates, and efficiency ratios. Layering in sales execution metrics at the rep level - outreach-to-meeting rate, qualified conversations - ensures managers can diagnose performance gaps before they show up in the weekly numbers.
Consider adding a pipeline hygiene score to your dashboard: a composite metric that flags stale opportunities, missing close dates, and deals without next steps. Teams that track pipeline health catch forecast-killing data rot before it spreads.
AI is changing how teams monitor these metrics, too. AI features in CRMs and conversation intelligence platforms can flag stalled deals automatically, surface anomalies in pipeline velocity, and generate forecast adjustments based on email and call sentiment. You don't need to go all-in on AI-assisted forecasting, but even basic anomaly detection on your top five KPIs saves hours of manual pipeline review each week.
Review your KPI set quarterly. Klipfolio recommends a formal quarterly audit of which metrics still align with your go-to-market motion - what mattered in Q1 won't necessarily matter in Q3 if your ICP or pricing model shifted.
Five KPI Mistakes That Kill Your Program
1. Copying KPIs from other companies. A PLG company's KPIs don't translate to an enterprise sales motion. Your KPIs need to reflect your sales cycle, your average deal size, and your team structure. Start from your revenue model and work backward.
2. Tracking too many metrics. If your dashboard has 40+ metrics, nobody's looking at any of them. Pure dashboard theater. Five to twelve KPIs is the sweet spot - work backward from revenue to the front end of the sales process and cut everything that doesn't connect to that chain.
3. Not distinguishing leading from lagging. If you're only reviewing revenue and closed-won deals, you're driving by looking in the rearview mirror. Layer in daily leading indicators so you can course-correct in real time.
4. No ownership, no action. Every KPI needs an owner and a defined response. If pipeline coverage drops below 3x, who does what? If lead response time spikes above 15 minutes, who gets the alert? Skip this step and you're just collecting data, not managing a business.
5. Ignoring data quality. Look, this is the silent killer. Bad contact data corrupts every downstream KPI. Bounced emails inflate your CAC. Stale contacts deflate conversion rates. Outdated pipeline records destroy forecast accuracy. If your CRM data is dirty, none of the other eleven KPIs mean anything. Tools like Prospeo that verify emails at 98% accuracy and refresh records on a 7-day cycle - compared to the 6-week industry average - exist specifically to solve this problem before it compounds.
Pipeline velocity depends on four inputs - and bad data silently kills three of them. Prospeo's 98% email accuracy and 7-day data refresh cycle mean your reps reach real buyers, not bounced inboxes. Teams using Prospeo book 35% more meetings than Apollo users.
Fix the data layer and watch every KPI on this list improve.
FAQ
What's the difference between sales KPIs and sales metrics?
KPIs are the subset of metrics tied directly to strategic goals - the numbers you hold people accountable to. Metrics are any measurable data point in your sales process. Every KPI is a metric, but not every metric deserves KPI status. Promoting too many metrics to KPIs dilutes focus and slows decision-making.
How many sales operations KPIs should a team track?
Five to twelve maximum. Start with pipeline velocity, win rate, cycle length, coverage ratio, and forecast accuracy - then add more only as your data maturity and team size justify it. More KPIs doesn't mean more insight; it usually means more noise.
How often should you review sales ops metrics?
Match cadence to intervention speed. Activity KPIs like conversations and response time get reviewed daily. Performance KPIs like win rate and pipeline velocity get reviewed weekly. Strategic KPIs like CAC and efficiency ratio are monthly or quarterly. Reviewing strategic metrics daily creates noise; reviewing activity metrics quarterly is too late.
What's a good win rate for B2B sales?
20-30% is average for most B2B sales teams; best-in-class teams hit 35-40%. Context matters more than the number itself - a high win rate with a thin pipeline is worse than a moderate win rate with 4x coverage. Always evaluate win rate alongside pipeline volume and deal size.
How does bad data affect sales operations KPIs?
Bounced emails inflate customer acquisition cost. Stale contacts deflate conversion rates. Outdated pipeline records destroy forecast accuracy. The consensus on r/sales is that data decay is the number one reason dashboards lie to you - and most teams don't catch it until a quarter blows up. A 7-day data refresh cycle, like what Prospeo runs, catches decay before it corrupts your metrics or costs you deals.