Sales Pipeline Velocity Calculator: Formula, Benchmarks & Levers
Your pipeline velocity number tells you exactly how much revenue your sales machine generates per day. Not per quarter, not "eventually" - per day. This calculator lets you plug in your numbers, compare against current benchmarks, and figure out which lever moves the needle fastest.
Interactive Calculator
Enter your four inputs to calculate daily pipeline velocity:
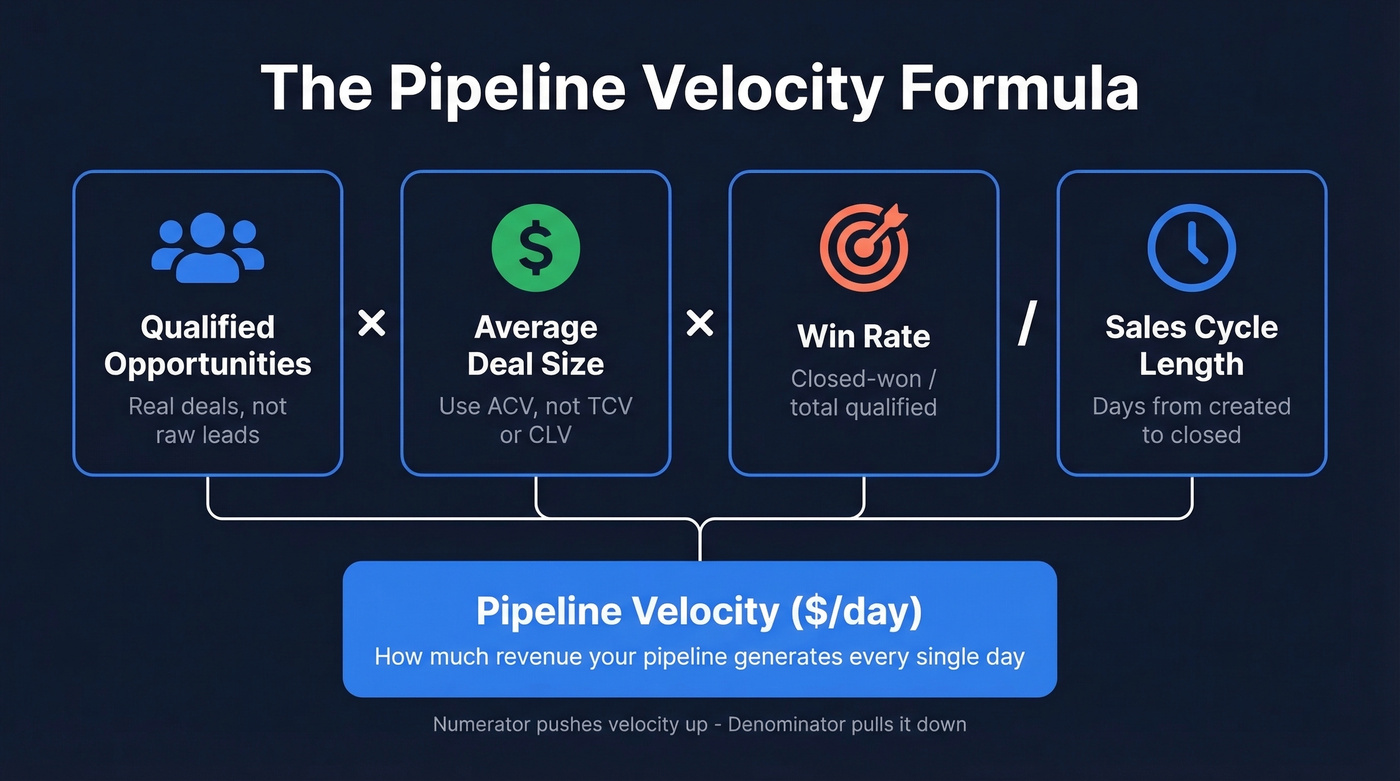
Qualified Opportunities x Average Deal Size ($) x Win Rate / Sales Cycle Length (days) = Pipeline Velocity ($/day)
Use qualified opportunities only - not every lead in your CRM. Enter win rate as a decimal (e.g., 22% = 0.22). Sales cycle is calendar days from opportunity creation to close.
The Pipeline Velocity Formula Explained
Pipeline velocity measures how much revenue flows through your pipeline per day:
(Opportunities x Deal Size x Win Rate) / Sales Cycle Length = Daily Velocity
"Sales velocity" and "pipeline velocity" are interchangeable terms in B2B - don't confuse either with inventory velocity, which is a supply-chain metric. Here's what each input actually means: opportunities are qualified deals, not raw leads. Deal size is your average contract value. Win rate is the percentage of qualified opportunities that close. Sales cycle length is the average number of days from opportunity creation to closed-won.
The numerator pushes velocity up. The denominator pulls it down. That's the whole game.
One thing to keep straight: pipeline velocity tells you speed, while pipeline coverage (typically 3-4x quota) tells you volume. You need both.
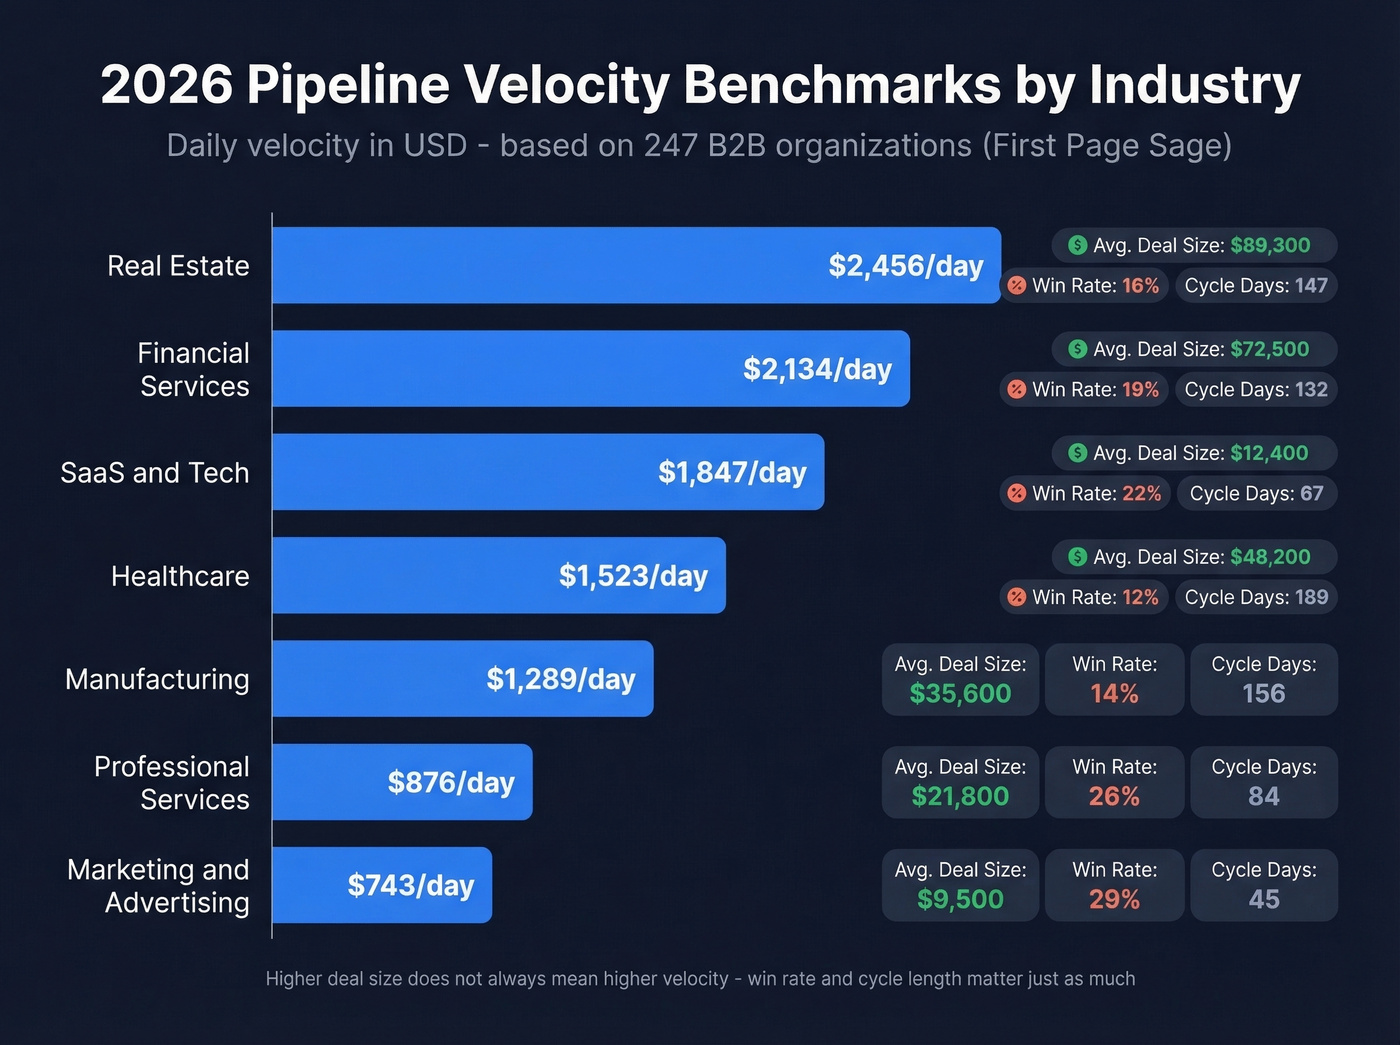
2026 Pipeline Velocity Benchmarks
A First Page Sage study analyzed 247 B2B organizations across North America. Here's what they found, broken out by industry and company size.
By Industry
| Industry | Avg Deal Size | Win Rate | Cycle (Days) | Velocity/Day |
|---|---|---|---|---|
| SaaS & Tech | $12,400 | 22% | 67 | $1,847 |
| Financial Svcs. | $31,200 | 18% | 89 | $2,134 |
| Healthcare | $18,700 | 25% | 72 | $1,523 |
| Manufacturing | $47,800 | 19% | 124 | $1,289 |
| Prof. Svcs. | $8,900 | 28% | 51 | $876 |
| Real Estate | $89,300 | 16% | 147 | $2,456 |
| Marketing & Ad | $15,200 | 24% | 58 | $743 |
By Company Size
| Revenue Tier | Opps | Deal Size | Win Rate | Cycle | Velocity/Day |
|---|---|---|---|---|---|
| $1M-$5M | 18 | $6,200 | 26% | 43 days | $687 |
| $5M-$25M | 27 | $12,800 | 23% | 61 days | $1,303 |
| $25M-$100M | 57 | $22,700 | 21% | 78 days | $3,484 |
| $100M-$500M | 98 | $35,300 | 19% | 95 days | $6,919 |
| $500M+ | 156 | $57,600 | 17% | 118 days | $12,945 |
As another benchmark set, Salesmotion's monthly ranges for SaaS teams are: SMB $45K-$120K/month, mid-market $80K-$300K/month, and enterprise $200K-$800K/month.
Two stats worth highlighting. Teams with 30-45 day sales cycles see a 38% velocity improvement compared to the 76-90 day baseline. And companies that track velocity weekly report 34% revenue growth and 87% forecast accuracy - versus 11% growth and 52% accuracy for teams that check ad-hoc. The takeaway: cycle length is the highest-leverage variable, and measuring more often correlates with better outcomes.
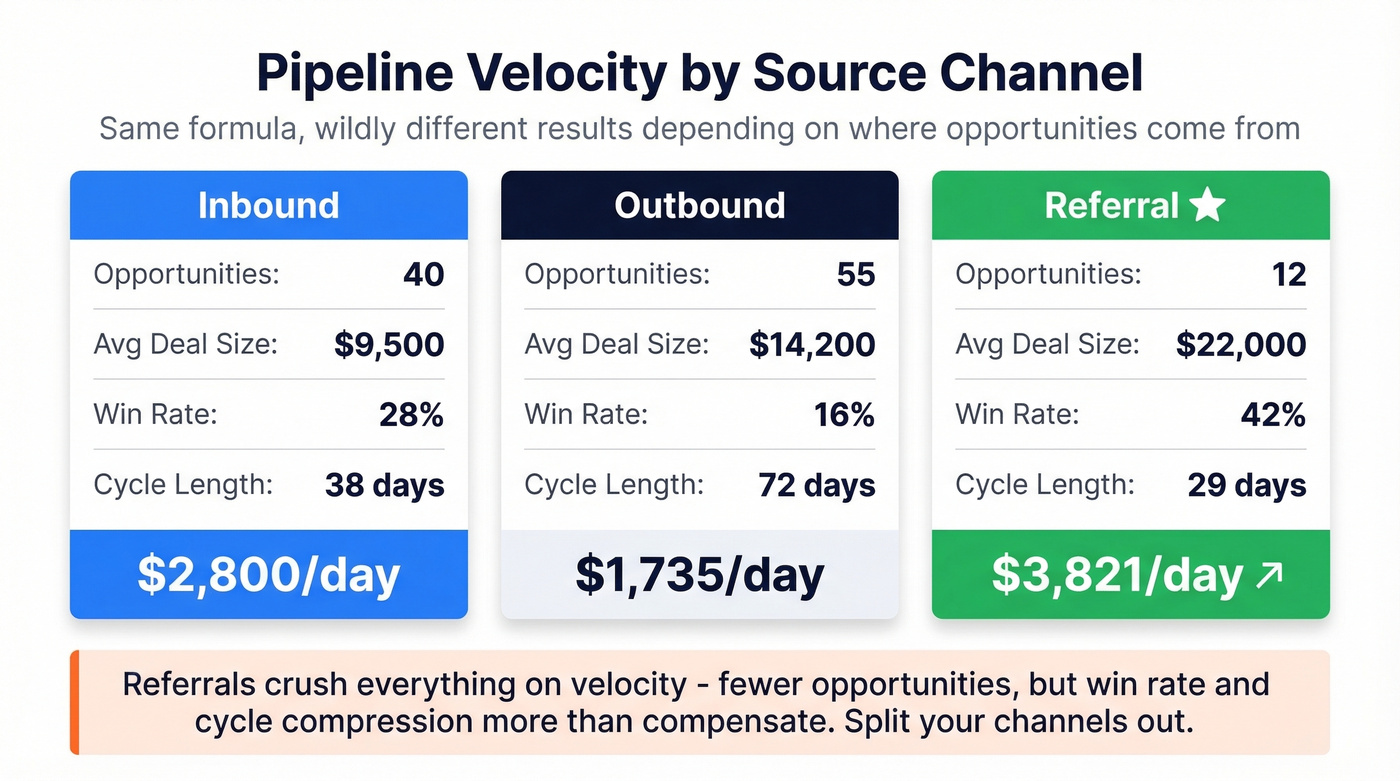
Velocity by Source Channel
The same formula produces wildly different results depending on where your opportunities originate. We've seen this pattern play out consistently across the teams we work with:
| Source | Opps | Avg Deal | Win Rate | Cycle | Velocity/Day |
|---|---|---|---|---|---|
| Inbound | 40 | $9,500 | 28% | 38 days | $2,800 |
| Outbound | 55 | $14,200 | 16% | 72 days | $1,735 |
| Referral | 12 | $22,000 | 42% | 29 days | $3,821 |
Referrals crush everything on velocity - fewer opportunities, but the win rate and cycle compression more than compensate. If you're only tracking blended velocity, you're hiding your best and worst channels behind a single number. Split them out.
Bad contact data is the silent velocity killer. Every bounced email and disconnected phone drags down your win rate and stretches your sales cycle - the two levers that matter most. Prospeo's 98% email accuracy and 7-day data refresh cycle means reps spend time selling, not chasing ghosts.
Stop losing pipeline velocity to data that should have been verified yesterday.
Worked Example: Mid-Market SaaS
Let's say you're a mid-market SaaS company with 27 qualified opportunities, an average deal size of $12,800, a 23% win rate, and a 61-day average sales cycle.
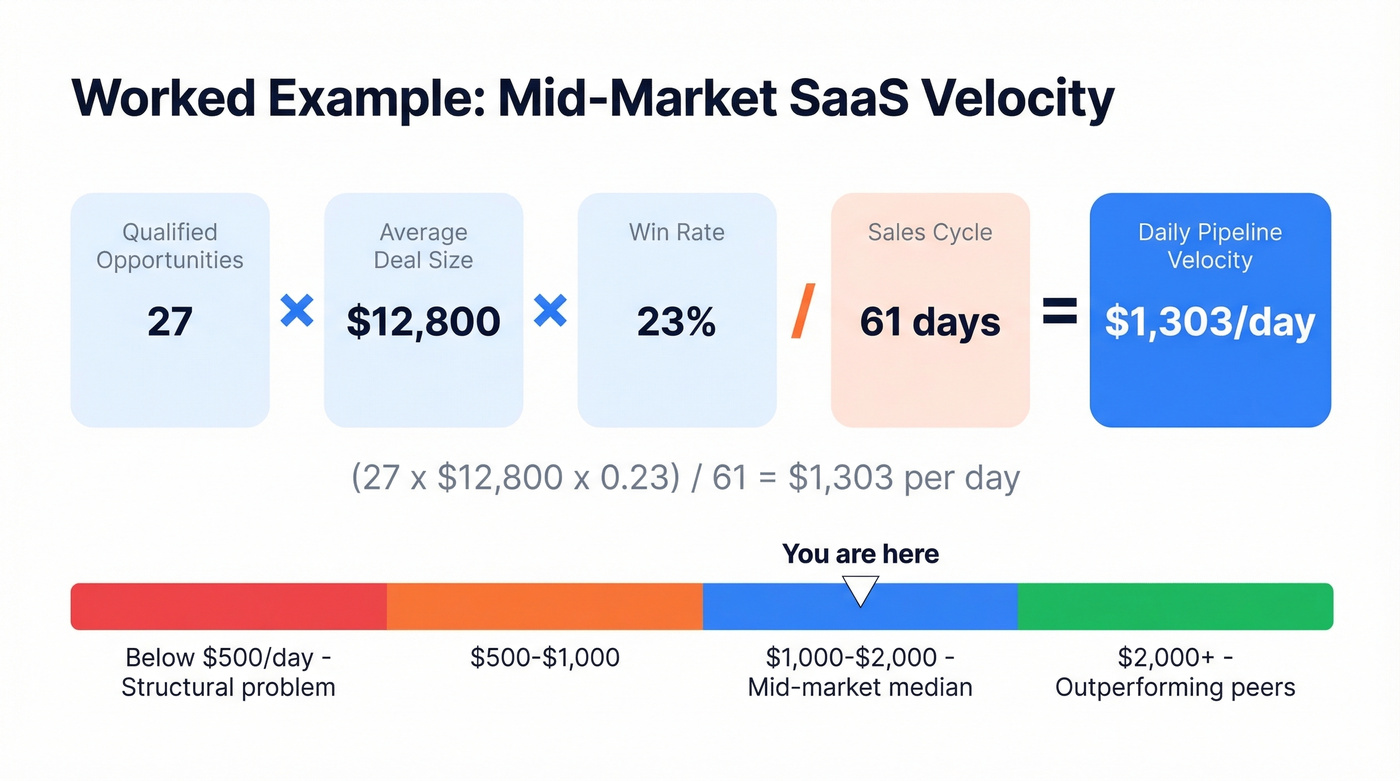
(27 x $12,800 x 0.23) / 61 = $1,303/day
Check that against the benchmark table: $1,303/day lands right at the median for $5M-$25M companies. Above that, you're outperforming peers. Below it, at least one of your four inputs needs work - and the next two sections tell you which one and how to fix it.
Mistakes That Ruin Your Velocity Number
Velocity is a composite metric. If any input is dirty or loosely defined, the output misleads leadership and breaks forecasting.
Vapor pipeline. Deals that should be closed-lost sitting in "qualified" because nobody cleaned them out. Every ghost opportunity makes velocity look better than reality. Run a pipeline hygiene pass weekly - we can't stress this enough.
TCV vs. ACV confusion. If reps enter total contract value while billing is monthly, your average deal size is overstated. Standardize the definition with Finance. ACV is the right input for velocity.
Mixing segments without splitting. A 30-day SMB cycle and a 180-day enterprise cycle averaged together produce a meaningless number. Segment velocity by deal tier, channel, or product line.
Outlier distortion. One whale deal or one 400-day cycle warps everything. Use medians instead of means, and trim the top and bottom 10% before calculating.
Bad contact data. Here's the thing - unverified emails and disconnected phones waste rep time and drag down win rate. I've watched teams burn an entire quarter chasing contacts that bounced on first touch. Verify contacts before they enter the pipeline, not after they've already consumed selling hours.
Four Levers to Improve Velocity
You can only move four numbers. Here's how to attack each one.
1. More Qualified Opportunities
Only about 15% of MQLs convert to SQLs - that's the biggest leak in most funnels. Gate pipeline entry harder. Qualify before importing into the CRM. More opportunities only improve velocity if they're real, which means verifying contact data before reps spend time on dead ends. Prospeo's 5-step verification process and 7-day data refresh cycle catches bad data at the source, so ghost contacts don't inflate your opportunity count.
2. Bigger Average Deal Size
Upsell and cross-sell into existing opportunities. Bundle products. But watch for the ACV consistency trap from the previous section - if half the team enters annual and half enters monthly, your "average" is fiction. (If you need a clean definition, start with cross-sell vs upsell.)
3. Higher Win Rate
Win rates are under pressure. The Ebsta/Pavilion benchmarks show win rates dropping from 29% to 19% year-over-year. How do you fight back? Multi-thread your deals. Forrester research shows that deals with 3+ engaged contacts close 30% faster than single-threaded ones. If you're not actively working to hold the line, you're losing ground.
Skip this lever if your win rate already exceeds 25% and your cycle length is above 90 days - you'll get more bang from compressing the denominator.
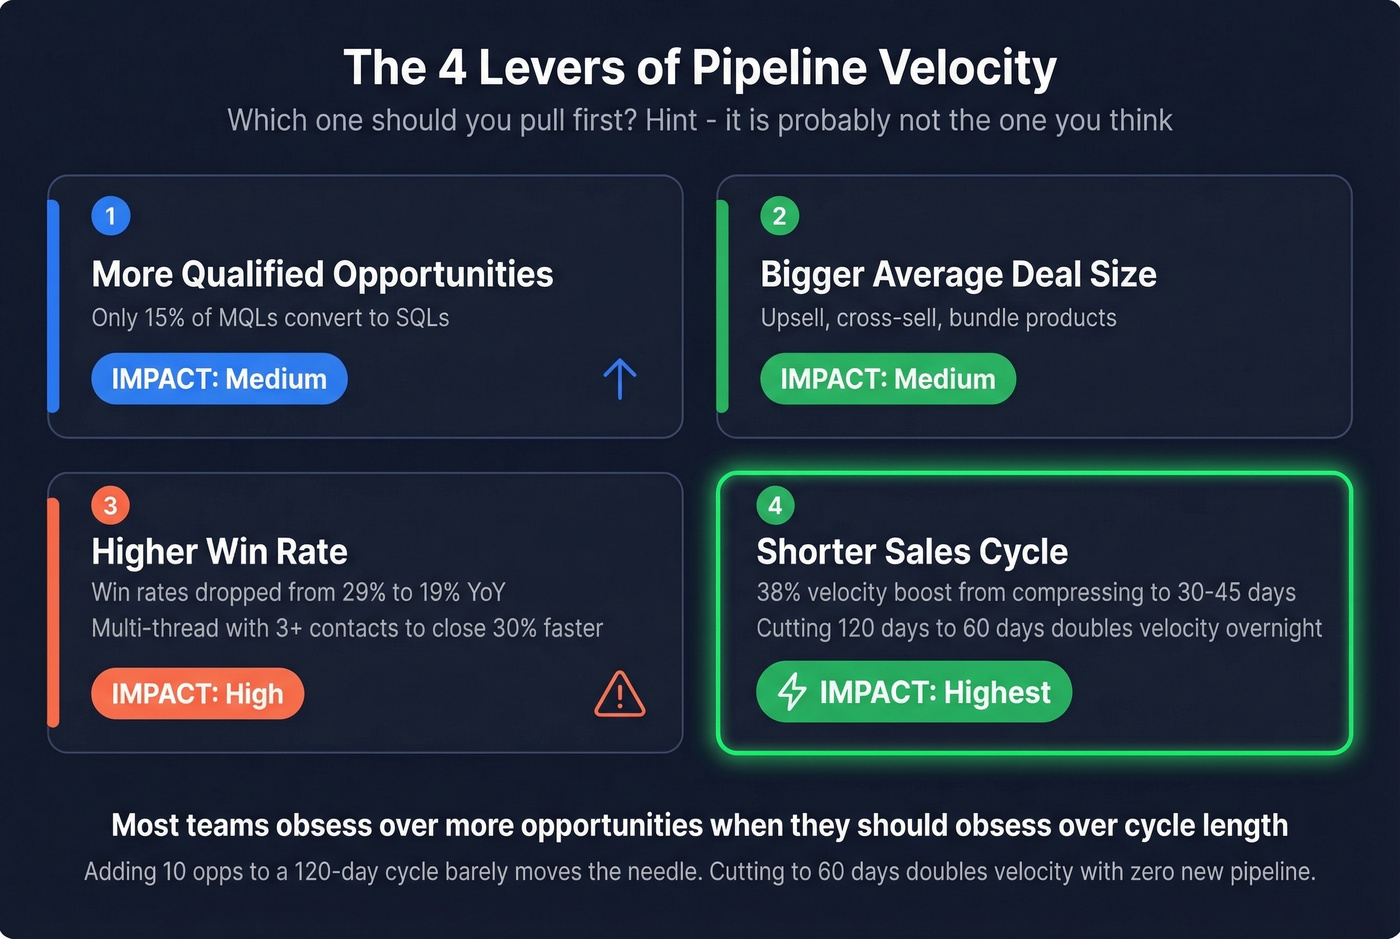
4. Shorter Sales Cycle - the Biggest Lever
Cycle length compression is the fastest velocity win. The First Page Sage data backs this up: a 38% velocity improvement just from compressing cycles into the 30-45 day range. Use mutual action plans. Remove unnecessary approval stages. Pre-negotiate legal terms with templates. Every day you shave off the denominator directly increases daily velocity.
Our strong opinion: Most teams obsess over generating more opportunities when they should be obsessing over cycle length. Adding 10 more opps to a 120-day cycle barely moves the needle. Cutting that cycle to 60 days doubles your velocity overnight - with zero new pipeline. The consensus on r/sales echoes this: reps who focus on deal progression consistently outperform those who focus on top-of-funnel volume.
Track Velocity in Your CRM
You don't need a BI tool for this. Your CRM handles it if it's set up right.
HubSpot: Go to Settings, then Objects, then Deals, then Pipelines. Define roughly 7 stages and assign win probabilities to each. Track Entered Stage Date and Exited Stage Date for time-in-stage calculations. Gate pipeline entry - don't auto-create deals from low-intent form fills. Use lifecycle stage and lead status to qualify first.
Salesforce: Use Opportunity Created Date and Close Date as your cycle endpoints. Enable field history tracking on the Stage field to get stage-level duration data. Build a report that tracks your opportunity count, average deal size, win rate, and average sales cycle length so you can compute velocity consistently by segment. Salesforce's reporting docs walk through the setup.
For both platforms, tie closed-won to a real revenue event - an e-signature or invoice trigger, not a rep clicking a button. This keeps your win rate and cycle length honest, which keeps your velocity number trustworthy. If you want to go deeper on forecasting, pair velocity with sales operations metrics and a dedicated sales forecasting solution.
Multi-threading deals closes them 30% faster - but only if you can actually reach those 3+ contacts. Prospeo gives you verified emails and direct dials for every stakeholder on the buying committee, across 300M+ profiles, at $0.01 per email.
Compress your sales cycle by reaching the right people on the first touch.
FAQ
How often should I calculate pipeline velocity?
Weekly. Teams that track velocity weekly see 34% revenue growth compared to 11% for ad-hoc trackers. Build it into your Monday pipeline review alongside coverage ratios and stage conversion rates. Consistency matters more than precision - trending over time reveals problems faster than any single snapshot.
What's a good pipeline velocity number?
It depends on your segment. Mid-market SaaS averages around $1,303/day; a $500M+ enterprise might run $12,945/day. As a rough floor, most B2B teams should target at least $500/day - anything below that signals a structural problem in at least one input. Match your revenue tier and industry in the benchmark tables above rather than chasing a generic target.
Should I use ACV or CLV in the formula?
Use ACV (annual contract value). CLV overstates near-term revenue potential and inflates your number artificially. If you want a lifetime-value view of pipeline health, calculate it separately and label it clearly so it doesn't get confused with operational velocity in your pipeline reviews.
How does bad data affect pipeline velocity?
Directly. Unverified emails and wrong phone numbers waste rep hours, inflate cycle length, and suppress win rates. A 5-step verification process with catch-all handling and spam-trap removal eliminates stale contacts before they enter your pipeline, keeping every input in the velocity formula clean.