50+ Sales Productivity Statistics Every Sales Leader Needs in 2026
Only 41.2% of software reps hit quota in early 2025, per RepVue data shared on r/sales. Medical device reps? 64.2%. The gap isn't talent - it's structural. Here are the sales productivity statistics that explain why, and what the best teams are doing differently.
The Numbers at a Glance
- Reps spend 25-40% of their week actually selling. The rest is admin, meetings, and tool-switching.
- 69% of reps miss quota, and 17% generate 81% of revenue. That's not a coaching problem - it's a structural one.
- Bad data costs about 550 hours and $32,000 per rep per year. Fix the data before you fix the process.
96% of prospects research before talking to a rep, and 71% prefer doing their own research entirely. The selling window is shrinking, and most teams waste the little time they have.
Where Reps Actually Spend Time
Estimates vary. Salesforce's State of Sales puts selling time at roughly 40%, while Bain's data suggests it's closer to 25%. Either way, reps spend the majority of their week not selling.
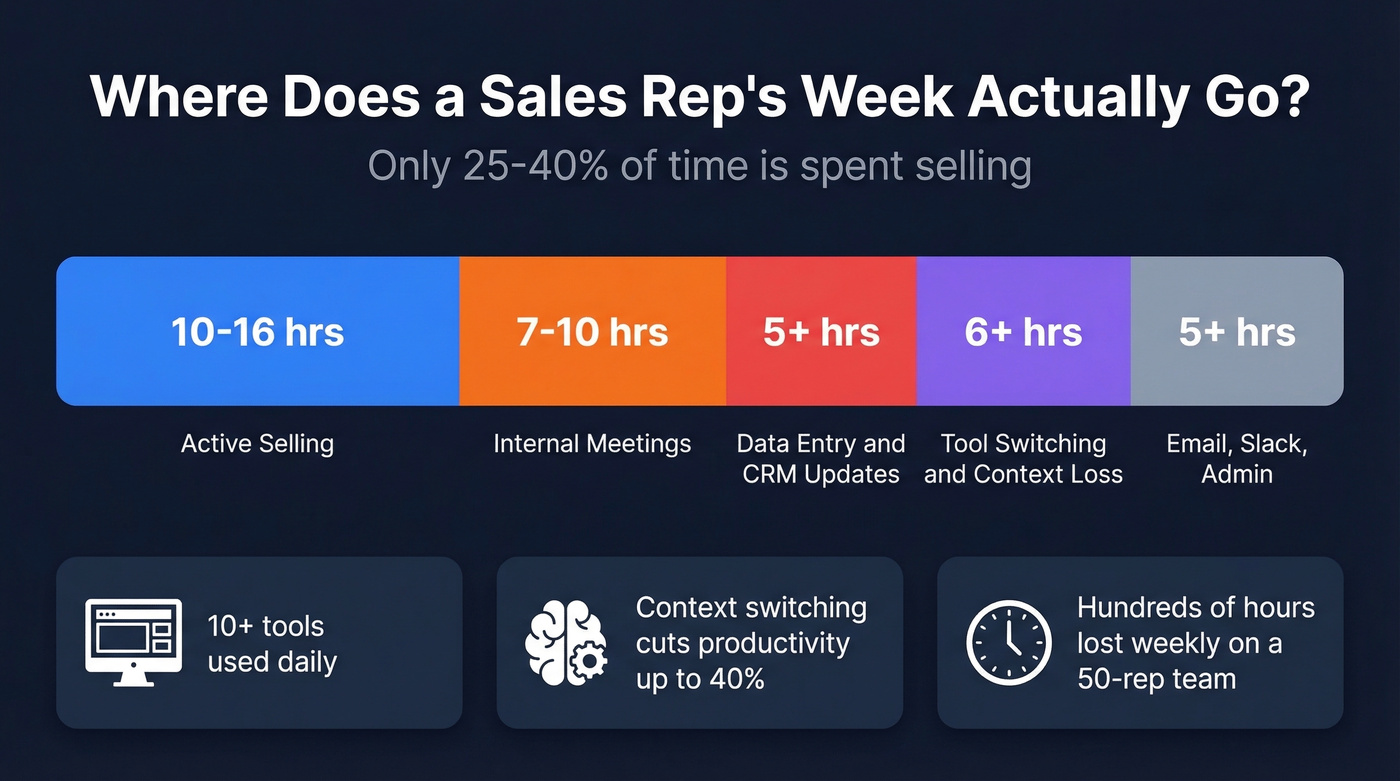
Here's where the rest goes:
- 7-10 hours/week in internal meetings: pipeline reviews, forecasts, team syncs
- 5+ hours/week on data entry, CRM updates, and reporting
- 10+ digital tools used daily, with context switching cutting productivity by up to 40%
That last point doesn't get enough attention. Every time a rep alt-tabs from CRM to sequencer to dialer to Slack, they lose focus - and the cognitive cost compounds across a full day. We've seen teams with 50+ reps lose hundreds of hours weekly to nothing more than tab-switching. It's death by a thousand clicks.
The Quota Crisis
RepVue's Q1 2024 Cloud Sales Index shows 43.5% of reps hitting quota. Ebsta's 2024 B2B Sales Benchmarks paint it darker - 69% of reps fell short.
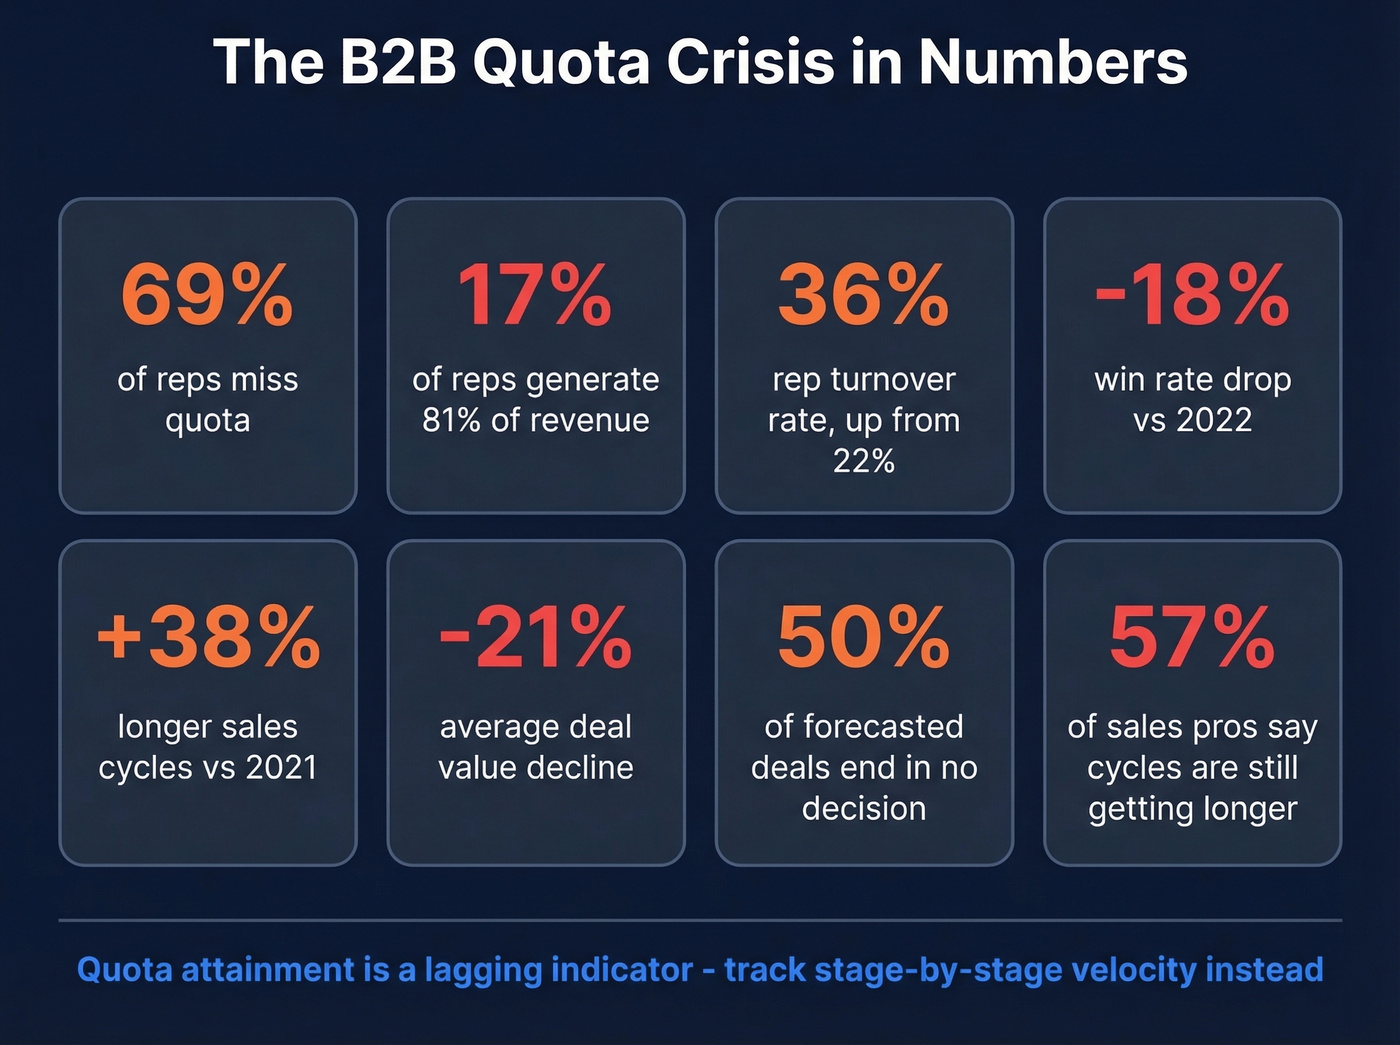
The concentration problem should alarm every leader: 17% of reps generate 81% of revenue. That's not a bell curve. It's a cliff. And rep turnover climbed from 22% to 36%.
Win rates dropped 18% versus 2022 and 27% versus 2021. Sales cycles grew 16% in H1 2023 and 38% compared to 2021. Average deal values fell 21%. Up to 50% of forecasted deals end in no decision, per Gartner's 2023 analysis. Meanwhile, 57% of sales professionals say the cycle is still getting longer. These benchmarks set the baseline that 2025 and 2026 teams are still trying to recover from.
Here's the thing: quota attainment is a lagging indicator. By the time you see it dropping, the rot has been spreading for quarters. Practitioners on r/b2b_sales are right to push for leading metrics instead - revenue per rep hour, deal velocity per stage, and contribution margin all surface problems weeks before they show up in quota reports. If you don't have a stage-by-stage velocity dashboard yet, build one this quarter.
The Bad Data Tax
Your SDR team sent 10,000 emails last month. 3,500 bounced. That's not a volume problem - it's a data problem.
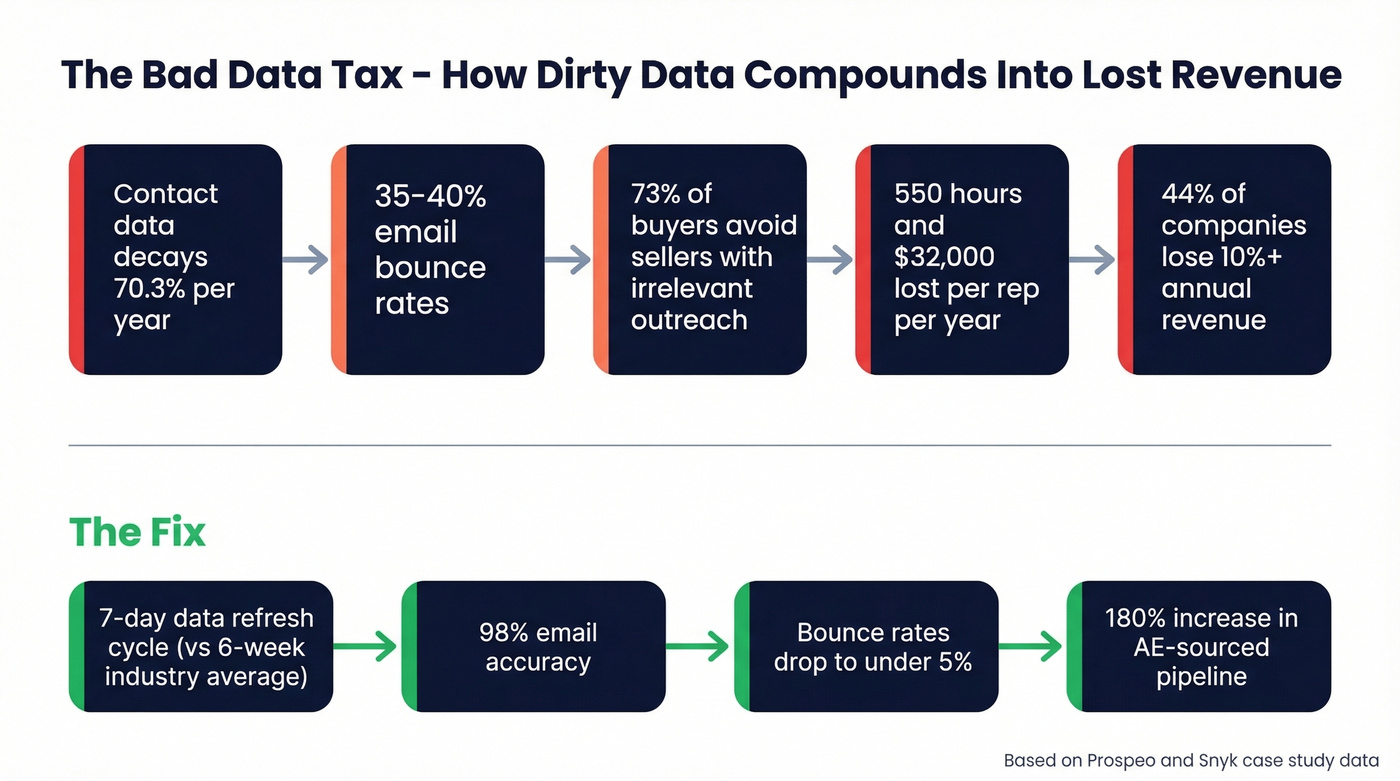
And 73% of B2B buyers actively avoid sellers who send irrelevant outreach, so bad data doesn't just waste time. It poisons your brand. Sales teams lose about 550 hours and $32,000 per rep annually to bad data. Contact data decays at 70.3% per year. And 44% of companies lose more than 10% of annual revenue to inaccurate CRM data.
This is also why AI initiatives stall. 74% of AI-enabled sales teams are prioritizing data hygiene, and 51% say data security concerns halt AI projects entirely. You can't feed garbage into a model and expect gold out the other side.
Prospeo's 7-day data refresh cycle - versus the 6-week industry average - addresses this head-on. Snyk's 50-person AE team saw bounce rates drop from 35-40% to under 5% after switching, with AE-sourced pipeline up 180%.
Bad data costs reps 550 hours and $32K per year. Prospeo's 7-day data refresh cycle - 6x faster than the industry average - keeps your CRM clean and your reps selling. Snyk's 50-person AE team cut bounce rates from 35% to under 5% and grew AE-sourced pipeline 180%.
Stop paying the bad data tax. Start at $0.01 per verified email.
AI's Real Impact on Seller Productivity
A peer-reviewed study in the Journal of Business & Industrial Marketing (2025) confirmed GenAI streamlines admin and improves sales conversations - but found managerial encouragement was the key adoption driver, not individual tech comfort. That's the most credible finding in the AI-sales space right now, and most teams are ignoring it.
The headline stats are impressive: 94% of sales leaders with AI agents call them essential, and high performers are 1.7x more likely than underperformers to use prospecting agents. Salesforce's own SDR agent generated 3,200 opportunities in four months. Bain reports 30%+ win rate improvement from AI - but only when companies redesign end-to-end sales processes. Without that redesign, gains are marginal at best.
Let's be honest about the downside, too. 19% of buyers using AI applications feel less confident in purchasing decisions due to inaccurate GenAI output, and Forrester predicts B2B companies will lose more than $10 billion in enterprise value from ungoverned GenAI use. AI without process change is a rounding error. AI without data governance is a liability.
What Top Performers Do Differently
McKinsey analyzed nearly 500 B2B companies and found top-quartile orgs generate 2.5x higher gross margin per dollar invested in sales versus the bottom quartile. The gap isn't more tools or more reps - it's better profitability metrics and ruthless focus on high-value accounts.
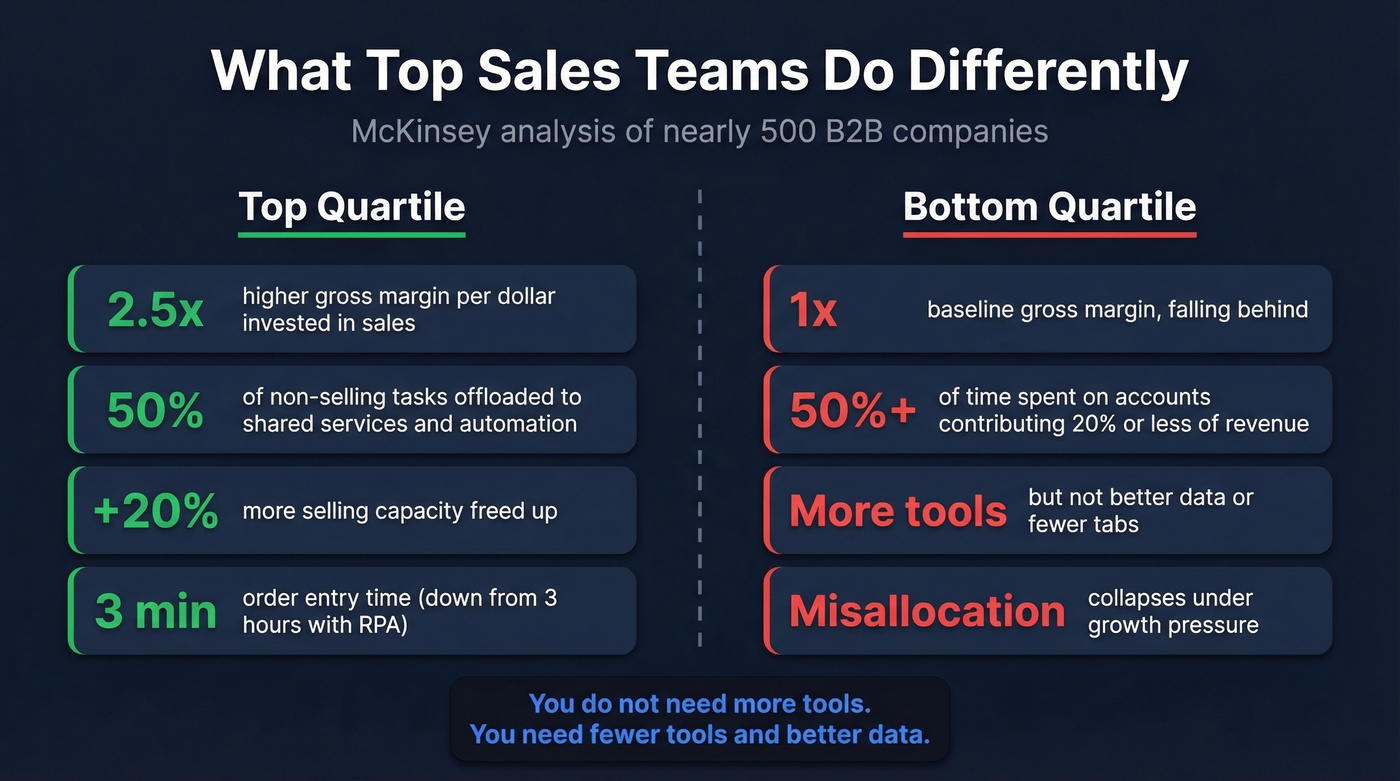
Top performers offload up to 50% of non-selling tasks to shared services and automation, opening roughly 20% more capacity. One RPA example: order entry went from 3 hours to 3 minutes. Underperformers, meanwhile, spend more than 50% of their time on accounts contributing 20% or less of revenue - a classic misallocation that collapses under growth pressure.
You don't need more tools. You need fewer tools and better data. In our experience, any startup promising a magic dashboard should be evaluated on one question: does it actually reduce time-to-close, or does it just add another tab to your browser?
Funnel Conversion Benchmarks
These conversion rates come from Digital Bloom's 2025 synthesis of 40+ benchmark studies.
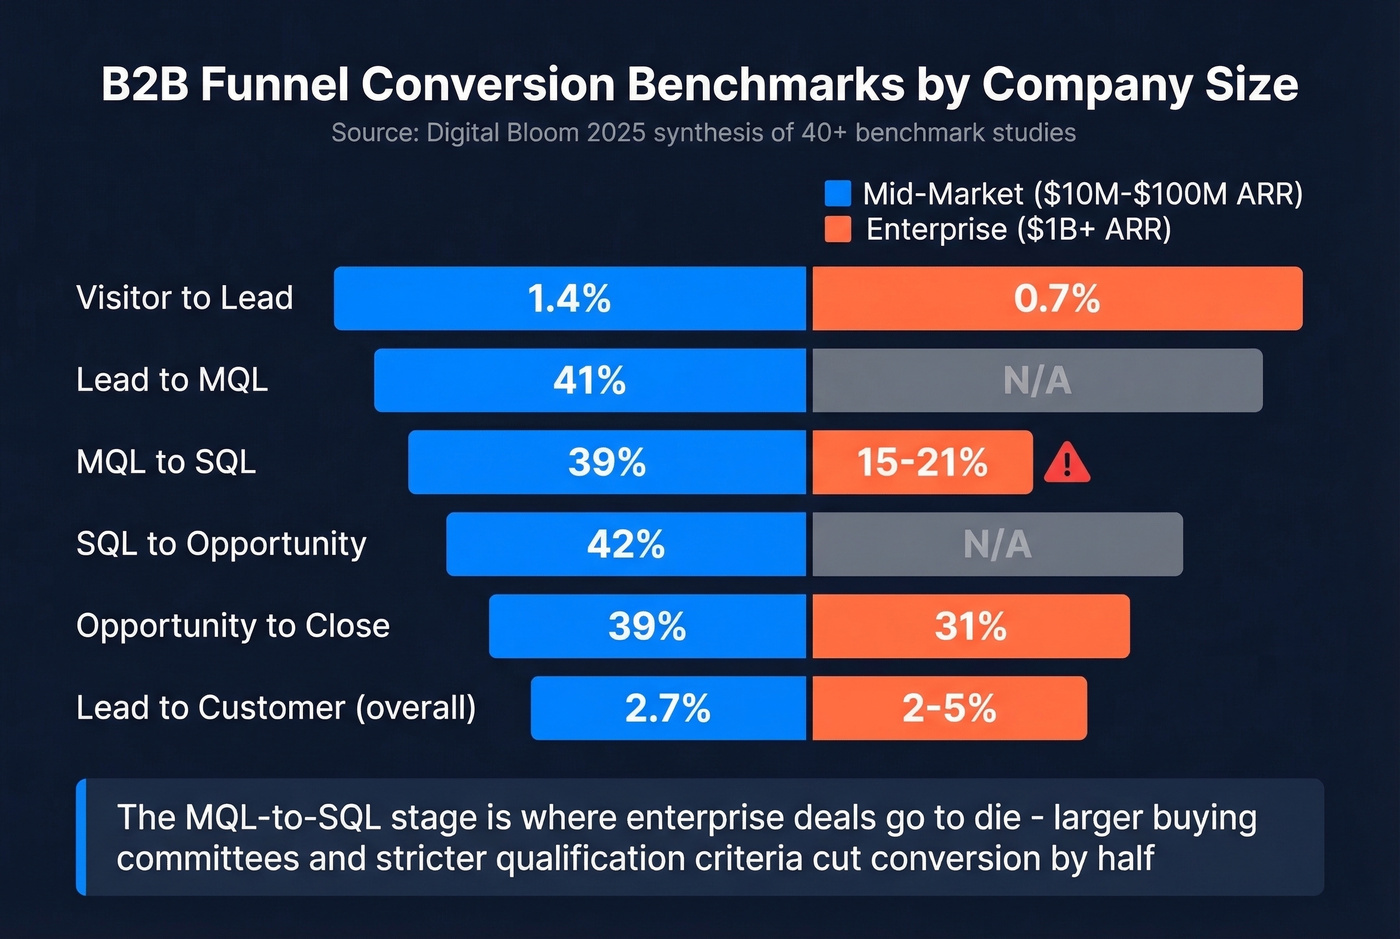
| Stage | $10M-$100M ARR | $1B+ ARR |
|---|---|---|
| Visitor to Lead | 1.4% | 0.7% |
| Lead to MQL | 41% | - |
| MQL to SQL | 39% | 15-21% |
| SQL to Opp | 42% | - |
| Opp to Close | 39% | 31% |
| Lead to Customer | ~2.7% | ~2-5% |
Enterprise companies convert visitors at half the rate of mid-market, but the real story is MQL-to-SQL - where enterprise teams see 15-21% conversion versus 39% at mid-market. Larger buying committees, stricter qualification criteria, and more stakeholders who must sign off before an MQL becomes sales-qualified all contribute. That stage is where deals go to die, and if your team isn't measuring stage-specific velocity there, you're flying blind.
What Sales Leaders Actually Measure
HubSpot surveyed 1,000 sales professionals for their 2025 State of Sales report. ARR leads at 42%, followed by profit margin (30%), conversion rate (29%), win rate (28%), ARPU (27%), and quota attainment (26%). Sales cycle length trails at 22%.
Less than 5% prioritize pipeline coverage or lead scoring - a blind spot given that SaaStr benchmarks recommend 3x-4x pipeline coverage as a baseline. The top deal-killers reported were no product fit (37%) and poor value for money (35%), which suggests many teams are chasing the wrong accounts with the wrong message. Skip the vanity metrics and start tracking what actually predicts closed revenue.
Using Slow Periods Productively
Every team hits seasonal dips. Summer slowdown is real, and productivity drops measurably across most B2B verticals.
The best teams treat these windows as investment time rather than idle time. Clean your CRM data, refine ICP definitions, build prospecting lists for Q4, and run A/B tests on outreach sequences. We've found that pipeline built during Q3 slowdowns consistently converts at higher rates in Q4 - partly because the data is fresher and the targeting is sharper after a proper audit.
The throughline across every stat in this article is the same: most sales productivity problems are data and process problems disguised as people problems. Fix the inputs, and the outputs follow. For deeper dives, the McKinsey, Bain, and Ebsta reports cited throughout are the most data-rich starting points.
If you want a tighter operating system around these benchmarks, start with a sales playbook and a simple sales scorecard that forces weekly visibility.
If reps only sell 25-40% of their week, every minute on a wrong number or bounced email is a compounding loss. Prospeo delivers 98% email accuracy and 125M+ verified mobiles with a 30% pickup rate - so the time your reps do spend selling actually connects.
Give your team contacts that convert, not contacts that bounce.
FAQ
What percentage of time do reps spend selling?
Between 25% and 40%, depending on the source. Salesforce estimates 40%; Bain puts it closer to 25%. The rest goes to admin, internal meetings, CRM updates, and tool-switching. Top teams reclaim 20%+ of this time through automation and shared services.
How does bad data affect sales productivity?
Teams lose about 550 hours and $32,000 per rep annually, with 70.3% of contact data decaying each year. A 7-day refresh cycle and rigorous email verification can cut bounce rates from 35-40% to under 5% - keeping CRM data current is the single highest-ROI fix most teams can make.
How much does AI improve sales results?
Bain reports 30%+ win rate improvement - but only when companies redesign end-to-end processes alongside AI adoption. Without process change, gains are marginal. Managerial encouragement, not individual tech comfort, is the key driver of successful adoption.
What should sales teams do during a summer slowdown?
Clean your CRM, audit your ICP, build prospecting lists for the next quarter, and A/B test outreach messaging. Teams that invest during seasonal dips consistently outperform those that coast - pipeline built in Q3 tends to convert at higher rates in Q4.