The 12 Sales Productivity Metrics That Actually Predict Revenue in 2026
It's the end-of-quarter QBR. Your reps logged 4,200 calls, sent 11,000 emails, and booked 340 meetings. Activity metrics look healthy. Then someone pulls up pipeline velocity - it's dropped 22% since last quarter. The room goes quiet because everyone just realized the team was busy, not productive, and the dashboard didn't catch it.
The VP of Sales asks the obvious question: "If we were this active, why did revenue miss?"
Nobody has a good answer. That's the measurement trap. 17% of reps generate 81% of revenue. The other 83% aren't lazy - they're optimizing for the wrong numbers.
What You Need (Quick Version)
If you only track three sales productivity metrics this week, make them these:
- Pipeline velocity - the single best predictor of revenue trajectory
- Selling time % - how much of your reps' day is actually revenue-generating
- Meeting-to-opportunity rate - the quality filter between activity and pipeline
Want a single unified score? Skip to the Productivity Index section below. And if your reps are chasing bounced emails and dead phone numbers, fix your contact data before you fix your metrics. Bad inputs poison every KPI downstream.
The Measurement Crisis
Let's be honest about where sales teams actually stand. Only 43.5% of sales professionals hit quota per RepVue's most recent Cloud Sales Index. Ebsta and Pavilion's research paints an even bleaker picture: 69% of reps fell short, and only 15% of sales teams had more than half their reps reaching 80%+ of target.
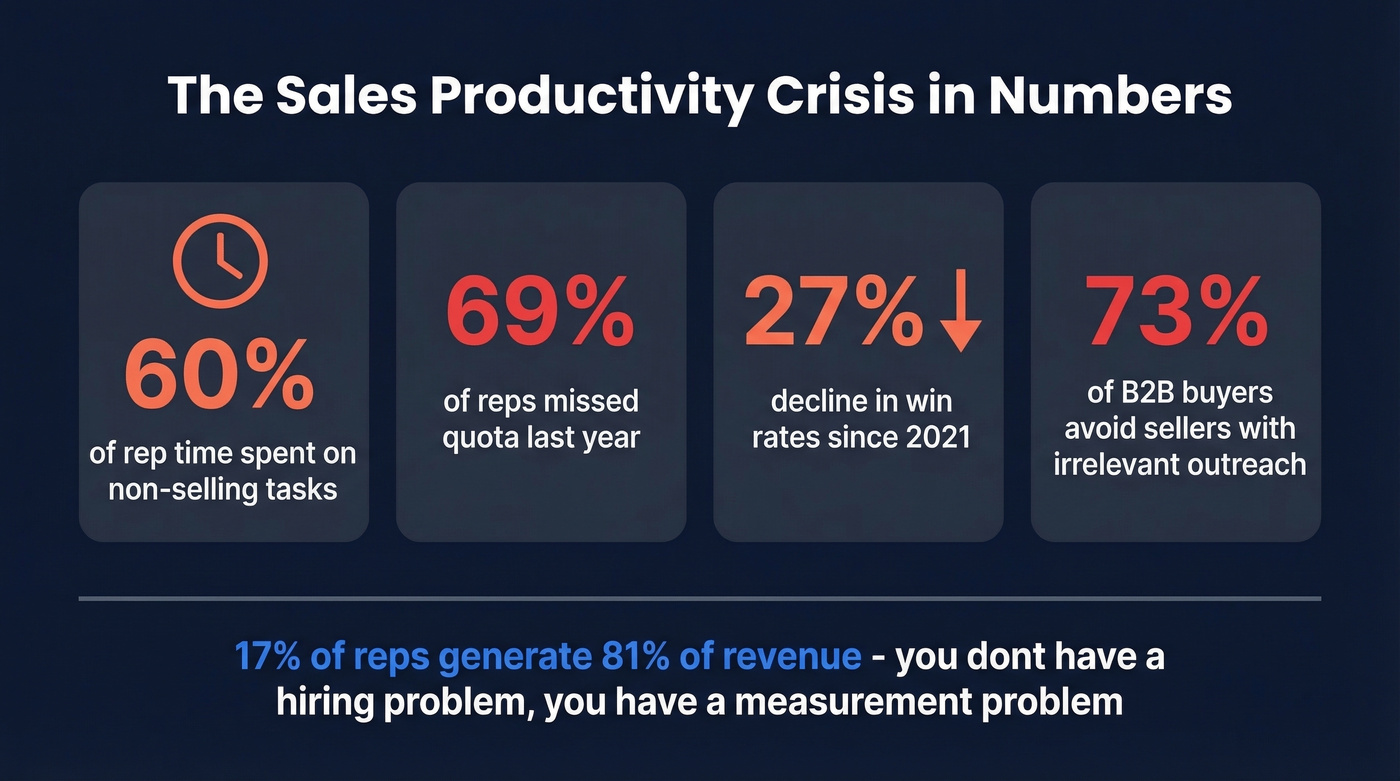
The time problem is brutal. Reps spend 60% of their time on non-selling tasks - admin, CRM updates, internal approvals, searching for contact information. Meanwhile, 57% of sales professionals say the sales cycle is getting longer. You've got reps spending more time on less productive work while deals take longer to close. And on the buyer side, 73% of B2B buyers actively avoid sellers who send irrelevant outreach - so the penalty for wasted effort isn't just lost time, it's lost trust.
Then there's the "hero rep" problem. When 17% of your team generates 81% of revenue, you don't have a hiring problem - you have a measurement problem. Those top performers aren't just working harder. They're working on the right deals, with the right contacts, at the right time. Understanding how to measure productivity across your entire team - not just the stars - is what separates data-driven selling orgs from everyone else.
Since 2021, win rates have declined 27% and sales cycles have grown 38% before stabilizing. The macro environment isn't getting easier. The KPIs you choose to track aren't academic - they're the difference between diagnosing problems early and discovering them at the QBR when it's too late.
The 12 Metrics That Predict Revenue
These twelve metrics fall into three groups: whether your pipeline is healthy, whether your conversions are quality, and whether your team is efficient. Pipeline health comes first because without it, nothing else works.
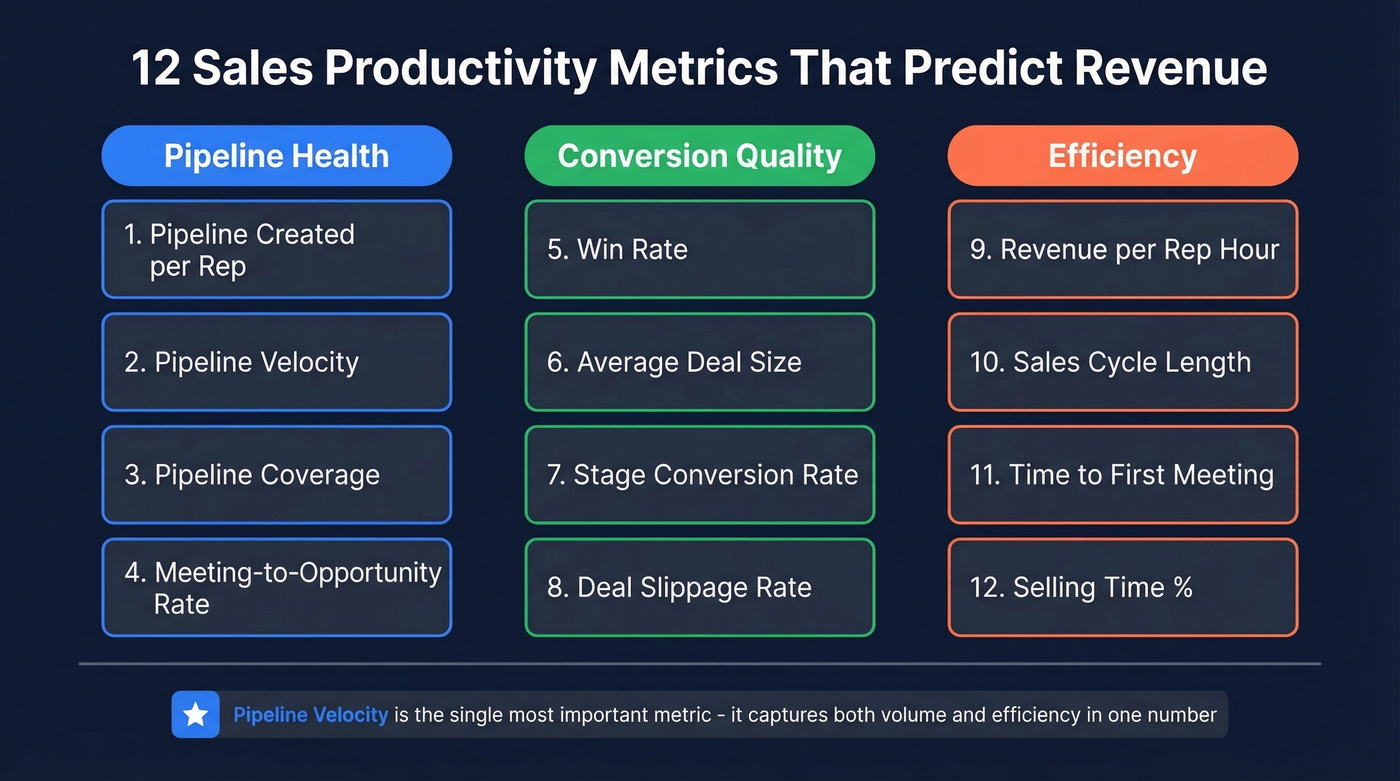
Pipeline Health
Pipeline created per rep is your leading indicator. Formula: total new pipeline dollars / number of reps / time period. A healthy B2B SaaS team should create 3-5x their quota in new pipeline each quarter. If this number drops, you'll feel it in revenue two quarters later.
Pipeline velocity is the single most important metric in this entire article. The formula: (Number of Opportunities x Average Deal Size x Win Rate) / Sales Cycle Days = dollars per day. It's the only metric that captures both volume and efficiency in one number. An Optifai Sales Ops Benchmark (N=939) found that reducing sales cycle days has a 28% impact on velocity - more than any other lever. We've seen teams obsess over adding more opportunities when the real unlock was shaving five days off their cycle.
Pipeline coverage is the reality check. The 3x minimum rule exists for a reason: if you need $1M in closed revenue, you need $3M in pipeline. But a $5M pipeline full of stalled deals at 10% probability is worth less than a $2M pipeline moving at 40% win rate. Always pair coverage with velocity. (If you want a deeper framework, see pipeline health.)
Meeting-to-opportunity rate tells you whether top-of-funnel activity produces real deals. Good benchmarks run 40-60% for outbound and 60-80% for inbound. Below these ranges, your reps are either meeting with the wrong people or failing to qualify. Either way, it's a coaching signal.
Conversion Quality
Win rate gets the most attention, but it's declining industry-wide - down 18% versus 2022 per Ebsta's data. The number itself matters less than the trend and context. A 25% win rate on enterprise deals with 18-month cycles is excellent. A 25% win rate on SMB deals with 30-day cycles is a problem. Always segment by deal type.
Average deal size is best tracked as a trend, not a snapshot. If deal size is shrinking while activity increases, your reps are discounting to close or gravitating toward easier, smaller deals. Plot it on a rolling 90-day average and watch for drift.
Stage conversion rate is where quality problems hide. Here's the diagnostic insight: if conversion drops while activity increases, you have a quality problem, not a quantity problem. Track conversion between each stage - discovery to proposal, proposal to negotiation, negotiation to close. The stage where conversion craters tells you exactly where coaching is needed. (This is also where funnel metrics can help you standardize definitions.)
Deal slippage rate is the metric nobody tracks but should. What percentage of deals forecast to close this quarter actually pushed to next quarter? If slippage exceeds 20%, your forecasting process is broken and your pipeline velocity calculation is based on fiction. I've watched teams where 30-40% of "this quarter" deals slip every single quarter, and nobody flags it because it's not on the dashboard.
Efficiency
Revenue per rep hour is the metric practitioners actually want, based on r/Sales_Professionals discussions. Formula: closed revenue / total selling hours. For a mid-market SaaS team, a healthy range is $150-300 per rep hour.
Sales cycle length is the fastest lever for improving pipeline velocity. That 28% impact figure means shaving even a few days off your average cycle has an outsized effect on revenue throughput. Track it by segment and by rep - the variance between your fastest and slowest closers usually reveals process gaps, not talent gaps. (For a broader view, align this with sales process optimization.)
Time to first meeting measures how quickly your team converts a lead into a conversation. Targets: under 5 days for hot leads, under 10 days for warm. If you're consistently above these thresholds, look at your lead routing, response time, and whether reps have the contact data they need to reach someone on the first attempt.
Pipeline Velocity Benchmarks
The Optifai Sales Ops Benchmark (N=939 companies, 423 B2B SaaS, Q1-Q3 2025 - the most recent large-sample benchmark available) provides the most concrete velocity data we've found:
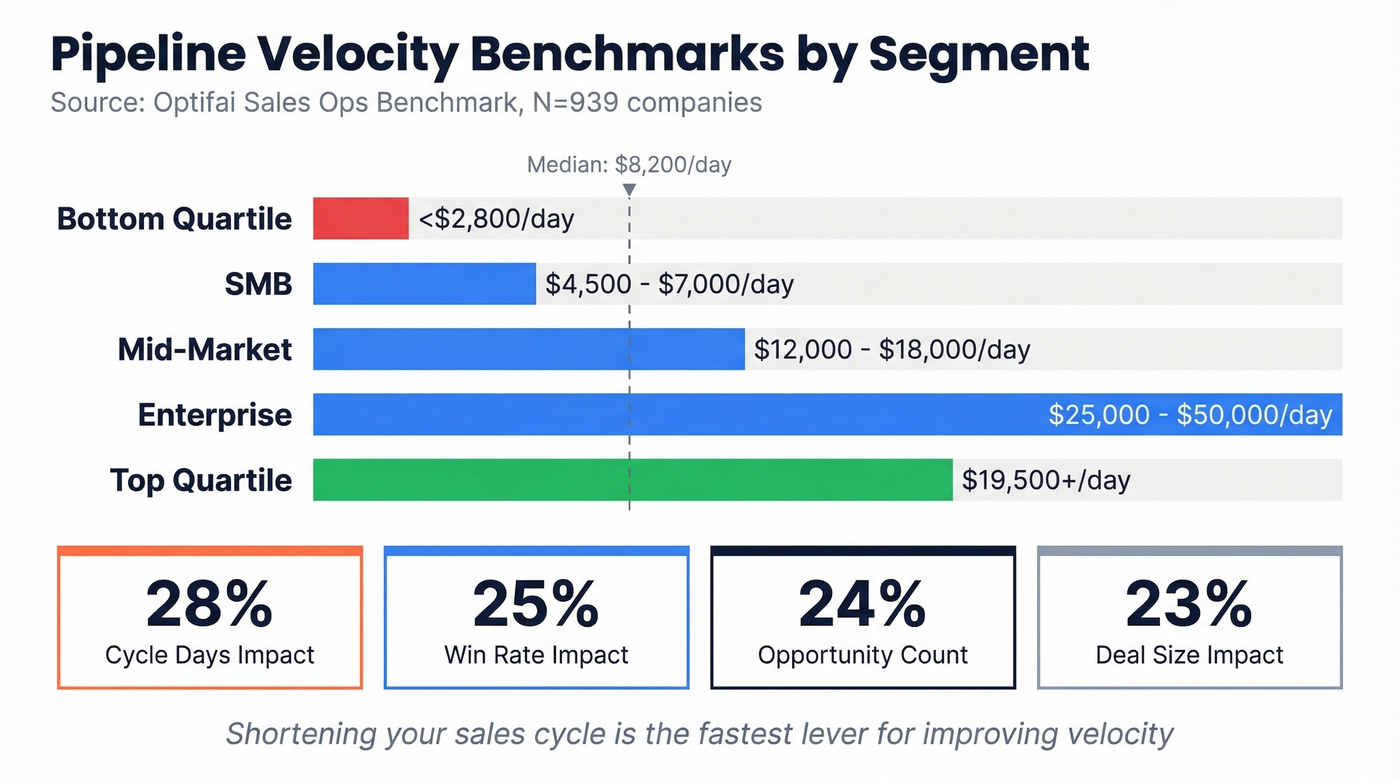
| Segment | Velocity ($/day) | Annual Equivalent |
|---|---|---|
| SMB | $4,500-$7,000 | ~$1.6M-$2.6M |
| Mid-Market | $12,000-$18,000 | ~$4.4M-$6.6M |
| Enterprise | $25,000-$50,000 | ~$9.1M-$18.3M |
| Overall Median | $8,200 | ~$3.0M |
| Top Quartile | $19,500+ | ~$7.1M+ |
| Bottom Quartile | <$2,800 | <$1.0M |
The gap between top and bottom quartile is a 2.5x velocity multiple. That's the difference between a team that's scaling and a team that's treading water.
The "fastest lever" breakdown is worth memorizing: cycle days (28% impact), win rate (25%), opportunity count (24%), deal size (23%). Most teams instinctively try to add more opportunities. The data says shortening your cycle is a better bet.
Bad contact data is the silent killer of every metric on this list. Bounced emails inflate activity numbers, wrong phone numbers tank time-to-first-meeting, and stale records drag pipeline velocity to zero. Prospeo delivers 98% email accuracy with a 7-day refresh cycle - so your reps spend time selling, not searching.
Fix your inputs and every productivity metric improves downstream.
The Sales Productivity Index
If you implement one framework from this article, make it this one. SBI's Productivity Index combines five components into a single weighted score normalized to 0-100:
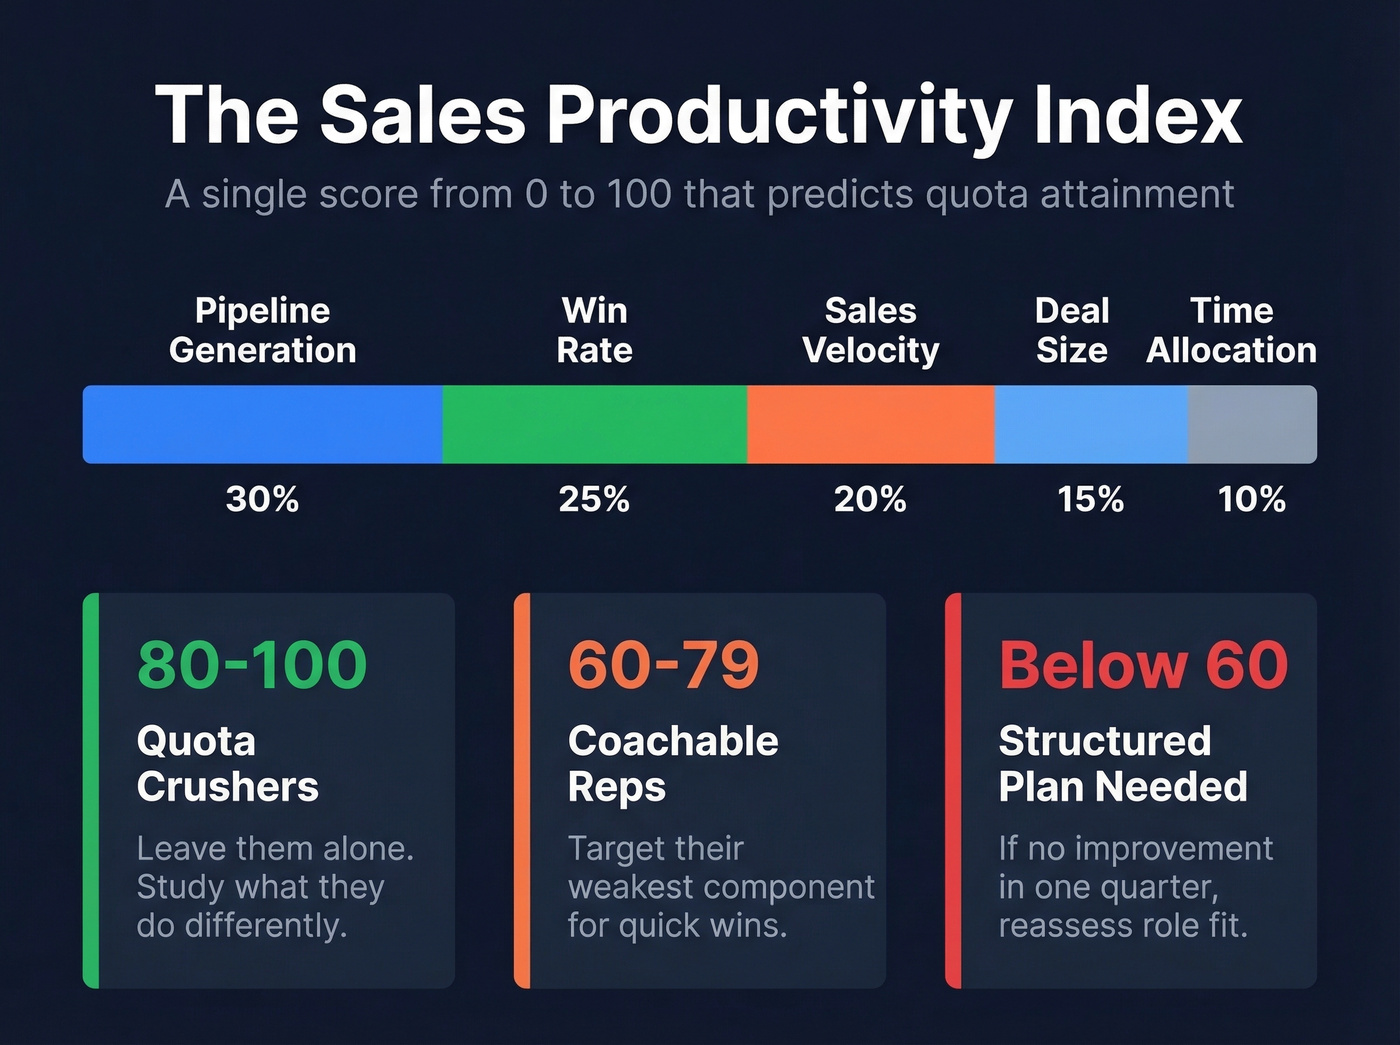
| Component | Weight | What It Measures |
|---|---|---|
| Pipeline Generation | 30% | New pipeline created |
| Win Rate | 25% | Conversion effectiveness |
| Sales Velocity | 20% | Revenue throughput speed |
| Deal Size | 15% | Value per opportunity |
| Time Allocation | 10% | Selling vs. admin ratio |
Reps scoring above 80 consistently hit quota - leave them alone and study what they're doing. Reps in the 60-80 range are coachable - targeted interventions on their weakest component will move the needle. Below 60 means a structured coaching plan, and if the score doesn't improve within a quarter, you're looking at a role fit issue.
The weighting tells you where to focus organizational energy. Pipeline generation at 30% is the heaviest because it's the most controllable and has the longest lead time. Time allocation at 10% seems low, but it's a multiplier - improving selling time from 30% to 40% amplifies every other component.
Here's the thing: if your average deal closes under $10K, you probably don't need twelve metrics. Track pipeline velocity, selling time %, and win rate. Everything else is noise at that deal size. The Productivity Index becomes essential once you're running a team of 10+ reps with multi-stage enterprise deals.
KPIs to Stop Tracking
The most popular sales metrics are also the most dangerous. A Morton Kyle poll of sales leaders and CEOs asked which metric is most dangerous to obsess over. The results: 47% said CRM activity counts, 37% said pipeline size, 11% said meetings booked, and just 5% said revenue closed.
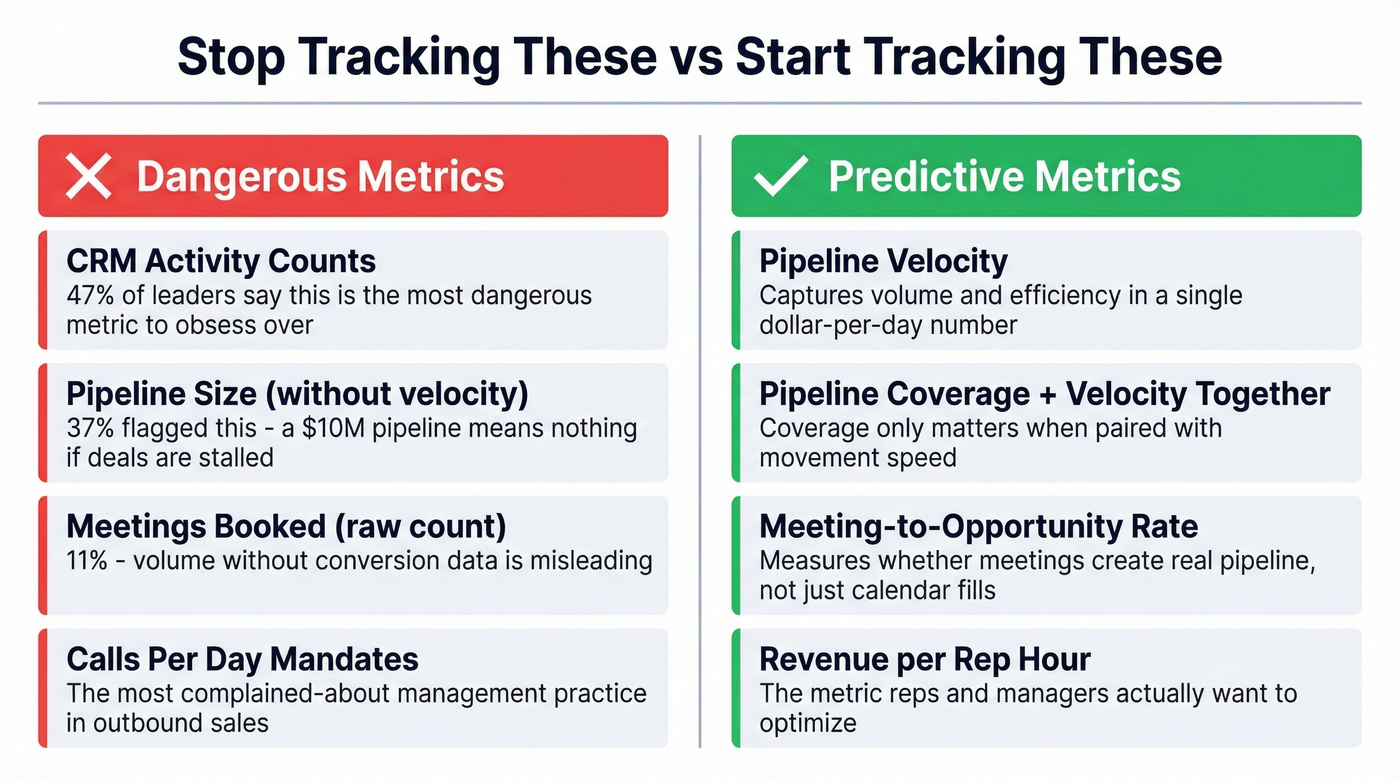
Activity is not progress. CRM activity counts are the most dangerous metric in sales because they're the easiest to game. Logged calls that never happened, emails sent but never read, pipeline updates that don't reflect reality. When you incentivize activity volume, you get activity volume. You don't get revenue. The consensus on r/sales is clear - the "calls per day" mandate is the single most complained-about management practice in outbound. (If you need a cleaner taxonomy, use these sales activities examples to separate activity from outcomes.)
Pipeline size without velocity context is equally misleading. A $10M pipeline sounds impressive until you realize half of it has been sitting in "proposal sent" for 90 days. Stop celebrating pipeline creation in isolation. Celebrate pipeline that moves.
Two metrics we considered but excluded: The SaaS "Magic Number" (net new ARR / prior-quarter sales and marketing spend) is useful for board-level efficiency analysis, but it's not something individual reps or managers can act on daily. Rep coachability scores are gaining traction at companies like Allego, but there's no standardized measurement yet - worth watching, not worth building a dashboard around in 2026.
Setting Targets by Role
Reps need a daily view: pipeline velocity (personal), selling time %, time to first meeting, and stage conversion rates. Keep it to four numbers. Most modern CRMs - HubSpot, Salesforce - have built-in dashboard builders that can surface these in under an hour. When setting productivity goals for individual contributors, tie them directly to these four metrics rather than raw activity counts. (If you're onboarding new hires, a 30-60-90 day plan for sales reps makes these KPIs operational fast.)
Managers need a weekly review: meeting-to-opportunity rate, deal slippage, win rate by rep, pipeline coverage, and revenue per rep hour. If a rep's meeting-to-opportunity rate drops while activity stays flat, that's a qualification problem you can address in a 1:1. Managers should also define clear improvement objectives for each rep based on their Productivity Index score - a rep at 65 needs a different plan than one at 45. (For the dashboard layer, see sales operations metrics.)
Executives need a monthly and QBR view: the Productivity Index score (team average and distribution), pipeline velocity trend, average deal size trend, and sales cycle length trend. These inform headcount planning, quota setting, and capacity forecasting. Organizations using mobile CRM access are 65% likely to reach sales targets versus 22% for those without - if your reps can't check their dashboard from their phone between meetings, you're leaving performance on the table.
How AI Rewrites the Playbook
AI creates a measurement problem worth naming: metric loss. When AI generates the emails, books the meetings, and qualifies the leads, traditional activity KPIs lose their meaning. You can't measure a rep's email volume when AI wrote and sent 80% of those emails. The activity metric didn't change - but what it measures fundamentally did.
Sellers who partner with AI sales tools are 3.7x more likely to meet quota, and 86% of teams see positive ROI within the first year of AI adoption. AI can lift output up to 40% depending on implementation depth and reduce sales cycles by roughly 25%. (If you're building the stack, start with generative AI sales tools.)
The trajectory is steep. Gartner projects that by 2028, AI will close 70% of sales cycles by automating prospecting, qualification, and negotiations. By 2031, 35% of sales organizations will introduce EQ-related productivity metrics as AI handles more transactional work. The new metric categories to start piloting now: deal acceleration impact, buyer engagement quality, and objection resolution effectiveness.
If your team isn't using AI tools yet, the productivity gap is only going to widen. But AI amplifies whatever data you feed it - which brings us back to the problem nobody wants to talk about.
The Data Quality Problem
Every metric in this article assumes your reps are reaching real people. If a big chunk of your emails bounce and phone numbers are disconnected, your pipeline velocity, win rate, and selling time % are all artificially depressed. You're not measuring team performance - you're measuring how much time your team wastes on bad data.
The proof points are stark. Snyk had 50 AEs prospecting 4-6 hours per week with a 35-40% bounce rate. After switching to Prospeo for verified contact data, bounces dropped under 5% and AE-sourced pipeline jumped 180%. 74% of AI-ready sales teams prioritize data hygiene - because clean data isn't a nice-to-have, it's the foundation every other metric sits on. (If you're evaluating vendors, compare data enrichment services before you commit.)
Pipeline velocity is your single best revenue predictor - and the fastest lever is cutting sales cycle days. When reps reach decision-makers on the first attempt with verified emails and direct dials (125M+ mobile numbers, 30% pickup rate), cycles shrink and velocity compounds. At $0.01 per email, the ROI per rep hour isn't even close.
Shave days off your sales cycle by reaching the right person first.
FAQ
What's the single most important sales productivity metric?
Pipeline velocity. It combines opportunity count, deal size, win rate, and cycle length into one number showing how fast your pipeline converts to revenue. If you're only tracking one thing, track this - it's the closest thing to a real-time revenue forecast.
How often should you review these metrics?
Reps should check activity-to-outcome ratios daily. Managers should review pipeline health and conversion metrics weekly during 1:1s. Executives should assess the Productivity Index and velocity trends monthly, with deep-dives at QBRs. Matching review cadence to decision authority ensures problems surface before they compound.
How does bad contact data affect productivity numbers?
Directly and severely - Snyk saw a 180% pipeline increase just by dropping bounce rates from 35% to under 5%. When emails bounce, reps waste hours re-researching contacts instead of selling. This deflates selling time %, inflates cycle length, and drags down pipeline velocity across the board.
What should a new sales team track first?
Start with three metrics: pipeline velocity, selling time %, and win rate. These cover pipeline health, efficiency, and conversion quality without overwhelming a team still building its process. As you scale past ten reps, layer in the full Productivity Index for more granular coaching by role.