How to Create a Sales Territory Map in Excel (and When to Ditch It)
Your VP wants a territory map by Friday. You don't have Salesforce Maps. You don't have budget for a dedicated mapping tool. You've got Excel, a half-clean spreadsheet, and a Slack thread full of "wait, who owns Ohio?"
Good news: you can build a sales territory map in Excel that's clear enough to make decisions from. Bad news: Excel will also make you want to throw your laptop if your territories don't line up with neat county or ZIP boundaries.
Territory realignment can increase revenue by 2-7% without adding headcount, according to Xactly. A map makes the problems obvious: rep overlap, white space, and the "we swear we cover that area" gaps that show up the second you color-code it.
What you need (before you start)
A few basics determine whether this takes 20 minutes or your entire afternoon:
- Microsoft 365 (subscription). Older perpetual versions have limited map support.
- An internet connection. Excel maps use Bing Maps under the hood, so offline = no map.
- A decision on method:
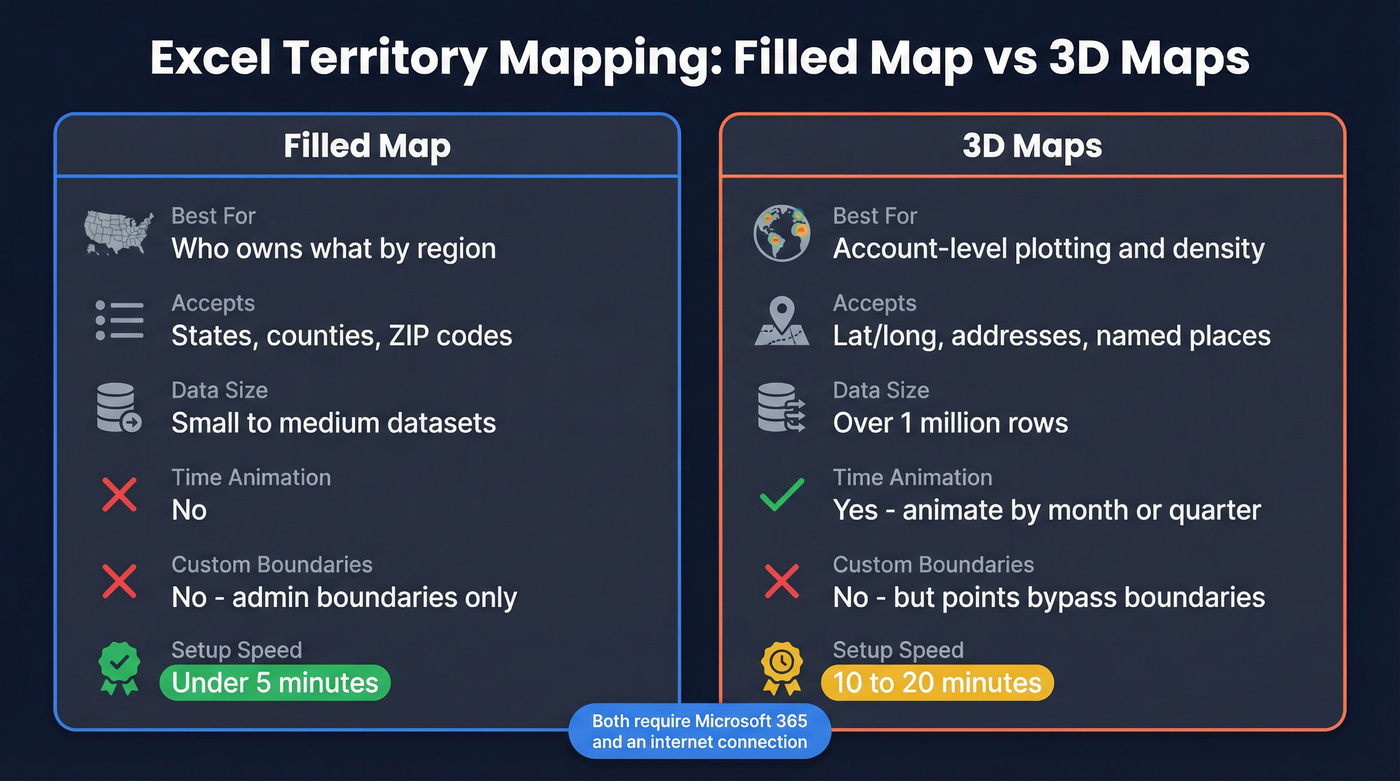
- Filled Map for fast, boundary-based territory views (states, counties, ZIPs).
- 3D Maps for point plotting (lat/long, addresses) and big datasets.
One more thing we learned the hard way: Excel is fine for a simple org with a few dozen territories. Once you're juggling constant changes, exceptions, and "special handling" accounts, it stops being a tool and starts being a chore.
Prepare your territory data (this is where most maps die)
Most "Excel map doesn't work" issues aren't Excel. They're the spreadsheet.
Use a clean, boring schema like this:
| State | County or ZIP | Rep Name | Territory Code | Value |
|---|---|---|---|---|
| IL | 60601 | Sarah K. | MW-03 | $420K |
| CT | 06103 | James R. | NE-01 | $310K |
Now the rules. Follow them and you'll save yourself hours.
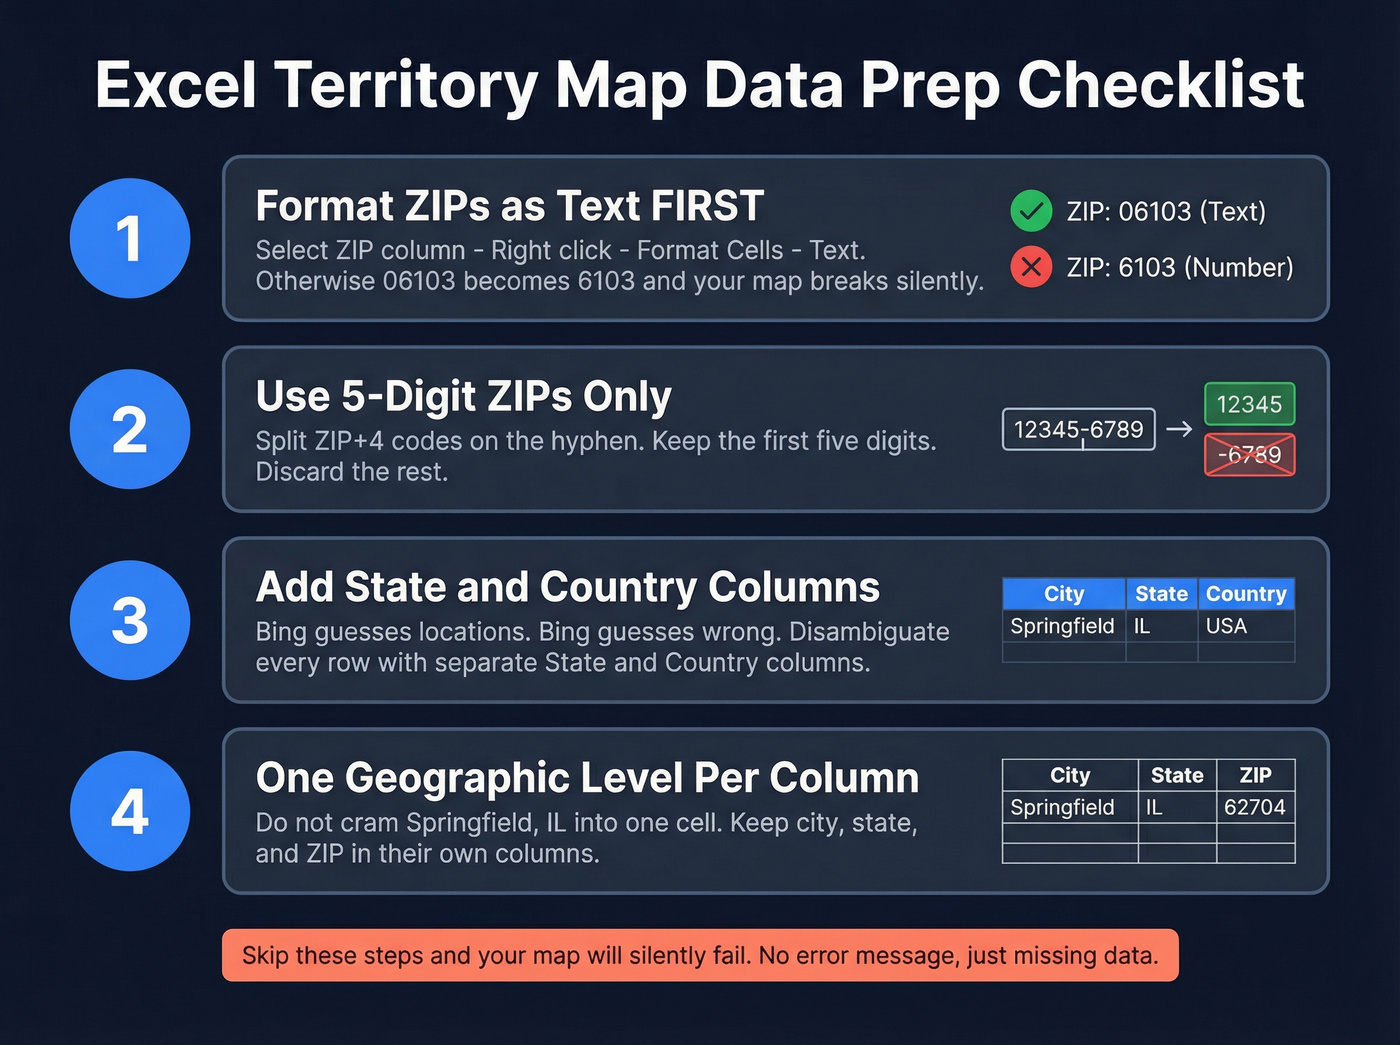
1) Format ZIP codes as Text before you type or paste.
Select the ZIP column -> right-click -> Format Cells -> Text. If you need a display format instead, a custom format like 00000 also works for leading zeros (example walkthrough): https://help.littlegreenlight.com/article/53-working-with-leading-zeros-in-northeast-zip-codes. If you skip this, 06103 turns into 6103 and Excel quietly breaks your map.
2) Stick to 5-digit ZIPs.
ZIP+4 (like 60601-3456) is where things get flaky. Split on the hyphen and keep the first five digits.
3) Disambiguate everything. Bing will guess. Bing will guess wrong. Add a State column and, if there's any chance of confusion, a Country column too. Also, keep each geographic level in its own column; don't cram "Springfield, IL" into one cell and hope Excel sorts it out.
Method 1: Filled Map chart (fastest for territory boundaries)
If you just need a clean "who owns what" map by ZIP, county, or state, Filled Map is the move.
- Select your data range (include headers).
- Optional but helpful: convert your location column to the Geography data type via the Data tab.
- Go to Insert -> Maps -> Filled Map.
- Excel renders a map chart colored by your data. Microsoft's help doc is here: https://support.microsoft.com/en-us/office/create-a-map-chart-in-excel-f2cfed55-d622-42cd-8ec9-ec8a358b593b
Two practical tips that make these maps usable in a sales meeting:
- Category maps (color by Rep Name or Territory Code) are usually what leaders want. It's instantly readable.
- Value maps (gradient shading) are great for pipeline/revenue, but only if your data's normalized. Otherwise one monster account turns the whole map into "one dark blob and a bunch of pale nothing."
And yes, add a legend. Always. Without it, you're presenting modern art.
One limitation you can't talk your way around: Filled Map doesn't plot street addresses or lat/long. It's boundary-based. If you need point-level accuracy, go to 3D Maps.
A color-coded map tells you who owns each territory. Prospeo tells you who to call in it. Search 300M+ profiles by region, job title, and buyer intent using 30+ filters - then export verified emails and direct dials straight into your CRM.
Stop mapping territories you can't actually reach.
Method 2: 3D Maps (for lat/long, accounts, and time)
3D Maps is Excel's heavier option. It's available in Microsoft 365 and Excel 2016+.
Go to Insert -> 3D Map -> Open 3D Maps. Excel opens a separate window with a globe. Drag your geographic fields into Location, then drop metrics into Height or Category.
Why we'd pick 3D Maps over Filled Map:
- It accepts latitude/longitude, so you can plot accounts as points.
- It handles huge datasets (Excel can visualize over a million rows in 3D Maps): https://support.microsoft.com/en-us/office/get-started-with-3d-maps-6b56a50d-3c3e-4a9e-a527-eea62a387030
- It supports time, so you can animate changes (pipeline growth by month, churn by quarter, expansion by region).
A real scenario: we once had a team doing a mid-year territory reset after a product line took off in two metro areas. A Filled Map made it look like "the whole state is hot." 3D Maps showed the truth: two dense clusters and a lot of empty miles. That changed headcount planning in one meeting.
Troubleshooting: the stuff that makes people hate Excel maps
Look, Excel maps are temperamental. Here's what actually fixes them.
ZIP codes won't map
There's a good thread on r/excel where someone mapping Chicago-area ZIPs said a few codes just refused to render even though 100+ others worked: https://www.reddit.com/r/excel/comments/1pqwoqx/working_on_a_territory_map_for_sales_reps_by_zip/
Usually it's one of these:
- ZIP column isn't Text (leading zeros got wrecked)
- ZIP+4 slipped in
- Missing State/Country, so Bing's guessing
- Bing simply doesn't resolve that postal code reliably
Do the formatting and disambiguation first. If a handful still won't render, it's not you. It's Bing.
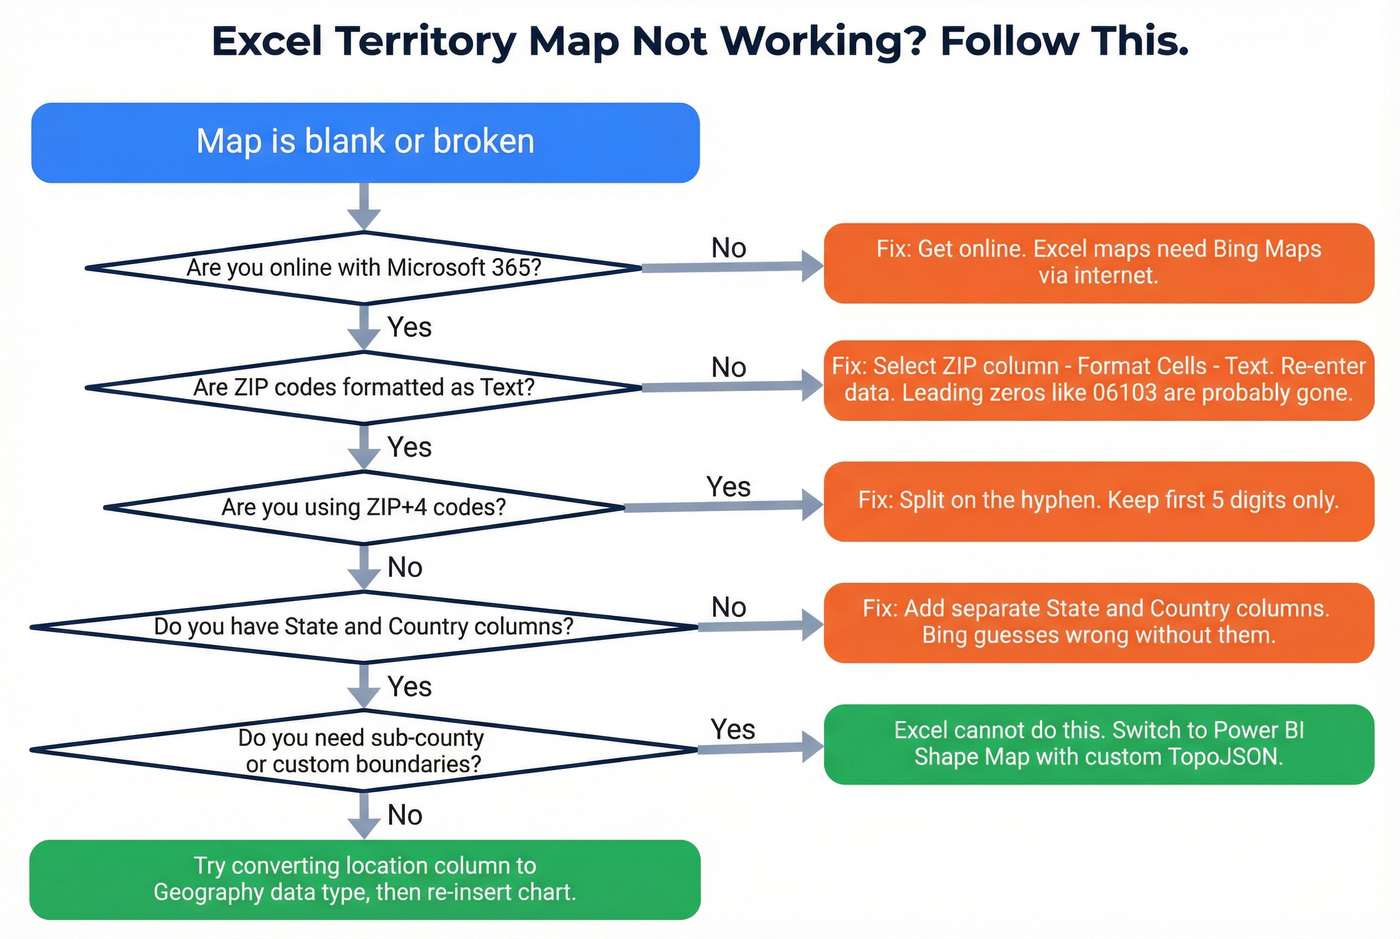
The map is blank or broken
Check the boring stuff:
- You're online
- You're on Microsoft 365 with map support
- Your geography fields are clean and unambiguous
Also, converting the location column to the Geography data type before inserting the chart improves hit rate more than you'd expect.
"My territory splits a county" (Excel can't do it)
Another r/excel thread comes up a lot: someone wants to split a county by a highway, river, or "north side vs south side": https://www.reddit.com/r/excel/comments/1mco1e2/custom_counties_working_on_territory_map_of_us/
Excel won't do custom boundaries inside a county. Filled Map colors whole administrative regions. If your territories don't match standard boundaries, stop trying to force it. You'll waste hours and still end up with a map that lies.
When Excel isn't enough (and what to use instead)
Excel is a sketchpad for territory mapping, not a system of record. In our experience, teams hit the ceiling around 50 territories. Past that, every change turns into manual edits, version-control chaos, and someone inevitably working off "Territories_FINAL_v7_reallyfinal.xlsx".
Excel also can't do drive-time territories, demographic overlays, or true density heatmaps. For field teams, that's not a nice-to-have. It's the whole point.
Here's the tradeoff in plain terms:
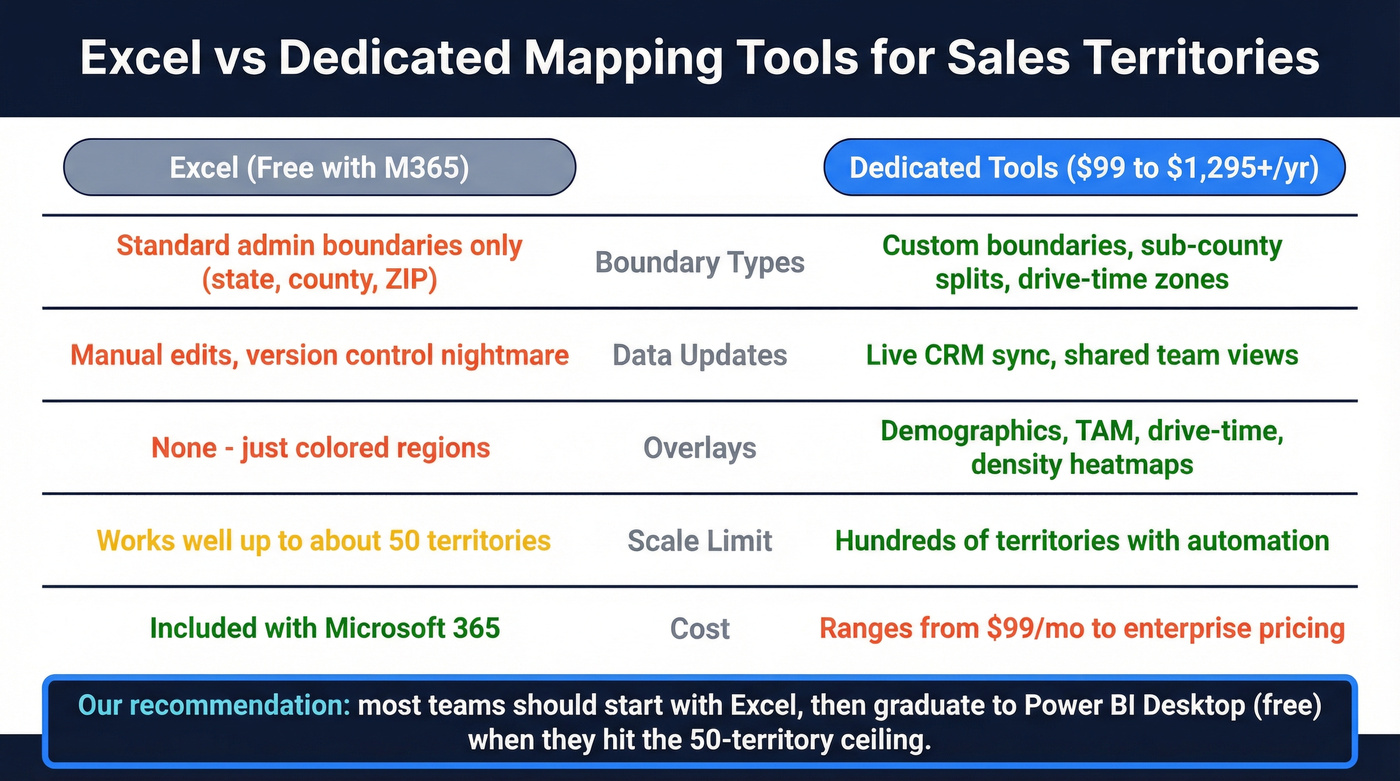
| Excel | Dedicated software |
|---|---|
| Standard admin boundaries only | Custom boundaries, sub-county splits |
| Manual updates, no live data | Live CRM sync and shared views |
| No drive-time or demographic overlays | Drive-time, TAM, and demographic layers |
| Included with Microsoft 365 | Paid (ranges from low-cost to enterprise) |
And here are realistic options, with pricing phrased the way buyers actually see it:
| Tool | Type | Price | Best for |
|---|---|---|---|
| Power BI (Shape Map) | BI visual | Free desktop; Pro starts at ~$10/user/mo | Custom TopoJSON boundaries |
| BatchGeo | Web app | Starts at ~$99/mo | Quick shared maps |
| Google Maps Platform | API/web | Usage-based; often ~$100-1,200/mo | Developer-built custom maps |
| Maptitude | Desktop GIS | Starts at ~$695 one-time | Power users who hate subscriptions |
| Felt | Collaborative mapping | Starts around ~$200/mo (team plans) | Team editing and sharing |
| eSpatial | Territory planning | Starts around ~$1,295/user/yr | Full territory planning workflows |
One strong opinion: most teams don't need a $10K/year mapping platform. They need Power BI Desktop and someone willing to spend an afternoon learning Shape Map.
Power BI's Shape Map visual supports custom TopoJSON boundaries, so you can split counties, draw sales districts, and match the messy reality of how territories actually work: https://learn.microsoft.com/en-us/power-bi/visuals/desktop-shape-map. Desktop is free; you pay for sharing if you need it.
If you're evaluating alternatives, start with a quick scan of territory planning software and then zoom out to the broader territory mapping workflow.
After the map: turn territories into prospect lists
A territory map is only useful if reps can work it. That means each rep needs a clean list of accounts and contacts inside their patch, not just a colored ZIP cluster on a slide.
This is where tools like Prospeo fit naturally: once territories are set, you can filter by geography (ZIP, state, metro area), layer in job title and industry, and export verified contacts per rep. Prospeo includes 300M+ professional profiles, 143M+ verified emails, and 125M+ verified mobile numbers, with 98% email accuracy and a 7-day refresh cycle, so reps aren't burning their first week on bounces and dead numbers.
We've seen the pattern over and over: the map gets approved, then the team stalls because list building turns into a scavenger hunt across spreadsheets, old exports, and "does anyone have a contact at this account?" threads. Don't let that be the bottleneck.
If you want the territory work to actually show up in pipeline, pair mapping with a lightweight sales territory plan and track outcomes with a simple sales dashboard (coverage, pipeline by region, and rep overlap).

Territory realignment only drives revenue if reps can reach the right buyers in their new zones. Prospeo delivers 98% accurate emails and 125M+ verified mobile numbers - filtered by state, metro, industry, and headcount - so every territory has pipeline from day one.
Turn every territory on your map into a loaded pipeline.
FAQ
Can Excel map ZIP codes?
Yes. Excel's Filled Map chart supports 5-digit US ZIP codes. Format the ZIP column as Text before entering data to preserve leading zeros; otherwise Northeast codes like 06103 can break and won't render.
Can I use latitude and longitude in Excel maps?
Filled Map charts only accept named geographies like countries, states, counties, and postal codes. For lat/long plotting, use 3D Maps (Insert -> 3D Map), which accepts coordinate pairs and can visualize very large datasets.
What's the best free tool for territory mapping beyond Excel?
Power BI Desktop. Its Shape Map visual supports custom TopoJSON boundaries, so you can define territories that don't match standard administrative regions. Desktop is free; sharing typically starts with Power BI Pro at about $10/user/month.
How do I turn territory assignments into an actual prospect list?
Export your territory-to-rep mapping, then use a B2B database with geographic filters to build lists per territory. Prospeo lets you filter by ZIP, state, or metro area alongside job title and industry, then export verified contacts with 98% email accuracy. The free tier includes 75 emails per month.