Serviceable Addressable Market: What SAM Actually Means (With Real Numbers)
Your co-founder just put "$50B TAM" on slide 7 of the pitch deck. The investor across the table isn't impressed - they're already mentally skipping ahead. CB Insights found that 43% of 431 failed VC-backed companies cited poor product-market fit, and a hand-wavy market slide is the first red flag that a founder doesn't understand who they're actually selling to.
Understanding the serviceable addressable market meaning is where that clarity starts.
The Short Version
SAM is the slice of your total addressable market you can realistically reach and serve with your current product, pricing, and distribution. You narrow your TAM by geography, customer segment, and product fit.
A healthy SAM for a startup sits between 5% and 15% of TAM. Investors don't care how big your TAM is. They care whether your SAM is defensible and your path to capturing it is credible.
SAM Definition, Explained
SAM - sometimes called serviceable available market - is the portion of TAM your business can actually target and serve today with your current business model and capabilities. It's not the whole market. It's the part your product, pricing model, and go-to-market motion can support right now.
Here's the boundary that trips people up: SAM is what you can target. SOM (serviceable obtainable market) is what you can convert. SAM doesn't account for competitors - it assumes you're the only option. SOM layers in competition, brand recognition, and sales capacity to estimate what you'll realistically win.
There's also PAM - potential addressable market - which captures customers who aren't in the market yet but could be in the future. Uber's early market sizing was often framed around the ~$4.2B US taxi and limo market, but the disruptive narrative reframed the opportunity as the $87B global personal transport market. PAM is useful for big, disruptive stories, but it's not where you start your market sizing.
TAM vs SAM vs SOM Compared
| Definition | What It Ignores | Use Case | |
|---|---|---|---|
| TAM | Total market demand | Your limitations | Ceiling for the category |
| SAM | Market you can serve | Competitors | GTM planning, fundraising |
| SOM | Market you can win | Nothing - it's realistic | Revenue targets, 3-5 yr plan |
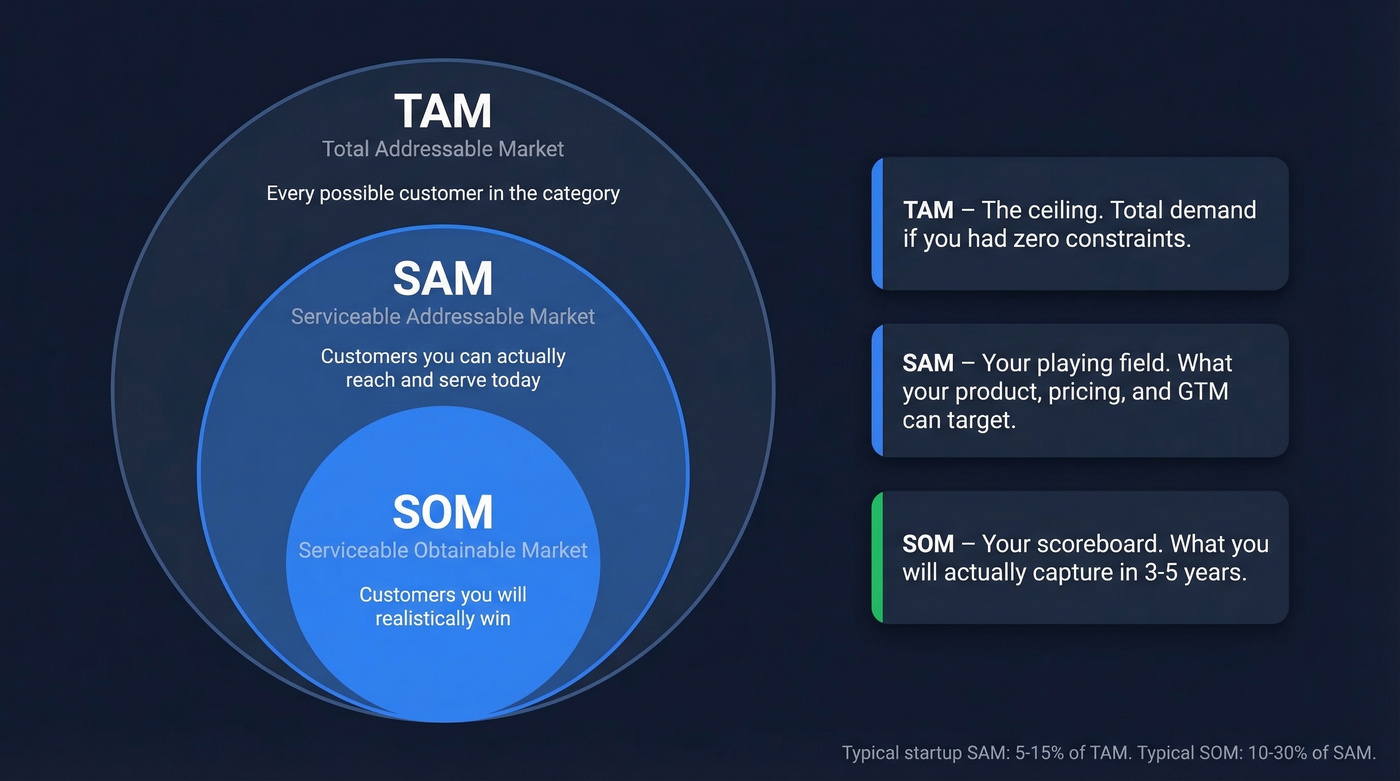
TAM represents the total revenue opportunity if you achieved 100% market share with zero constraints. SAM is theoretical reach. SOM is practical capture - what's achievable in the next 3-5 years given your team, budget, and go-to-market strategy.
We've reviewed hundreds of pitch decks, and the SAM slide is where most founders lose the room. People either inflate SOM to look ambitious or skip it entirely because they haven't done the work.
Bottom-up SAM math is only as good as the data behind it. Prospeo's database covers 300M+ professional profiles with 30+ filters - company size, industry, geography, technographics - so you can validate your ICP segments against real counts, not assumptions.
Size your market with real company data, not analyst reports.
How to Calculate SAM
Before you pick a method, frame the question precisely. Michael Silverman's template nails this: How large is the market in [dollars/customers/units] in [geography] for [customer type] across [time period]? If you can't fill in every bracket, you're not ready to size anything.
One founder on r/startups put it bluntly: "I can find definitions everywhere, but no information about what really realistic assumptions are." Fair enough. Start with the question, then pick your method.
Top-Down Approach
Start with a published market size from Gartner, Statista, or IBISWorld and subtract the segments you can't serve. This works as a sanity check, not a primary method.
A useful heuristic: in mature markets, include roughly 60% of your target market in SAM. In emerging markets that require customer education, drop that to 20%. The gap between those two numbers is enormous, which is exactly why top-down alone isn't enough.
Bottom-Up Approach
This is the method investors trust most because it's harder to inflate. Most pitch deck templates push top-down sizing because it's easier. Bottom-up forces you to show your assumptions, and that's the point.
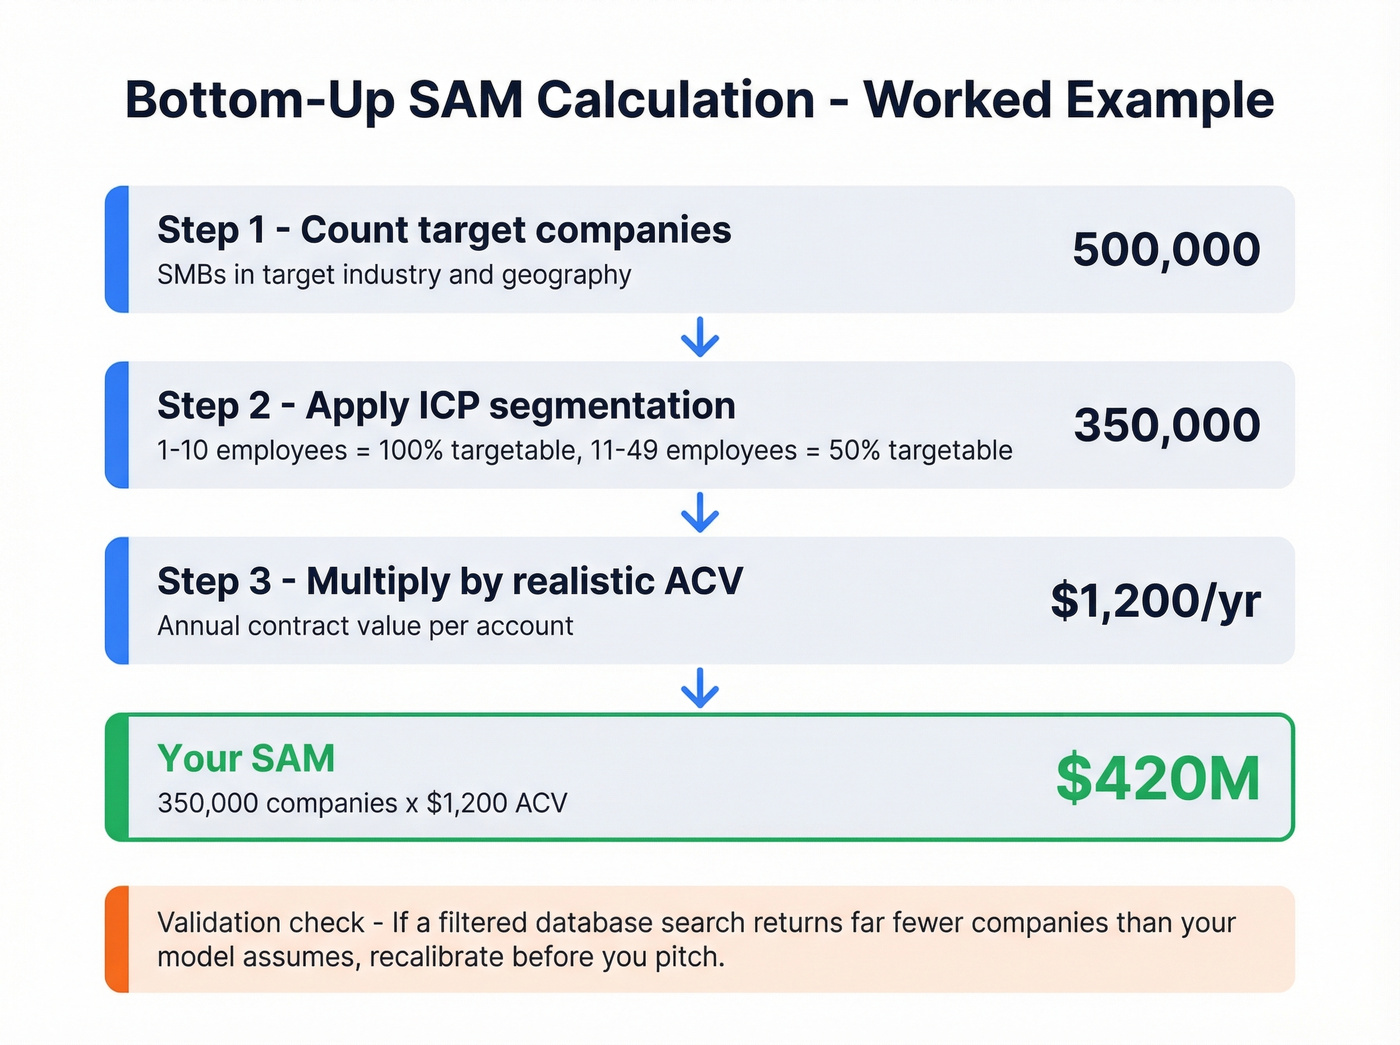
Let's walk through a worked example for a B2B SaaS tool targeting SMBs:
- Start with a count of companies in your target industry and geography: 500,000
- Apply your ICP fit by segment:
- 1-10 employees = 100% targetable (your core product-market fit sweet spot)
- 11-49 employees = 50% targetable (PMF weakens at that size)
If that segmentation yields 350,000 target companies, multiply by a realistic annual contract value - say $1,200/year - and your SAM is $420M.
The formula: target companies x realistic ACV = SAM.
Once you've defined segments on paper, validate that those companies actually exist. Prospeo lets you filter by company size, industry, geography, and technographics - the same dimensions you used to define SAM - across 300M+ professional profiles. If your bottom-up model says 350,000 target companies and a filtered search returns 40,000, your assumptions need serious recalibration before you step into a pitch meeting.

Value Capture Method
For pricing-driven markets, estimate the value your product delivers to each customer, then calculate the percentage you can capture as revenue. This method works best when you have strong unit economics data and variable pricing. It's less common at seed stage but becomes critical as you scale into enterprise deals where pricing is tied to ROI.
SAM Benchmarks by Stage
| Stage | SAM as % of TAM | SOM as % of SAM | Timeframe |
|---|---|---|---|
| Seed / Early | 5-15% | 10-30% | 3-5 years |
| Established | 15-30% | 10-30% | 3-5 years |
Let's be honest: your SAM should feel embarrassingly small. In our experience, the decks that get funded have tight SAMs with airtight bottom-up math. A tight, well-defended SAM with a clear path to SOM signals you understand your market. A $50B SAM with a "we just need 1%" narrative signals you don't.
Your market sizing only needs to be accurate by order of magnitude. Precision matters less than intellectual honesty.
Mistakes That Kill Pitch Decks
Quoting global TAM and slapping a percentage on it. "The global CRM market is $80B and we'll capture 0.5%" isn't a strategy. It's a wish.
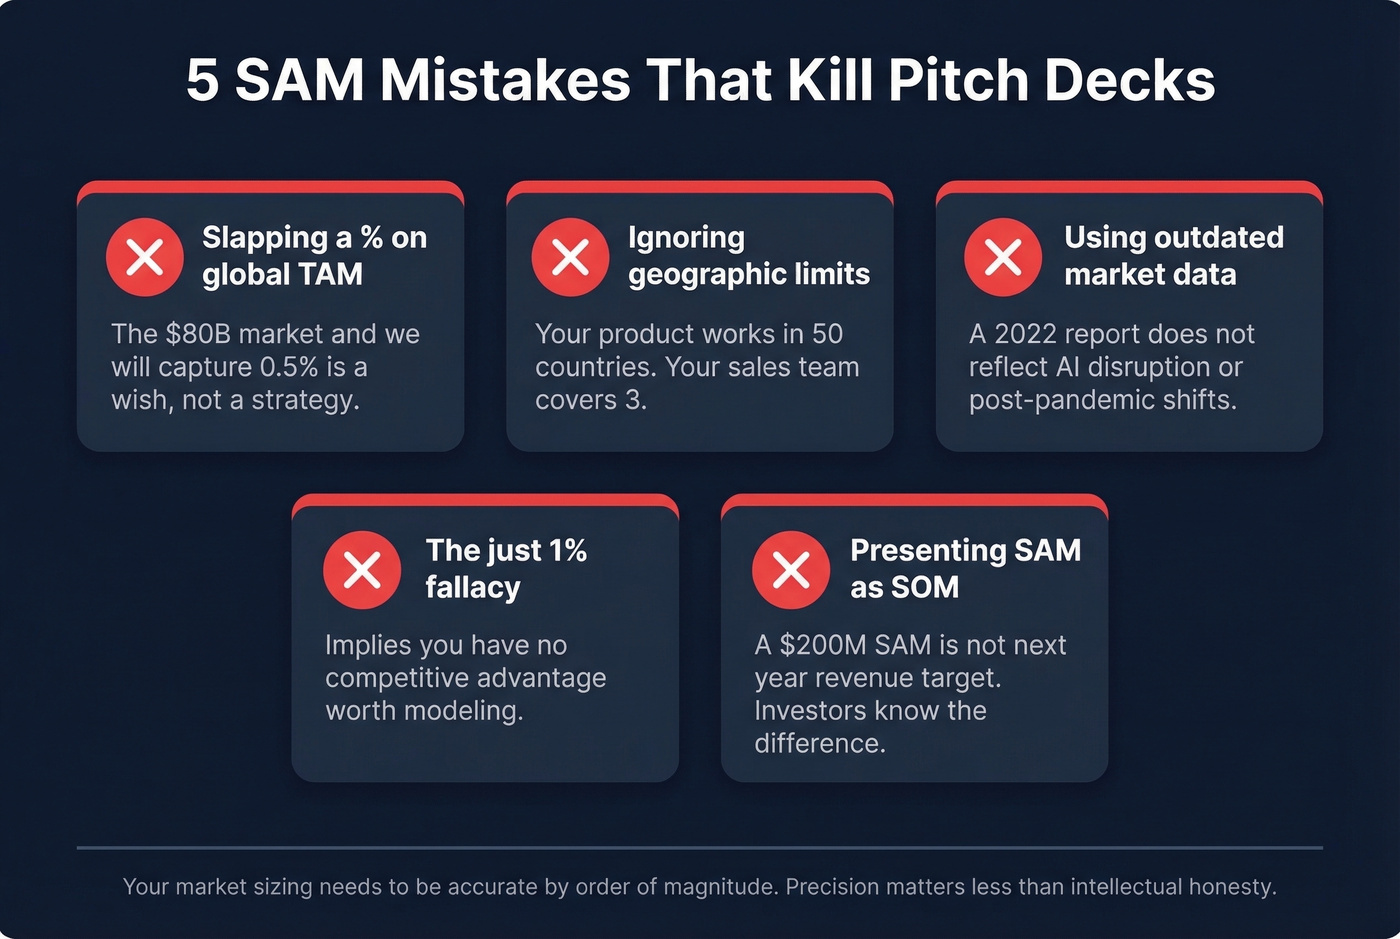
Ignoring geographic and regulatory restrictions. Your product might work in 50 countries. Your sales team, compliance infrastructure, and support hours cover 3. That gap matters.
Using outdated market data. A report from 2022 won't reflect post-pandemic buying patterns, AI disruption, or regulatory shifts. Markets move faster than analyst reports, and investors know it.
The "just 1%" fallacy. Both extremes are lazy. Claiming 100% market share ignores competition entirely; claiming "just 1%" implies you have no competitive advantage worth modeling. Neither tells the investor anything useful about your actual go-to-market plan.
Presenting SAM and implying it's SOM. This one kills credibility fastest. We've seen founders lose deals over this exact mistake - a $200M SAM presented as if it's next year's revenue target. Investors know the difference. If you blur the lines, they'll assume you don't understand the difference at all.
Once your SAM is defined, you need to actually reach those companies. Prospeo gives you 98% accurate emails and 125M+ verified mobile numbers for the exact segments in your market model - at $0.01 per email, no contracts required.
Turn your SAM slide into pipeline. Start with 75 free emails.
FAQ
What's the difference between SAM and SOM?
SAM is the total market you can serve with your current product and distribution - it ignores competition. SOM is the share you can realistically capture after accounting for competitors and sales capacity. SOM typically runs 10-30% of SAM over a 3-5 year horizon.
What's a realistic SAM size for a startup?
Seed-stage startups typically define SAM as 5-15% of TAM. A $50M SAM built bottom-up from real segment data is more compelling to investors than a $500M SAM derived from a Gartner report and a percentage guess.
How does SAM differ from TAM?
The serviceable addressable market meaning focuses on the portion of total demand you can realistically serve today, while TAM represents the entire revenue opportunity if every potential customer bought your product. SAM narrows TAM by applying real-world constraints: geography, product capabilities, and pricing model.
How do you validate SAM with real data?
Cross-reference your segment assumptions against actual company counts using industry databases, census data, or B2B data platforms that let you filter by company size, industry, geography, and technographics. If your model assumes 200,000 target accounts and a filtered search returns 30,000, recalibrate your assumptions before presenting to investors.