How to Calculate TAM and SAM (With Real Data Sources and Examples)
You're three days from a pitch deck deadline and your market sizing slide still feels like fiction. CB Insights analyzed 431 VC-backed companies that shut down since 2023 - 43% cited poor product-market fit among their reasons for failure, and collectively they'd raised $17.5B. A sloppy TAM and SAM calculation doesn't just lose you a funding round. It sends you chasing the wrong customers with the wrong economics until the money runs out.
The short version: TAM and SAM = potential customers x ACV. SAM = TAM filtered by what you can actually reach. SOM = SAM x realistic capture rate. Use bottom-up as your primary method, top-down as a sanity check. If both align within ~15%, your assumptions are solid. Free data sources that actually work: US Census Bureau, BLS, County Business Patterns, NAICS codes - details below.
TAM and SAM in 60 Seconds
TAM is the total revenue opportunity if you somehow captured 100% of the market. It's theoretical, not achievable, but it tells investors the scale of your vision.
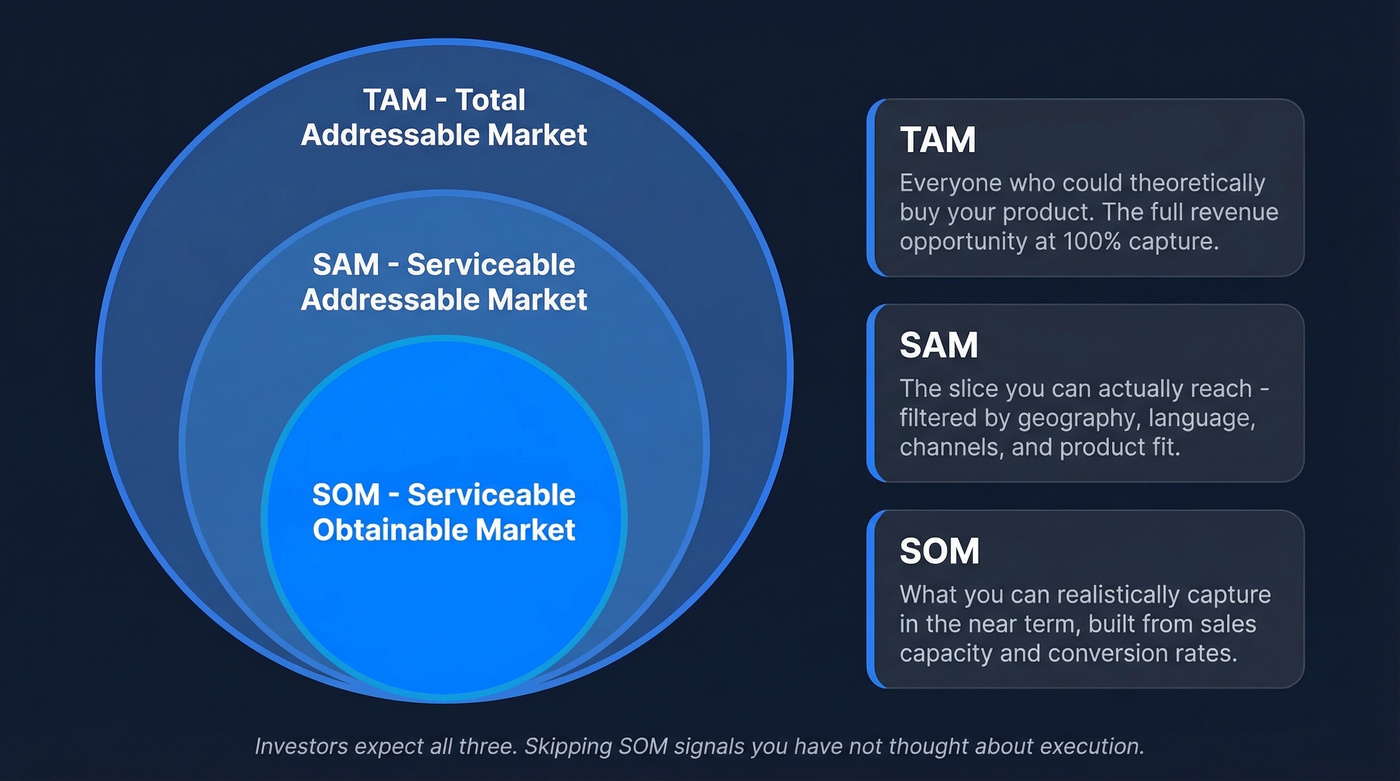
SAM is the slice of TAM you can realistically serve, filtered by geography, language, channels, regulations, and product fit. A SaaS tool sold in English with US payment infrastructure doesn't have a global SAM. Period.
SOM is what you can capture in the near term, built from sales capacity, conversion rates, and competitive dynamics. Investors expect all three. Skipping SOM signals you haven't thought about execution.
The Core Formulas
TAM = Total potential customers x ARPU (or ACV for SaaS). If 50,000 mid-market companies could use your product at $12,000 ACV, your TAM is $600M.
SAM = TAM x percentage you can actually serve. Filter by geography, language, payment infrastructure, and GTM strategy channels.
SOM = SAM x expected market share - but that "expected market share" must come from capacity-based math, not a made-up percentage. Successful SaaS companies often capture less than 1% of TAM but 10-30% of a well-defined SOM.
Market Sizing: A Worked Example
Let's walk through a real scenario. You're building a project management tool for mid-market companies with 50-500 employees in English-speaking markets.
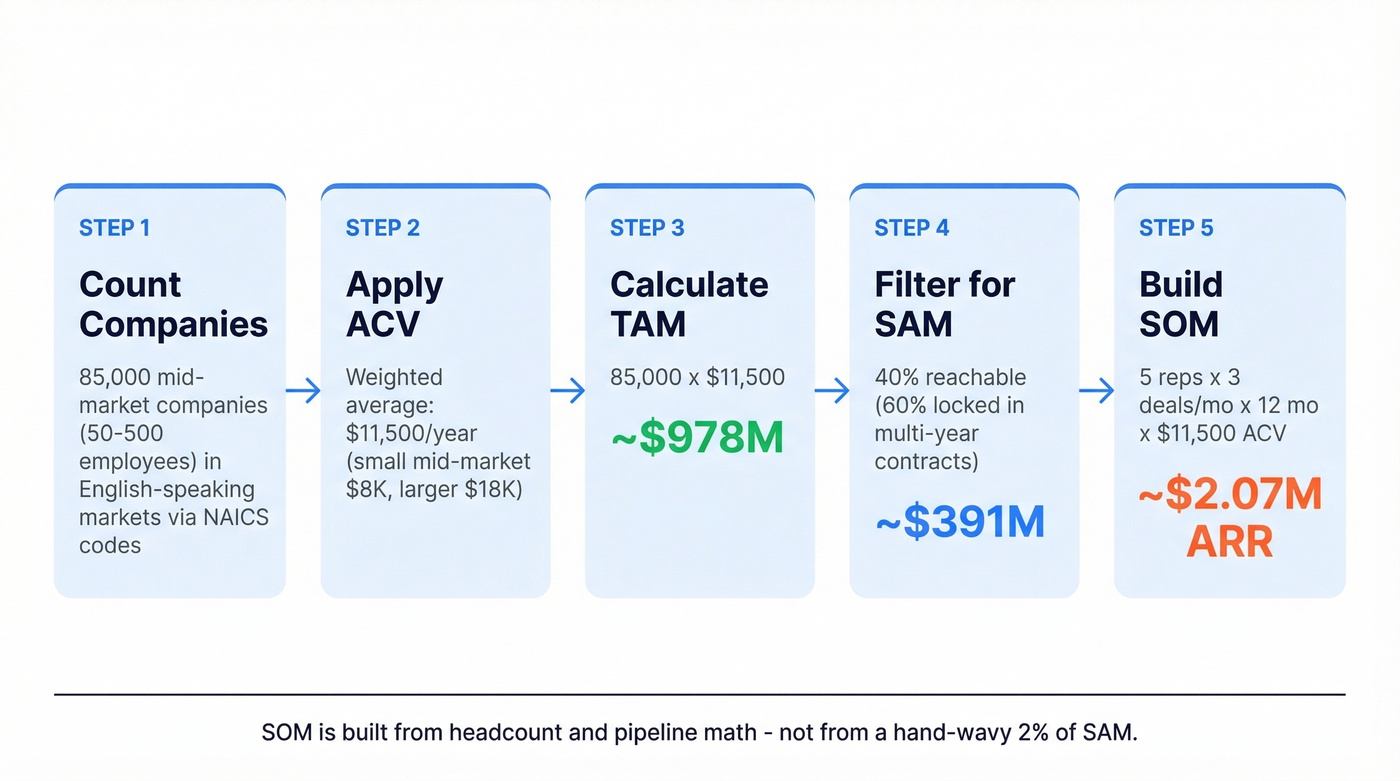
Step 1: Count potential companies. Pull NAICS code 511210 (Software Publishers) and adjacent codes from the US Census Bureau. Add the UK, Canada, and Australia using equivalent national datasets. For this example, assume you identify roughly 85,000 companies in your size range.
Step 2: Apply ACV by segment. Small mid-market (50-200 employees) pays ~$8,000/year. Larger mid-market (200-500) pays ~$18,000/year. Weighted average ACV: $11,500.
Step 3: Calculate TAM. 85,000 x $11,500 = ~$978M. Round to ~$1B for the slide.
Step 4: Filter for SAM. Assume 60% already use entrenched solutions with multi-year contracts, so you can realistically compete for the remaining 40%. SAM = $978M x 40% = $391M (round to ~$390M).
Step 5: Build SOM from capacity. This is the part most decks skip entirely - and it's the part investors actually care about.
- 5 reps x ~3 deals/month each = ~15 deals/month
- 15 deals/month x 12 months = 180 deals/year
- 180 deals x $11,500 ACV = $2.07M in year-one ARR
Add expansion revenue and upsells, and a realistic year-one SOM lands around $2-3M. That's your SOM - built from headcount and pipeline math, not from a hand-wavy "2% of SAM."
You just built SOM from sales capacity - 5 reps, 180 deals, $2M ARR. Now those reps need verified emails and direct dials to hit quota. Prospeo gives you 300M+ profiles with 98% email accuracy and 30+ filters to match your exact ICP segments.
Turn your SAM calculation into a pipeline your reps can actually work.
Top-Down vs. Bottom-Up
Bottom-up starts with your unit economics and builds upward. Use this as your primary method whenever you have existing customers or a defined ICP. It's more credible because it's grounded in your actual business.
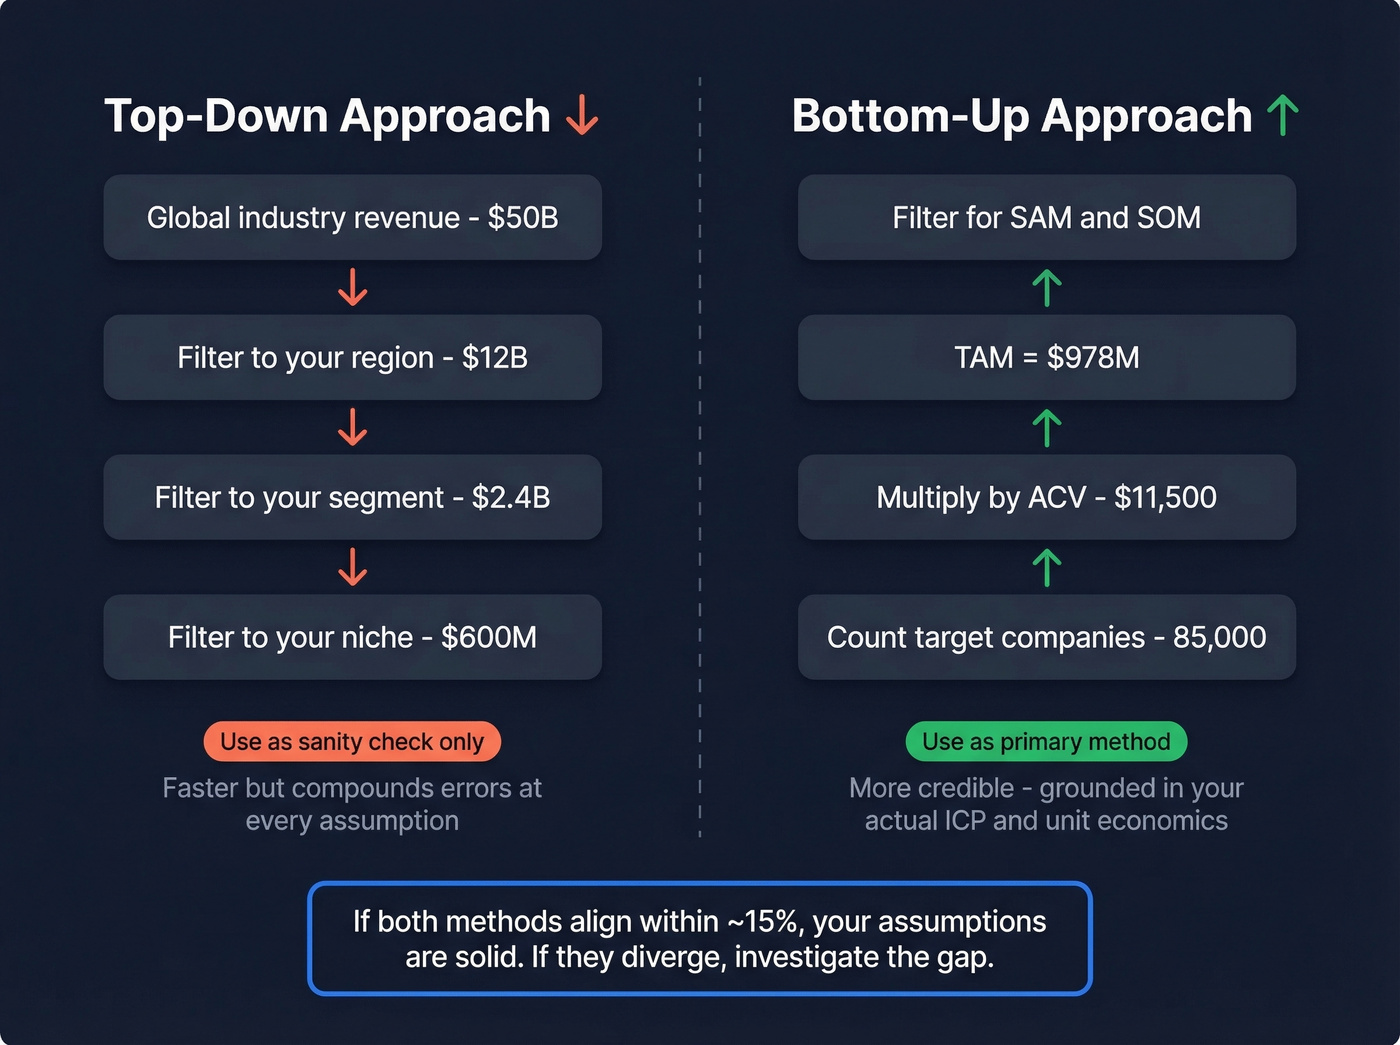
Top-down starts with industry-wide data and narrows down. It's faster but amplifies errors because every broad assumption compounds. Use it as a sanity check, not as your primary number.
Here's the thing: if both estimates align within ~15%, your assumptions hold. If they diverge more than that, investigate the gap. Don't do what we've seen on r/startups - average the two numbers and call it methodology. That's just hoping the errors cancel out.
For teams with deal sizes under five figures and an addressable market under $500M, you probably don't need a top-down estimate at all. Bottom-up from your ICP is enough. Investors care about SOM math far more than a big TAM number you can't defend.
Where to Get the Data
| Source | Best For | Cost |
|---|---|---|
| US Census Bureau | Business counts by NAICS/size | Free |
| BLS | Employment by role and industry | Free |
| County Business Patterns | County-level business counts | Free |
| NAICS codes | Industry segmentation | Free |
| ITC Trade Map | International market sizing | Free |
| Statista | Quick industry size estimates | Freemium |
| Crunchbase | Startup counts and funding data | Freemium |
| IBISWorld | Revenue/growth data by NAICS | ~$1-3K/report |
| PitchBook | Investor-grade company data | ~$20K+/year |
| Gartner/Forrester | Deep industry analysis | $5K+/report |
The free sources are genuinely powerful. The US Census Bureau's County Business Patterns lets you search by NAICS code 511210 to get establishment counts by employee size class - that's your bottom-up foundation right there. BLS gives you role-based counts if your TAM depends on the number of, say, marketing managers in the US. In our experience, these free sources cover most B2B sizing needs without spending a dollar.
Every TAM guide casually says "use Gartner reports" as if $5K per report is pocket change for a pre-seed founder. Start with government datasets. Layer in Crunchbase's free tier for startup counts. You'll get 80% of what you need.
Mistakes That Kill Your Credibility
The "1% fallacy." Saying "we only need 1% of a $10B market" tells investors you didn't do bottom-up work. It's the single most common pitch deck red flag. Bill Gurley famously critiqued Uber's IPO market-sizing logic for similar inflation - and that was Uber.
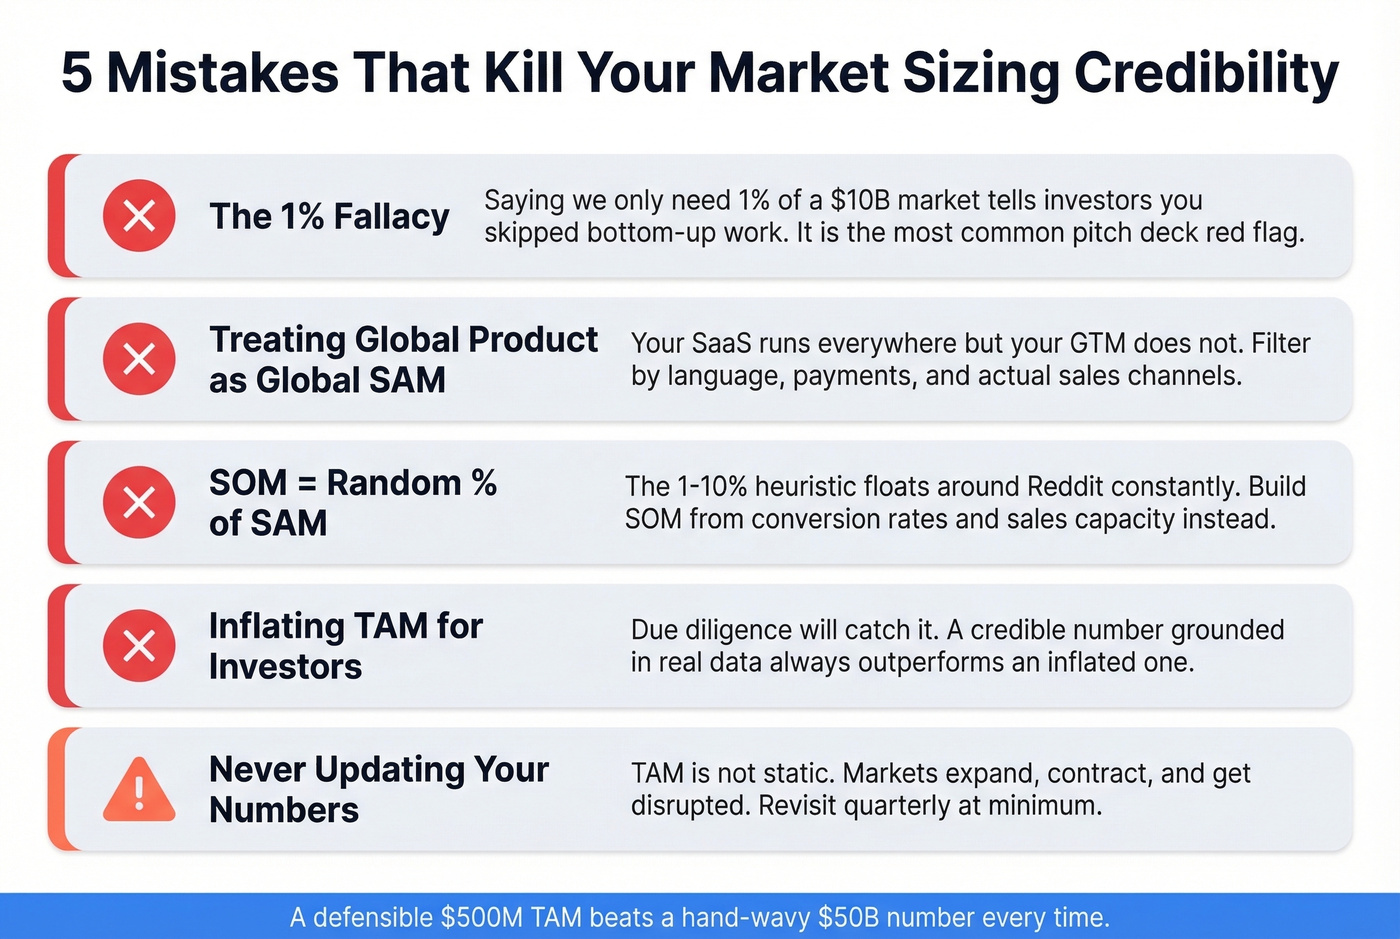
Treating global product as global SAM. Your SaaS runs everywhere, but your GTM doesn't. Filter by language, payment infrastructure, and actual sales channels.
Using "SOM = 1-10% of SAM" without math. This heuristic floats around Reddit and accelerator decks constantly. Skip it. Build SOM from conversion rates and sales capacity instead.
Inflating TAM for investors. Due diligence will catch it. We've reviewed dozens of pitch decks where the market sizing slide was the weakest element - and investors say the same thing. A credible number grounded in real data always outperforms an inflated one that crumbles under questioning.
Never updating. TAM isn't static. Markets expand, contract, and get disrupted. Revisit quarterly at minimum.
From Market Size to Prospect List
Once your SOM is defined, the theoretical work is done. The next step is identifying the actual companies and decision-makers inside that addressable market. Prospeo's B2B database lets you filter 300M+ profiles by industry, company size, and headcount growth with 30+ search filters - turning your TAM model into a contact list you can sell into. With 98% email accuracy, you go from spreadsheet to pipeline without bouncing a third of your outreach.

You filtered by NAICS codes, employee size, and geography to define your market. Prospeo lets you apply those same filters - plus buyer intent, technographics, funding, and headcount growth - across 300M+ verified profiles at $0.01 per email.
Stop sizing the market on a spreadsheet. Start filling your CRM with it.
FAQ
What's the difference between top-down and bottom-up TAM?
Top-down starts with industry-wide revenue data and narrows to your segment. Bottom-up starts with unit economics - customer count times ACV - and builds upward. Bottom-up is more credible with investors because it's grounded in your actual ICP. Use top-down as a sanity check; if both methods align within ~15%, your assumptions hold.
How large should my TAM be for Series A?
Most Series A investors want to see $1B+ in total addressable market. But a defensible $500M TAM with clear SOM math beats a hand-wavy $50B number every time. What matters is that your figures are backed by real data sources and bottom-up logic, not that the number is enormous.
How often should I revisit my TAM and SAM calculation?
Quarterly, minimum. Markets shift, competitors enter, and your product evolves. Stale numbers erode investor confidence fast. Set a calendar reminder to re-pull Census and BLS data each quarter and update your assumptions accordingly.
How do I turn my SAM into an actual prospect list?
Once you've defined your serviceable addressable market by industry, company size, and geography, use a B2B data platform to filter for matching companies. Apply filters like headcount growth, technographics, and buyer intent to build a verified contact list directly from your market sizing criteria. Most platforms offer free tiers so you can validate the approach before committing budget.