TAM, SAM, and SOM: How to Size Your Market Without the Theater
A founder we know spent two weeks building a TAM slide that opened with "$300 billion global opportunity." The investor's response: "Cool. How many customers can you actually sign in 18 months?" That gap - between impressive number and defensible TAM SAM market size - is where most pitches die. As one r/startups thread put it, "Everyone knows TAM is fiction... stitched together from random assumptions, padded with adjacent markets nobody will ever buy."
The big number impresses nobody. Bottom-up math is what gets you funded.
What TAM, SAM, and SOM Actually Mean
TAM (Total Addressable Market) is the total revenue opportunity if you had 100% market share and zero constraints. It's the ceiling - useful for framing ambition, not for planning.
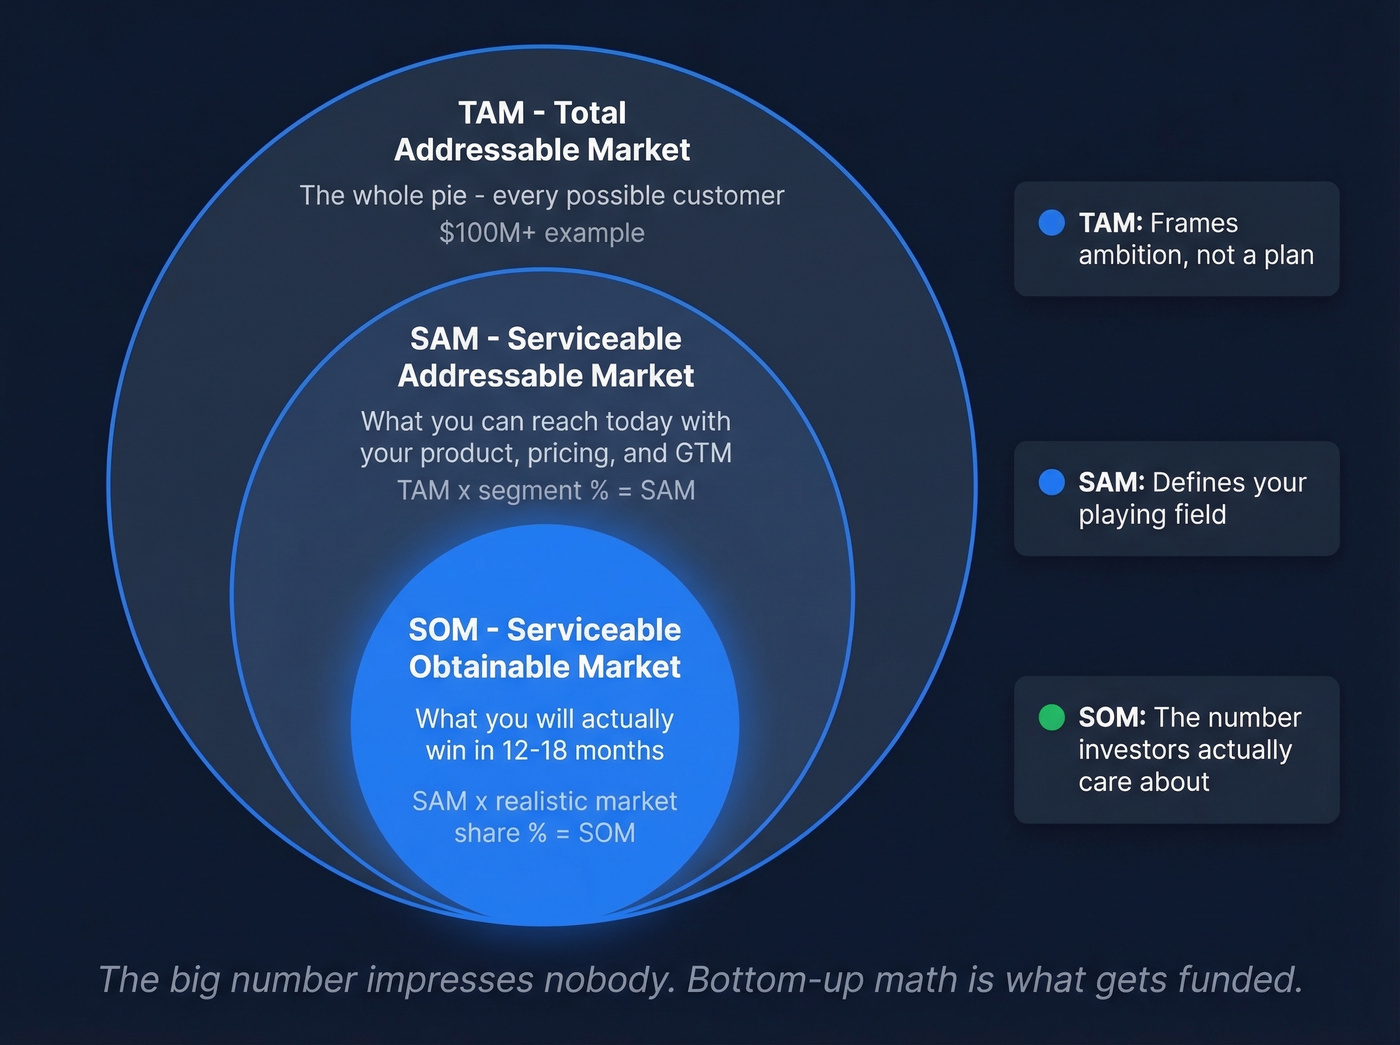
SAM (Serviceable Addressable Market) narrows that to the segment you can actually reach with your current product, pricing, and go-to-market motion. If you sell CRM software to mid-market SaaS companies in North America, SAM excludes the enterprise segment in Asia you can't touch yet. SOM (Serviceable Obtainable Market) is what you'll realistically capture in a defined timeframe - the number that ties directly to your financial model and the one investors care about most.
| Term | Full Name | What It Answers | Formula |
|---|---|---|---|
| TAM | Total Addressable Market | How big is the whole pie? | Customers x avg revenue |
| SAM | Serviceable Addressable | What can we reach today? | TAM x segment % |
| SOM | Serviceable Obtainable | What will we actually win? | SAM x market share % |
How to Calculate Market Size: Two Methods
Top-Down Approach
Start with the total market and filter down. Say the US compliance software market is $8B. Mid-market fintech represents roughly 12% of that spend. Your SAM: $8B x 12% = $960M. Expect to capture 2% in year one? SOM is ~$19.2M.
The problem: every assumption compounds. If that 12% is actually 8%, your SAM just dropped by a third, and your SOM shrinks with it. Top-down is fine for a sanity check, but it shouldn't be the foundation of your pitch.
Bottom-Up Approach
This is where the math gets defensible. Count the actual companies that match your ICP, then multiply by what you'll charge them.
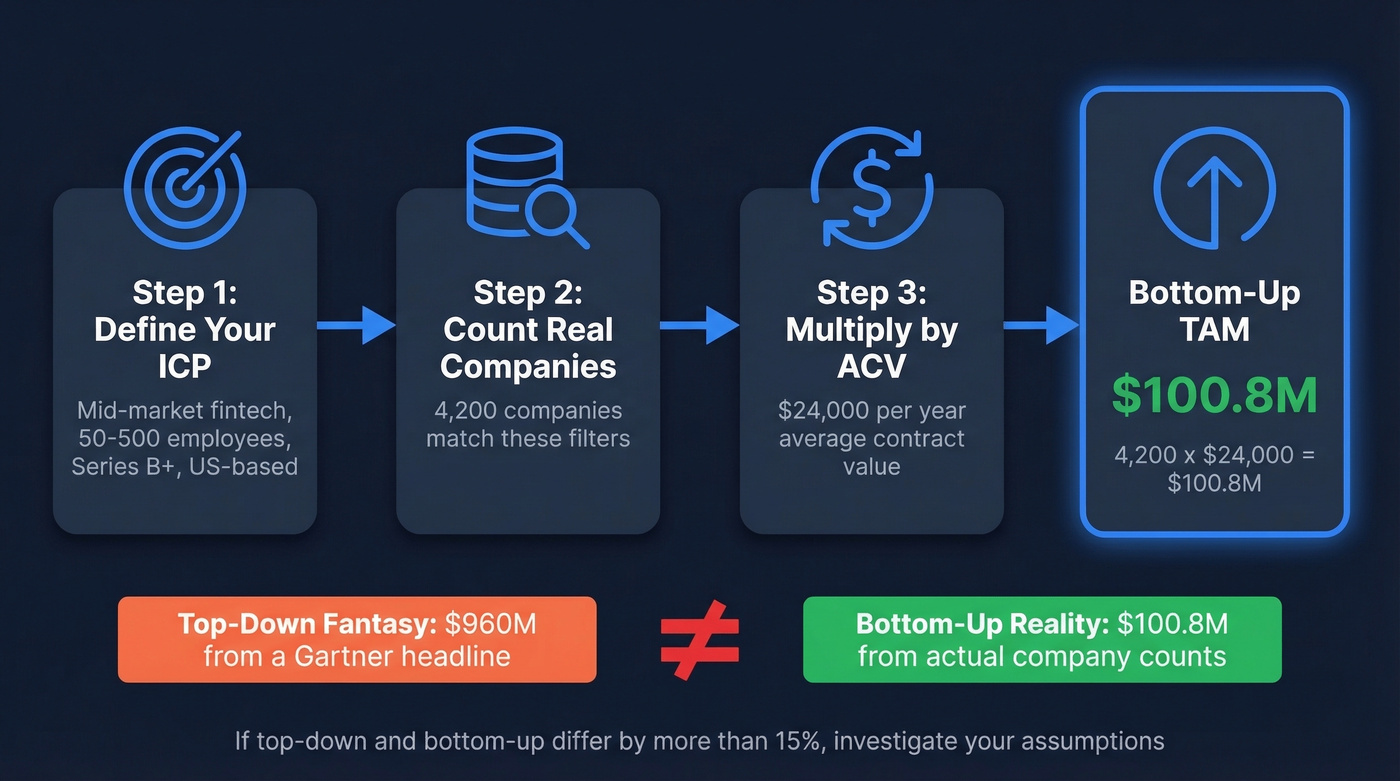
Suppose there are 4,200 mid-market fintech companies in the US with 50-500 employees at Series B or later. Your ACV is $24,000/year. Bottom-up TAM: 4,200 x $24,000 = ~$100M. That's your realistic addressable universe - not a fantasy number pulled from a headline in a Gartner report you didn't read.
The WeWork cautionary tale makes this real. A widely shared WeWork market-sizing case study uses a $1.35T TAM, a $168B SAM, and a $35B SOM to illustrate how founders can "nest" markets that don't connect to an executable plan. If your layers don't connect, neither will your pitch.
Cross-Check: The 15% Rule
Run both methods. If your top-down and bottom-up estimates align within 15%, your assumptions are solid. If there's a massive gap - top-down gives you $960M and bottom-up gives you $100M - investigate. Either your segment filter is too narrow, your ACV is wrong, or the industry report counts adjacent markets you'll never touch.
Bottom-up market sizing starts with an accurate company count. Prospeo's B2B database lets you filter 300M+ profiles by industry, headcount, funding stage, tech stack, and 30+ other criteria - so your TAM is built on real prospect counts, not Gartner headlines.
Turn your ICP definition into an auditable company count in under five minutes.
Free Market Data Sources
Most macro inputs are available at zero cost. Save the analyst reports for later.
| Source | Best For | Cost |
|---|---|---|
| Data.gov | 300K+ US datasets | Free |
| Census Bureau | Business counts, demographics | Free |
| BLS | Industry employment, wages | Free |
| FRED | Economic trends, macro data | Free |
| World Bank Open Data | International markets | Free |
| AWS Open Data | 580+ tech/science datasets | Free |
| Gartner / Forrester | Deep industry analysis | $2K-$5K/report |
For bottom-up company counts filtered by ICP criteria like industry, headcount, and funding stage, Prospeo's free tier gives you 75 credits to start building a defensible prospect list.
What Investors Actually Want
With $125 billion invested in software venture capital globally in recent years, fund economics demand large addressable markets. After reviewing over 1,000 pitch decks, spectup found market sizing is the most consistently weak slide. Let's break down what separates pitches that work from the ones that get a "we'll circle back."
Do this:
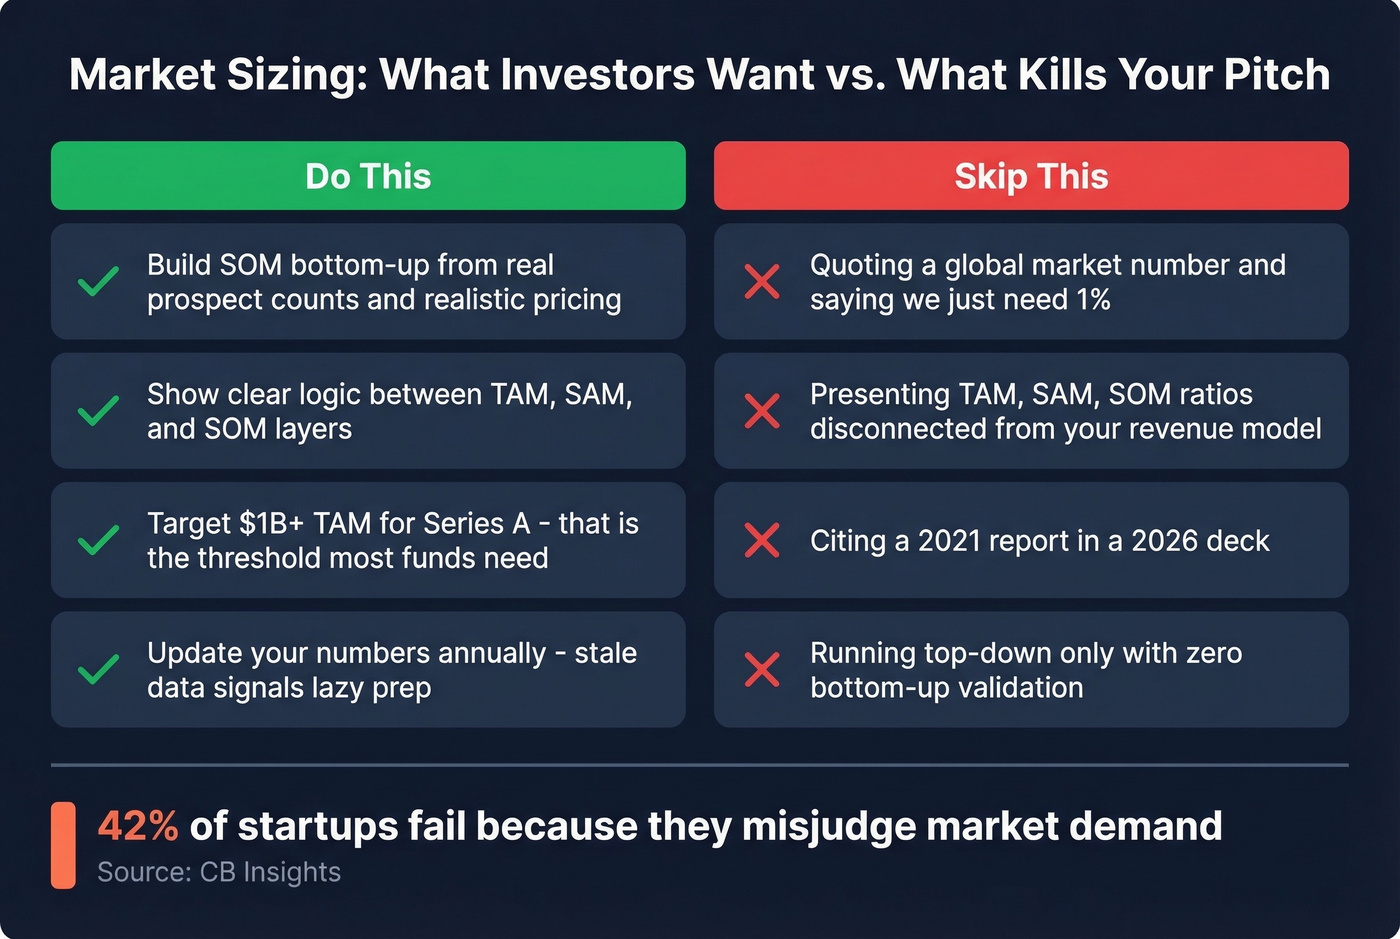
- Build SOM bottom-up from real prospect counts and realistic pricing
- Show the ratio between TAM, SAM, and SOM - investors scrutinize the logic between layers, not just the numbers themselves
- Target a TAM of $1B+ for Series A (that's the threshold most funds need)
- Update your numbers annually - stale data signals lazy prep
Skip this if you want to be taken seriously:
- Quoting a global market number and saying "we just need 1%." The "1% fallacy" kills more pitches than bad products.
- Presenting TAM/SAM/SOM ratios disconnected from your financial model
I'll be blunt: if your average deal size is under $10K and your bottom-up TAM doesn't clear $500M, most institutional VCs won't engage regardless of how elegant your slide is. That's not a reason to inflate - it's a reason to know your audience. Some businesses are better funded by revenue.
Roughly 42% of startups fail because they misjudge market demand. The sizing exercise isn't theater - it's a survival check. As one investor noted on r/venturecapital, "I skip the TAM slide entirely and go straight to the revenue model. If the founder can't connect the two, we pass."
Common Mistakes and Better Alternatives
Four mistakes show up in almost every weak deck.
Googling "global X market size" and dropping that number into a slide without filtering is the most common one we see. Close behind: citing a 2021 report in a 2026 deck, running top-down analysis with no bottom-up validation, and having no clear path from SOM to actual revenue targets. Any one of these is enough for a sharp investor to tune out.
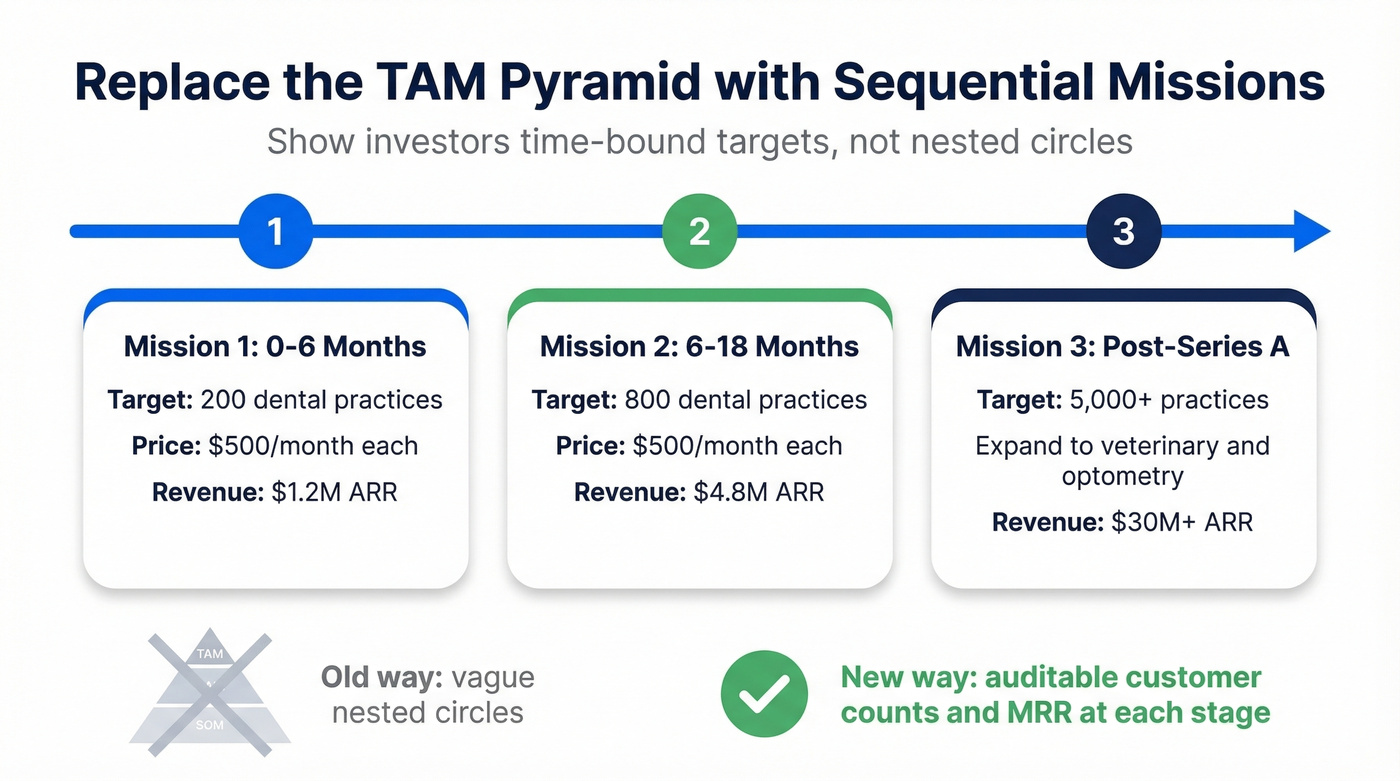
The modern alternative? Replace the classic TAM/SAM/SOM pyramid with what Venture Mechanics calls "sequential missions." Instead of three nested circles, show three time horizons: what you'll capture in 6 months, 18 months, and post-Series A - each with specific customer counts and MRR targets. This is also where a clean sales deck helps you defend assumptions without hand-waving.
Their dental SaaS example makes this concrete: 200,000 dental practices in North America, targeting 800 in the first mission, at $500/month = $4.8M annual revenue opportunity. That's auditable. That's what gets funded. For templates to structure this work, Miro, HubSpot, and Smartsheet all offer free frameworks.
Investors want to see the path from SOM to revenue. Prospeo gives you verified emails (98% accuracy) and direct dials for every company in your serviceable market - so your pitch connects market size to an executable outbound plan.
Go from market sizing slide to live pipeline without switching tools.
FAQ
What's the difference between TAM and SAM?
TAM is total revenue at 100% market share with zero constraints. SAM is the slice you can reach with your current product, pricing, and distribution - typically 10-40% of TAM depending on go-to-market focus. The gap between them reflects geographic, product, and channel limitations you haven't solved yet.
How do I calculate market size without expensive reports?
Use free government data from the Census Bureau, BLS, FRED, and Data.gov for macro inputs. For bottom-up company counts, filter a B2B database by industry, headcount, and funding stage. Cross-reference both approaches and investigate any gap larger than 15%.
What SOM percentage is realistic for a startup?
Early-stage startups typically model SOM at 1-5% of SAM over one to three years. If your model shows 20% capture in year one, investors will question it. Start conservative and show a credible expansion path backed by pipeline data, not optimism.