TAM, SAM, and SOM in Marketing: How to Size Your Market and Actually Use the Numbers
A widely cited benchmark is that 42% of startups fail because there's no market need - and bad market sizing is how that happens. Every guide gives you TAM = Customers x ACV and then uses made-up round numbers. But where do you get the customer count? That's the actual hard part. Founders on r/startups describe the same loop: watch the YouTube explainers, still stare at a blank spreadsheet.
Your VP of Marketing just asked you to size three new segments by end of quarter. Here's how to do it without a $15K Gartner report.
The quick version:
- TAM = total theoretical demand. Impressive on a slide, useless for budget decisions.
- SAM = the slice you can actually serve. This shapes your GTM strategy.
- SOM = what you'll realistically capture. This is the number that sets your marketing budget.
What TAM, SAM, and SOM Mean
TAM (Total Addressable Market) is the entire revenue opportunity if every possible buyer purchased your product. SAM (Serviceable Addressable Market) is the portion of TAM you can realistically reach given your product, geography, and go-to-market. SOM (Serviceable Obtainable Market) is the share of SAM you'll actually capture in a given period.
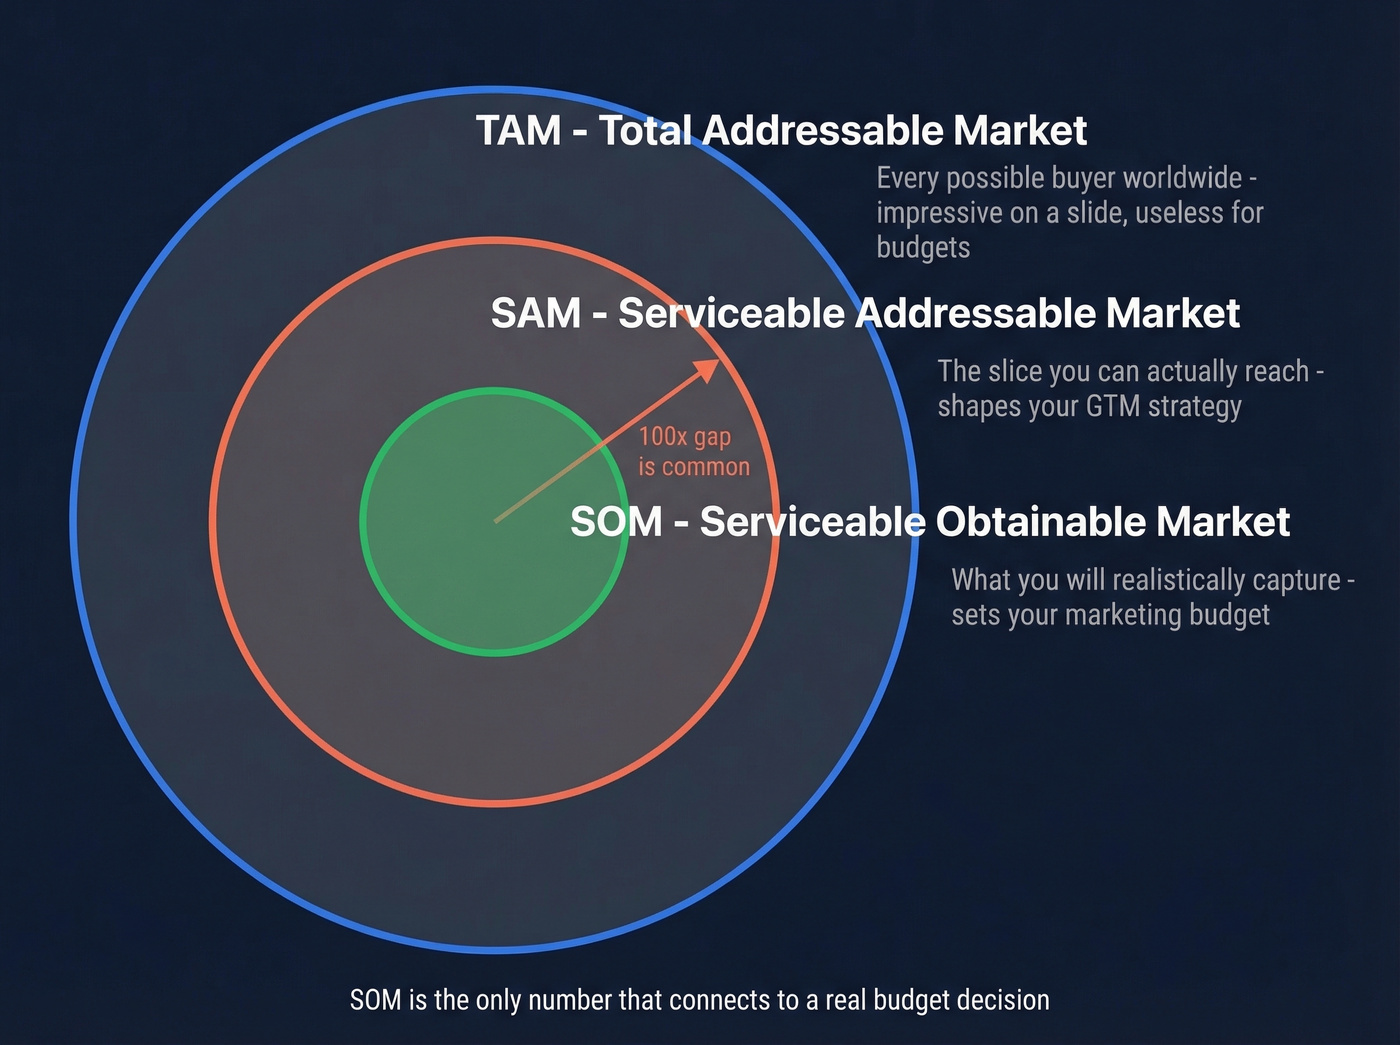
Understanding TAM and SAM is essential before you touch a budget spreadsheet - they set the upper bounds for every downstream decision. The gap between TAM and reality is enormous, though. One SaaS company believed their TAM was $50B, but the realistic opportunity was roughly $500M - a 100x gap. McKinsey pegged the global cybersecurity TAM at $1.5-2T in a 2022 estimate, yet the actual vended market was $150B. We've seen teams burn entire quarters chasing a TAM number that was 10x their real opportunity.
TAM is the least useful number in the framework. SOM is the only metric that connects to a real budget decision.
How to Calculate Each Layer
Three Methods
Top-down starts with industry reports and narrows from macro data. It's fast and sets boundaries, but it masks regional or product-level variance. Best for initial scoping.
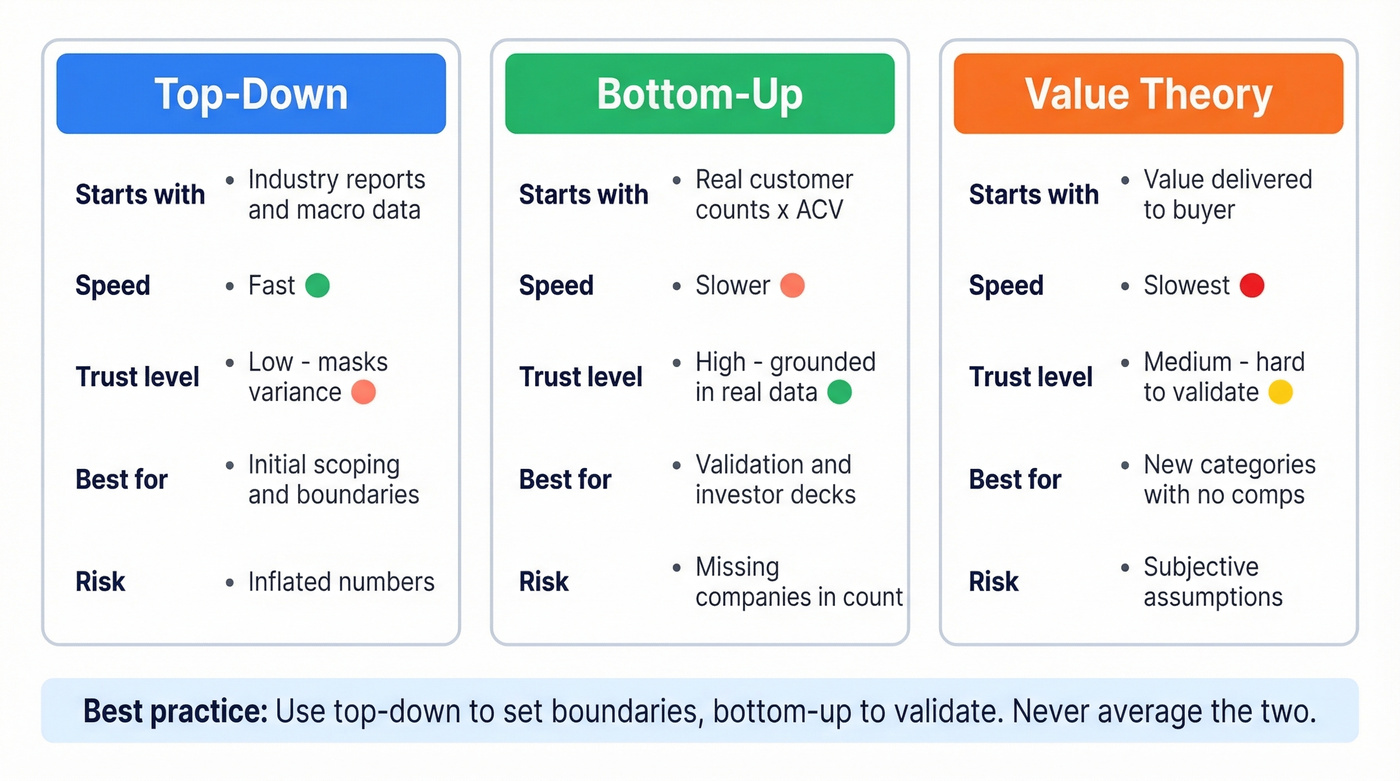
Bottom-up multiplies your potential customer count by ACV. More work, but investors and CFOs trust it because it's grounded in real assumptions - actual companies you can name, actual price points you've tested. Best for validation.
Value theory prices based on value delivered, say a percentage of cost savings your product creates. Only useful when you're creating an entirely new category where no comparable pricing exists.
One founder on r/startups proposed averaging a DIY estimate with a purchased report. Don't do this. If one number is wrong, averaging just hides the error. Use top-down to set boundaries, bottom-up to validate.
Worked Example: B2B SaaS
You sell project management software to agencies with 10-50 employees.
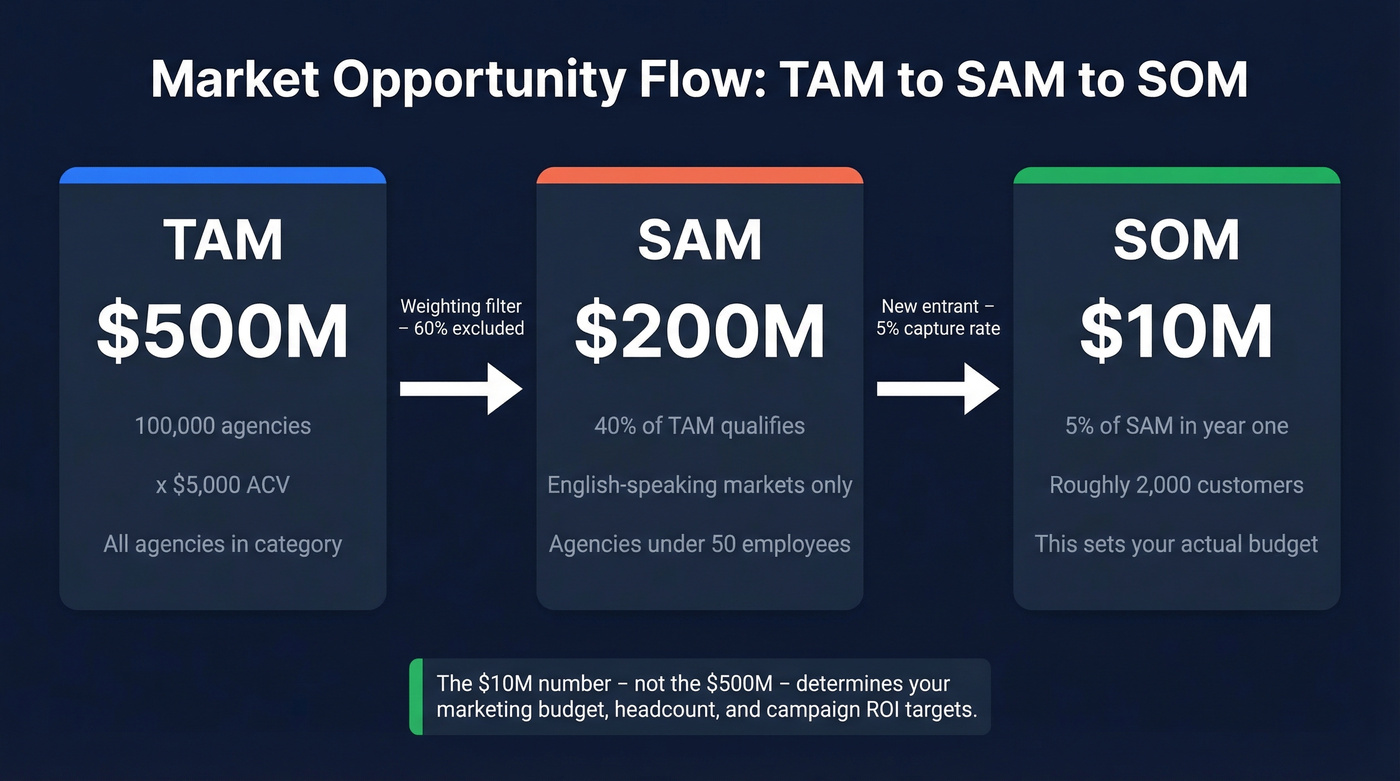
TAM: 100,000 agencies in your category x $5,000 ACV = $500M
SAM: Not all 100,000 are reachable. You only sell in English-speaking markets, and your product fits agencies under 50 people. Apply a weighting technique: agencies with 1-10 employees are 100% targetable, 11-49 are 50% targetable because product-market fit declines at that size. After weighting, 40% of TAM qualifies. SAM = $200M.
SOM: You're a new entrant competing against established players. Assume 5% of SAM in year one. SOM = $10M, or roughly 2,000 customers.
That $10M number - not the $500M - determines your marketing budget, headcount plan, and campaign ROI targets. The same logic applies to e-commerce (total online shoppers in your category x average order value) or services (businesses in your metro x annual contract).
Where to Get the Data
Free sources get you 80% of the way for domestic B2B sizing. Paid reports fill gaps in international markets and emerging categories. In our experience, the Census Bureau plus one paid source covers most B2B sizing needs.
| Source | Type | Best For |
|---|---|---|
| US Census Bureau | Free | Business counts by industry, size, state |
| Bureau of Labor Statistics | Free | Roles by industry (buyer targeting) |
| UN Data | Free | Global population, trade, indices |
| SEC Filings | Free | Public company financials |
| Trade Map / ITC | Free | Import/export, demand by market |
| IBISWorld | Paid | NAICS-mapped industry reports |
| Statista | Paid | Accessible, broad market stats |
| Gartner / IDC | Paid | Analyst reports; often $5K-$15K+ per report |
| PitchBook | Paid | Startup funding, company data |
| Crunchbase | Paid | Company/funding intelligence |
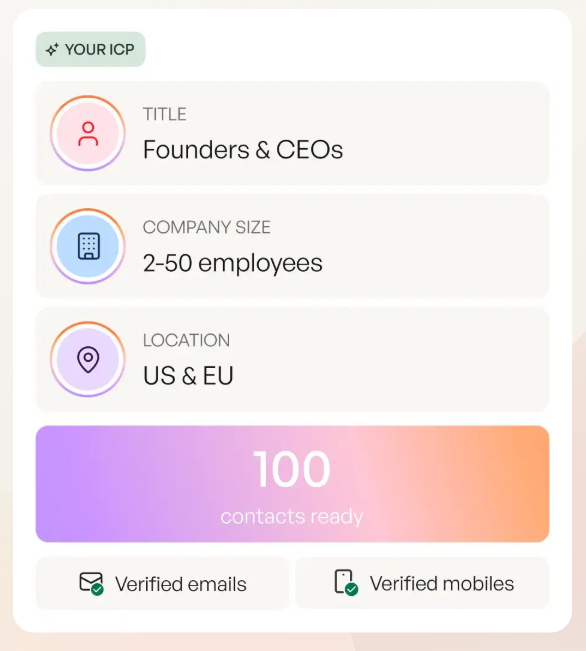
For bottom-up validation, Prospeo's B2B database lets you filter 300M+ professional profiles by industry, headcount, revenue, and 30+ other criteria to count how many companies actually match your ICP.
Bottom-up market sizing requires real company counts - not guesswork. Prospeo's B2B database lets you filter 300M+ profiles by industry, headcount, revenue, technographics, and 30+ other criteria to validate exactly how many companies match your ICP.
Turn your SAM from a spreadsheet guess into a verified number.
How Market Sizing Drives GTM Decisions
Most guides stop at the math. The whole point is making better decisions with the output.
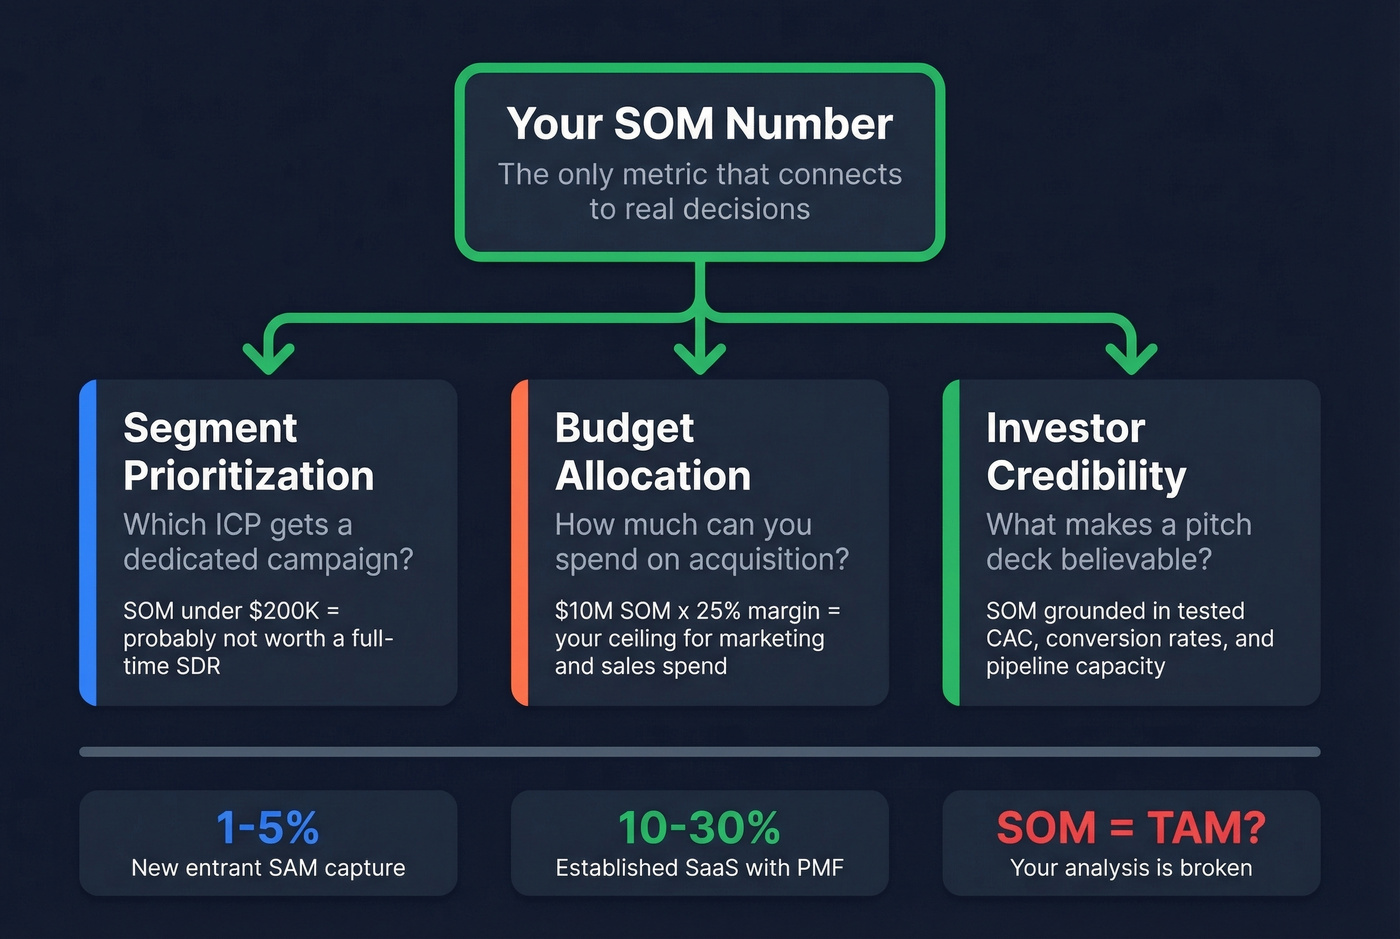
Segment prioritization. You've got three potential ICPs. SOM tells you which one has enough reachable revenue to justify a dedicated campaign, content strategy, and sales motion. If the SOM for a segment is $200K, it probably doesn't warrant a full-time SDR.
Budget allocation. SOM determines how much you can afford to spend on acquisition. A $10M SOM with a 25% gross margin gives you a ceiling for total marketing and sales investment in that segment. Blow past that ceiling and you're subsidizing growth with cash you don't have.
Investor credibility. SOM grounded in tested acquisition assumptions - CAC, conversion rates, pipeline capacity - is what makes a pitch deck believable. Investors have seen enough inflated TAM slides to last a lifetime.
Here are some benchmarks to sanity-check your numbers: new market entrants typically capture 1-5% of SAM. Established SaaS companies with strong product-market fit can target 10-30% of a well-defined SOM. If your SOM equals your TAM, your analysis is broken.
Here's the thing: if your average deal size is under $5K and your SOM is under $500K, you don't need a market sizing exercise. You need more conversations with actual buyers. Market sizing becomes valuable when the numbers are large enough to force tradeoffs between segments. Below that threshold, just sell.
Mistakes That Destroy Your Sizing
Over-relying on top-down alone. Industry reports set boundaries. They don't validate whether your product fits the market they describe. Always combine with bottom-up.
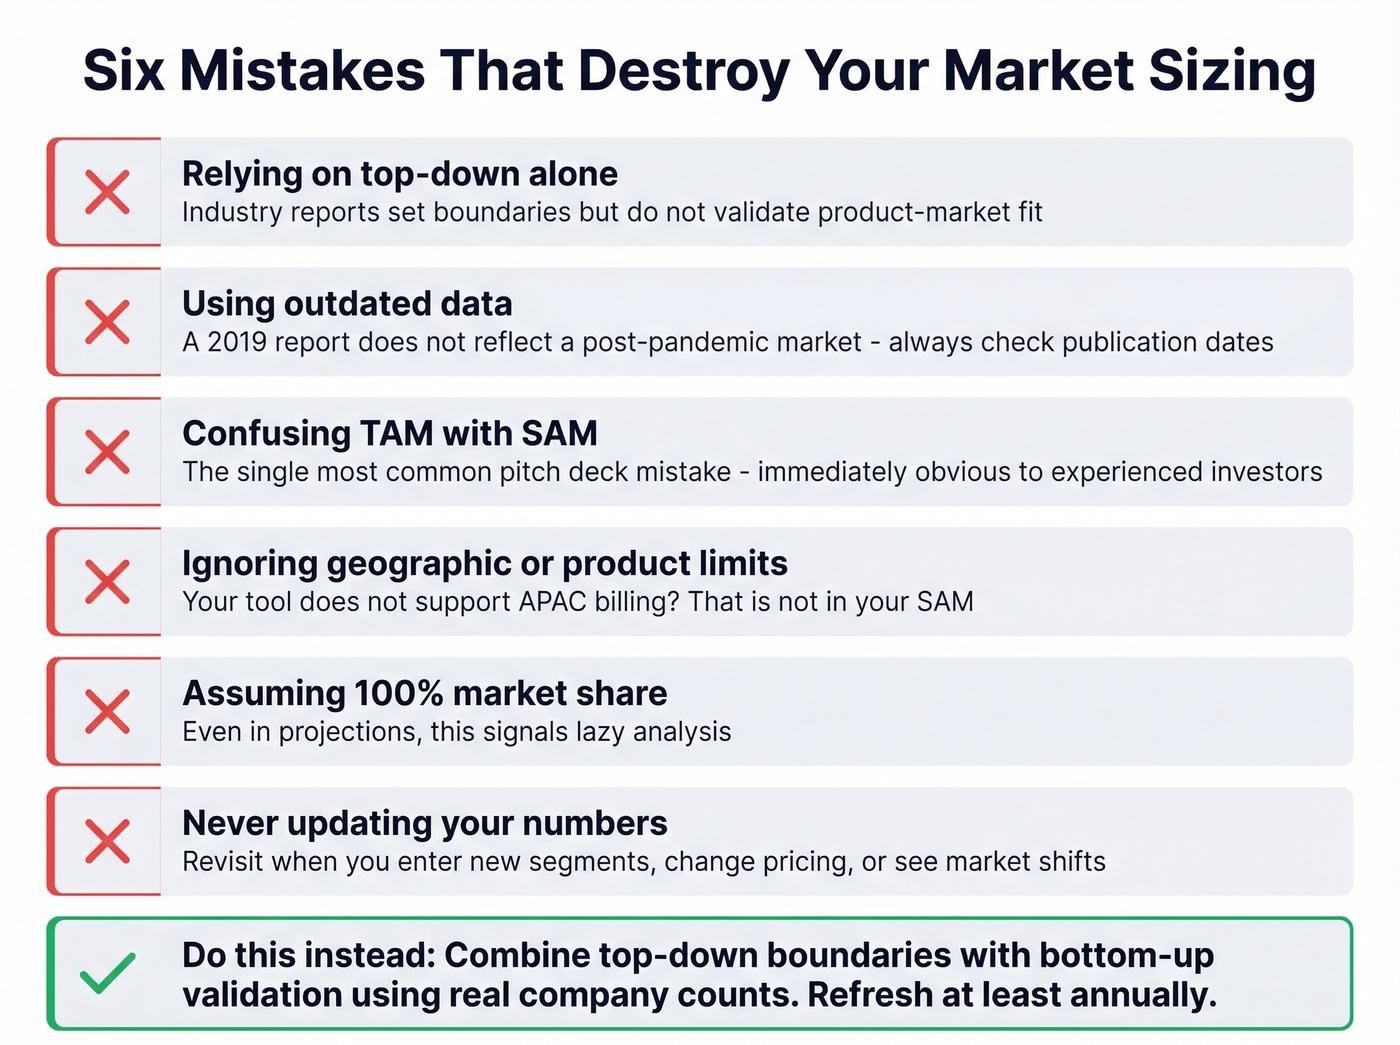
Using outdated data. A 2019 report doesn't reflect a post-pandemic market. Check publication dates - we've caught team members citing pre-COVID numbers as recently as last quarter.
Confusing TAM with SAM. Treating total addressable market and serviceable addressable market as interchangeable is the fastest way to inflate your numbers and lose credibility with investors and leadership alike. Let's be honest: this is the single most common mistake we see in pitch decks, and it's immediately obvious to anyone who's reviewed more than a dozen of them.
Ignoring geographic or product limits. Your tool doesn't support APAC billing? That's not in your SAM.
Assuming 100% market share. Even in projections, this signals lazy analysis. Skip this fantasy.
Never updating. Revisit when you enter new segments, change pricing, or see market shifts. TAM SAM SOM figures are living numbers, not pitch deck artifacts you set once and forget.
Validate With Real Prospect Data
Paper-based market sizing is a hypothesis. The fastest way to kill a bad assumption is to count real companies.
If your bottom-up model says 10,000 companies match your ICP, verify that number against an actual database. We ran this exercise for a client targeting mid-market fintech companies in North America - their desk research said 8,000 companies, but filtering by actual headcount, revenue range, and tech stack brought the real count to 3,200. That single correction reshaped their entire SOM and saved them from over-hiring an SDR team they couldn't keep busy.
Prospeo lets you filter by industry, headcount, and revenue across 300M+ professional profiles, so you can see whether your assumptions hold before committing budget. Layer in intent data tracking 15,000 topics to identify which of those companies are actively researching solutions in your category. That distinction changes your entire SOM calculation and every budget decision downstream.

Once you've sized your SOM, you need verified contact data to actually reach those buyers. Prospeo delivers 98% email accuracy at $0.01/lead with a 7-day data refresh - so your outbound campaigns hit real inboxes, not dead ends.
Go from market sizing to booked meetings without switching tools.
FAQ
What's a good SOM percentage?
For new entrants, 1-5% of SAM is realistic in year one. Established SaaS companies with strong product-market fit can target 10-30% of a well-defined serviceable obtainable market. If your SOM equals your TAM, go back and tighten your assumptions.
How often should you recalculate?
At minimum, annually. Revisit whenever you enter a new segment, change pricing, or see significant market shifts. These aren't numbers you carve into stone.
Which sizing method do investors prefer?
Bottom-up. Investors trust sizing grounded in real customer counts and tested ACV assumptions over top-down industry reports alone. Use top-down for boundaries, bottom-up to validate - presenting both shows rigor.
Can you do TAM SAM SOM without paid reports?
Yes. The US Census Bureau, BLS, SEC filings, and a B2B data platform for company counts will get you a defensible bottom-up model. Paid reports from Gartner or IBISWorld help with top-down framing, but they aren't strictly necessary for early-stage sizing.