Total Accessible Market: Definition, Formulas, and How to Actually Use It
Every guide on total accessible market quietly redirects you to "total addressable market" - as if they're the same thing. They're not always. The difference between "accessible" and "addressable" can change how you build your pitch deck, size your opportunity, and plan your entire GTM motion.
What You Need (Quick Version)
"Total accessible market" isn't a standardized term. It gets used three different ways in practice:
- As a synonym for TAM - the entire market demand for your product or service
- As a synonym for SAM - the segment you can realistically serve given geography, compliance, and ICP constraints
- As a distinct, constraint-based subset - the portion of TAM you can actually reach given regulatory, technological, or channel limitations
For context, the standard framework:
- TAM (Total Addressable Market) = theoretical revenue ceiling if you had 100% market share
- SAM (Serviceable Addressable Market (SAM)) = the slice you can realistically target
- SOM (Serviceable Obtainable Market (SOM)) = what you can actually win given competition and capacity
If you already know which definition your audience expects, skip to the calculation methods. If you need to turn market sizing into a real prospect list, jump to the operational section.
Accessible Market vs. Addressable Market
Let's untangle this. Nordark's glossary explicitly differentiates between TAM as the entire market potential and the total accessible market as the portion reachable by a specific company - constrained by regulations, technological limitations, or channel reach. Under this interpretation, your accessible market is always smaller than your addressable market.
But then you'll find examples like the one in Profit.co's OKR guide, which states: "There's a huge difference between an estimated total addressable market of $162M and a total accessible market of $6.4bn." That's the accessible market framed as larger than the addressable one - which contradicts the constraint-based interpretation entirely.
This isn't a niche inconsistency. It's the norm.
| Total Addressable Market (TAM) | Total Accessible Market | Serviceable Addressable Market (SAM) | |
|---|---|---|---|
| Definition | Total demand if 100% share | Varies by context | Reachable given constraints |
| Scope | Entire market | TAM, SAM, or subset | Narrower than TAM |
| Common usage | Universal in VC/strategy | Informal, inconsistent | Standard in frameworks |
| Standardized? | Yes | No | Yes |
| Our recommendation | Use for ceiling estimates | Avoid in formal contexts | Use for GTM planning |
Three Interpretations in Practice
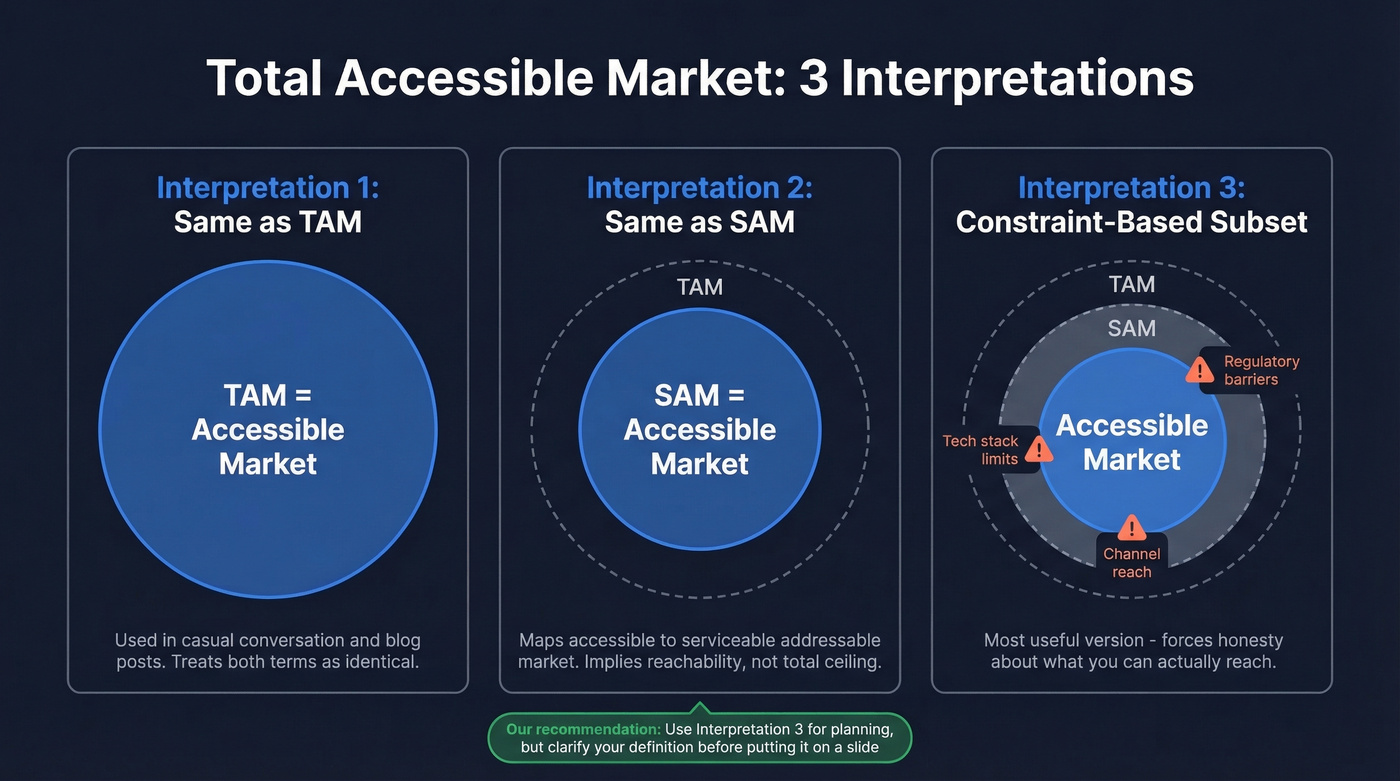
The first interpretation treats "accessible" as a straight synonym for "addressable." You'll see this in blog posts, pitch decks, and casual conversation. No harm done - as long as everyone in the room agrees on the definition.
The second interpretation maps "accessible" to SAM. This makes linguistic sense: SAM is the serviceable addressable market, and "accessible" implies reachability. When someone says "our accessible market is $200M," they often mean the segment they can actually serve - not the theoretical ceiling.
The third interpretation - and the most useful one - treats accessible market as a distinct constraint layer. Your TAM might be $5B, but regulatory barriers in three key markets, a product that only works on one tech stack, and a sales team that only speaks English might shrink your accessible opportunity to $800M. This version forces you to be honest about what you can actually reach.
Why the Confusion Matters
In a pitch deck, ambiguity around "accessible" vs. "addressable" creates real risk. If your investor reads "accessible market" as SAM and you meant TAM, you've just undersold your opportunity. Flip it, and you've inflated the number - experienced VCs will catch that in the Q&A.
Internally, the confusion is worse. Your VP of Sales hears "$2B accessible market" and thinks that's the pond they're fishing in. Your product team hears the same number and assumes it includes markets you haven't localized for. Align on terminology before you put numbers on a slide.
TAM, SAM, and SOM Explained
TAM is the theoretical ceiling - every dollar you'd capture if you had zero competition, infinite resources, and a product that served every possible buyer. It's useful for showing investors the scale of the opportunity, but it's not a planning number. Nobody captures 100% of their TAM.
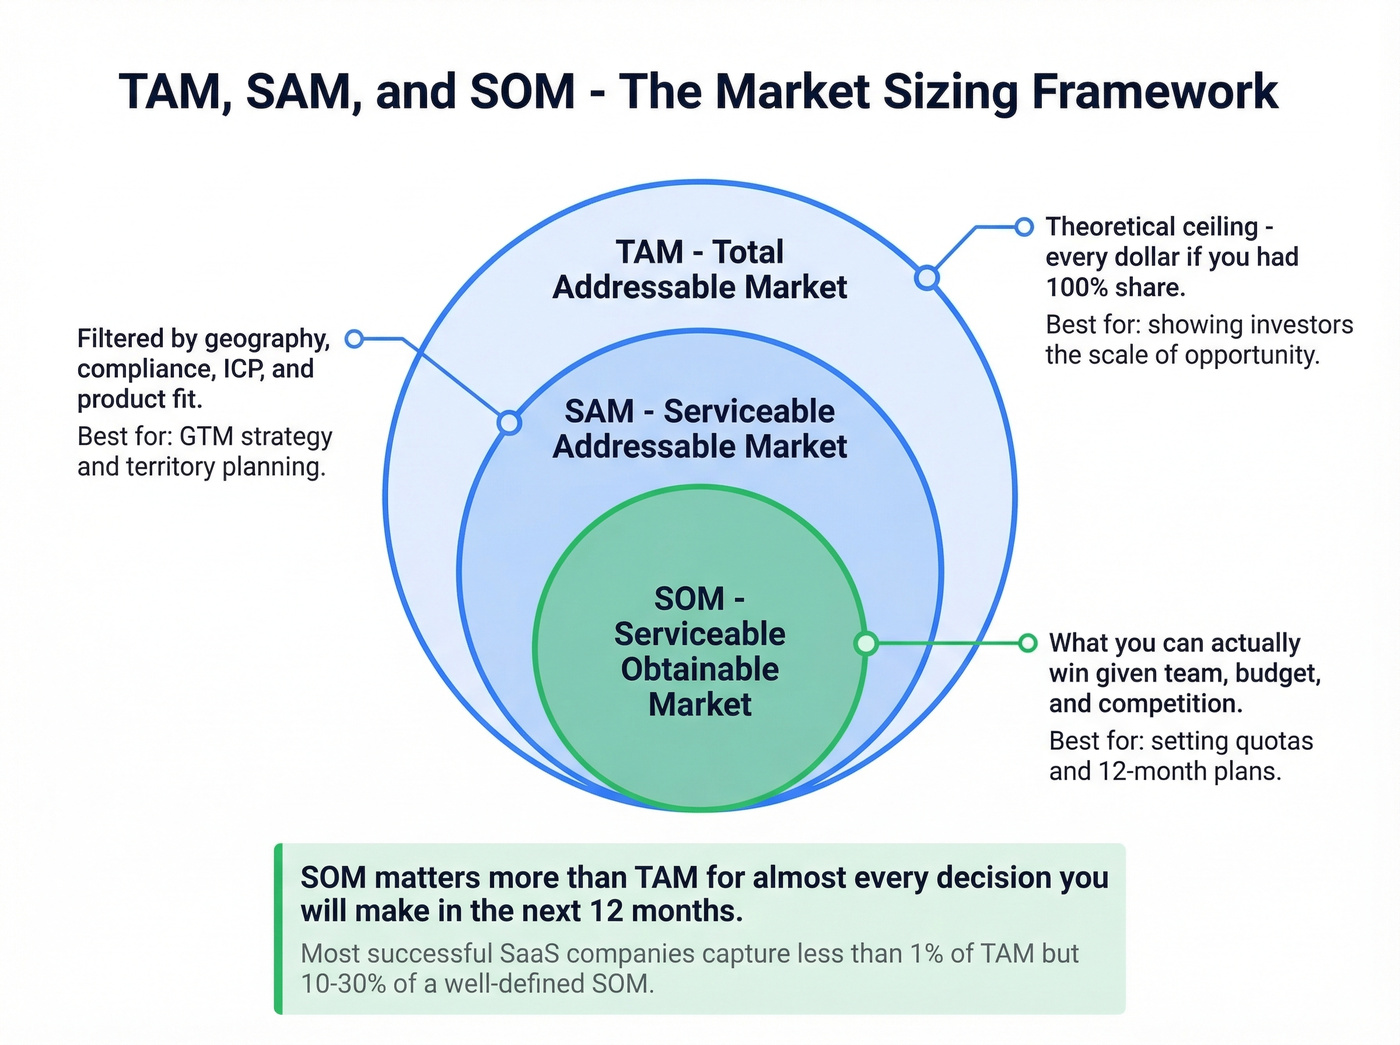
SAM narrows the lens. It's the portion of TAM you can realistically serve given your geography, compliance requirements, ICP, and product capabilities. If your SaaS tool only works for companies running Salesforce, your SAM excludes every HubSpot-only shop. This is where strategy starts to get honest.
SOM is the number that actually matters for execution. It's what you can win in a defined time horizon, given your current team, budget, competitive landscape, and GTM motion. The Business Plan Shop frames it well: SOM and SAM de-risk the investment, while TAM shows the upside at scale.
Here's the thing most guides won't tell you: SOM matters more than TAM for almost every decision you'll make in the next 12 months. TAM impresses board decks. SOM sets quotas, sizes territories, and determines whether your sales team can actually hit plan. A common SaaS rule-of-thumb is that most successful SaaS companies capture less than 1% of their TAM but can capture 10-30% of a well-defined SOM. We've seen teams waste entire quarters chasing segments that looked great in their TAM slide but were never realistically reachable. If you only have time to get one number right, make it SOM.
How to Calculate TAM (3 Methods)
Three methods, each with a different tradeoff between speed and accuracy. The goal isn't decimal-point precision - it's order-of-magnitude accuracy. As Silverman puts it, a $10M miss often won't matter, but $100M+ can change your strategy.
Top-Down Approach
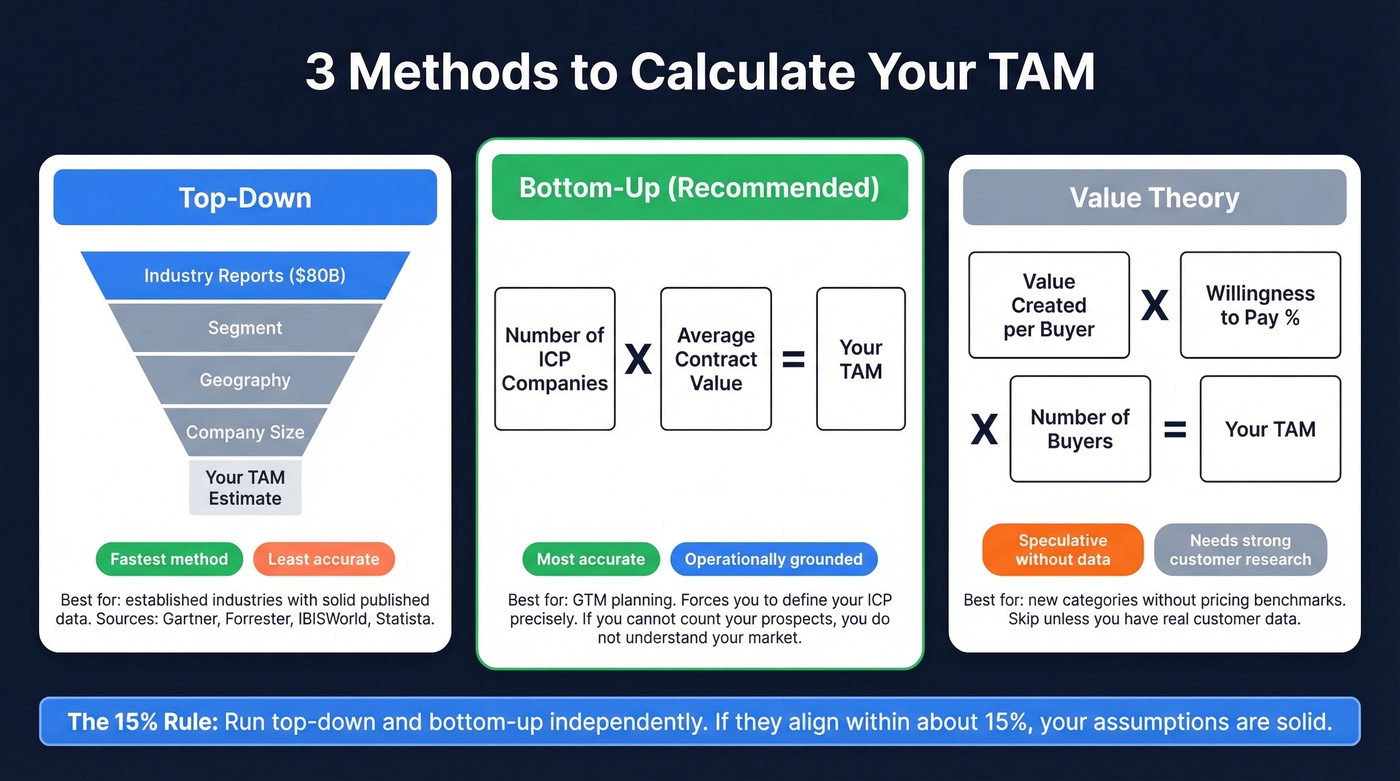
Start with industry-level data from research firms like Gartner, Forrester, IBISWorld, or Statista and narrow by segments. The global CRM market is $80B? Great - now cut it by your target segment, geography, and company size.
Top-down is the fastest method and the least accurate. It works best for established industries with solid published data. For niche or emerging markets, the available reports won't slice the data the way you need, and you'll end up making assumptions on top of assumptions.
Bottom-Up Approach
Count real prospects, multiply by revenue per customer. How many companies match your ICP? What's your average contract value? Multiply.
Bottom-up is more involved but operationally grounded - and it's the only method that matters for GTM planning. It forces you to define your ICP precisely, which is a feature, not a bug. If you can't count your prospects, you don't understand your market well enough to sell into it. As Pear VC's Ian Taylor puts it: "Ideally you will only use top-down to sanity check the magnitude of your bottom-up estimate."
Value Theory Approach
Estimate the value your product creates for buyers, then estimate their willingness to pay. If your tool saves a sales team 10 hours per week and that time is worth $50/hour, the value created is $26,000/year per team. Your TAM becomes the number of eligible teams multiplied by a fraction of that value.
This method depends heavily on pricing data confidence. If you're pre-revenue or entering a new category without established pricing benchmarks, it gets speculative fast. Skip this one unless you have strong customer research to back it up.
Validate With Both (The 15% Rule)
Run top-down and bottom-up independently. A common heuristic: if they align within ~15%, your assumptions are solid. If the gap is wider, dig into why before you put the number on a slide. The divergence usually points to a flawed assumption in one method - and finding it before your investor does is the whole point.
Your bottom-up TAM calculation is only as good as your prospect data. Prospeo gives you 300M+ verified profiles with 30+ filters - buyer intent, technographics, headcount growth, funding - so you can count real ICP-matched companies, not estimates from stale industry reports.
Turn your TAM slide into a target list with 98% accurate contact data.
Worked Example: SaaS Market Sizing
Forget the coffee shop and lemonade stand examples that dominate every other guide. Let's use a realistic SaaS scenario, adapted from Topo.io's framework.
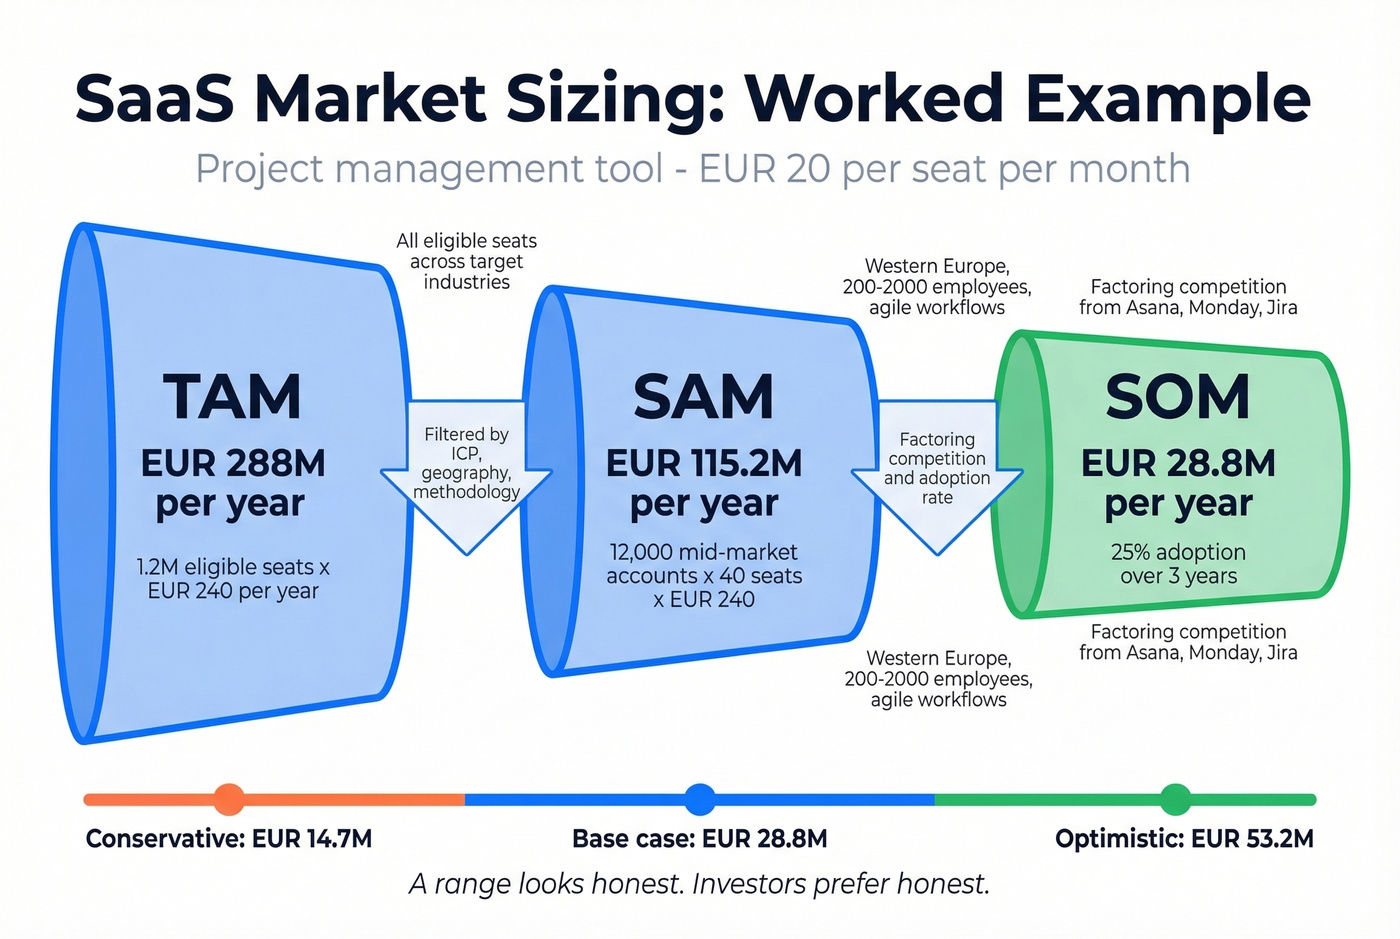
You're building a project management tool priced at EUR 20/seat/month, which works out to a EUR 240 ACV per seat. Your research identifies 1.2 million eligible seats across your target industries and company sizes.
TAM: 1.2M seats x EUR 240/year = EUR 288M/year
Now narrow to SAM. Your ICP is mid-market companies with 200-2,000 employees in Western Europe running agile development workflows. That's roughly 12,000 accounts averaging 40 seats each.
SAM: 12,000 accounts x 40 seats x EUR 240/year = EUR 115.2M/year
For SOM, assume 25% adoption within your ICP over the next 3 years, factoring in competition from Asana, Monday, and Jira.
SOM: EUR 115.2M x 25% = EUR 28.8M/year
Now stress-test it. What if seats per account are +/-20%? What if your price point shifts +/-10%? What if adoption ranges from 20% to 35%?
| Scenario | Seats/Account | Price/Seat/Year | Adoption | SOM |
|---|---|---|---|---|
| Conservative | 32 | EUR 216 | 20% | EUR 14.7M |
| Base case | 40 | EUR 240 | 25% | EUR 28.8M |
| Optimistic | 48 | EUR 264 | 35% | EUR 53.2M |
That range - EUR 14.7M to EUR 53.2M - is what you present. A single number looks precise. A range looks honest. Investors prefer honest.
How Investors Evaluate Market Sizing
Market sizing is one of the fastest ways to win or lose investor confidence. If your TAM/SAM/SOM don't hold up, the rest of your pitch deck starts to wobble.
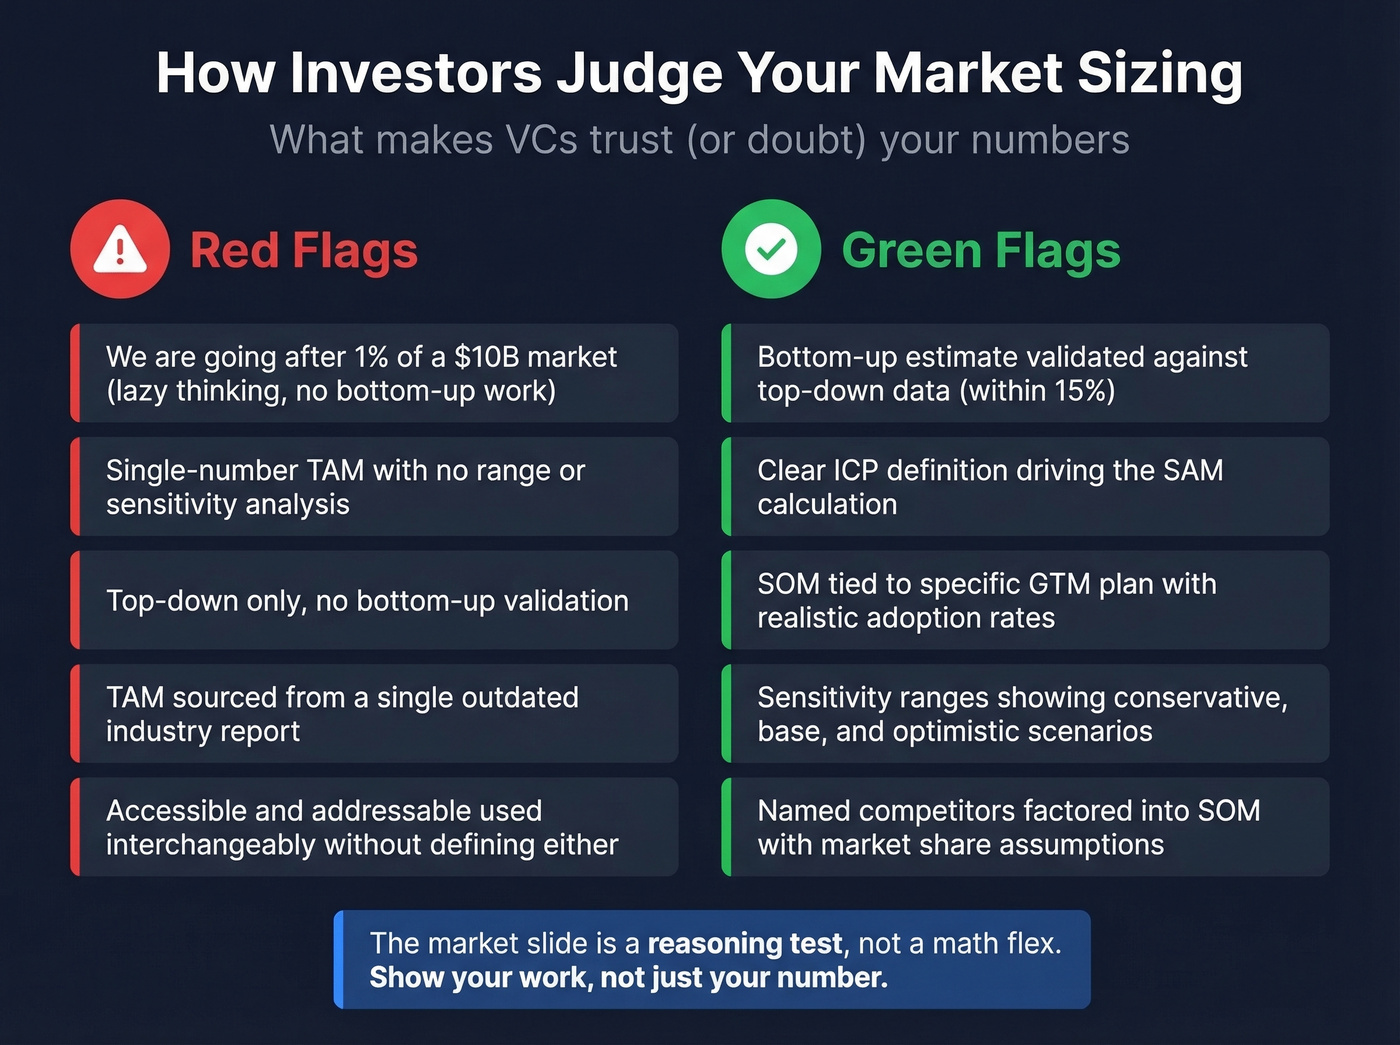
VCs use each layer as a filter. TAM answers "could this be a billion-dollar market?" SAM answers "does this team's product and GTM actually address a meaningful slice?" SOM answers "can they execute in the next 18-24 months with the capital we're providing?"
The classic red flag: "We're going after 1% of a $10B market." Investors have seen this slide a thousand times, and it signals lazy thinking. It implies you haven't done the bottom-up work to understand which 1% and how you'll capture it. As seobrien.com argues, the market slide is a reasoning test, not a math flex.
On r/startups, pre-seed founders regularly ask whether investors want big TAM numbers or realistic ones. The answer is both: a big TAM that shows the opportunity ceiling, paired with a defensible SOM that proves you've done the work. In our experience working with SaaS founders, the ones who lead with SOM get funded faster because they demonstrate execution clarity, not just ambition.
Lead with SOM in your pitch. Show the logical staircase: here's what we can win now, here's what opens up with capital (SAM), and here's the long-term ceiling if we expand into adjacent segments (TAM). That narrative - grounded in execution reality and expanding toward ambition - is what gets checks written. With around $125B invested in software venture capital globally in 2024 (about +28.8% vs. 2023), the capital is there. The question is whether your market sizing earns it.
Look, presenting TAM or SAM and implying it's SOM is one of the most common mistakes in pitch decks. Don't be that founder.
From TAM to Target List
Here's the gap nobody talks about. You've sized your market at $200M. Your SAM is $60M. Your SOM is $15M. Now what?
That $15M SOM tells your VP of Sales nothing about how many companies to call, which contacts to reach, or how to divide territories. The jump from "market opportunity" to "operational prospect list" is where most teams stall - they've got a beautiful TAM slide and zero idea how to turn it into pipeline.
This is where market sizing becomes a sales planning exercise. Your SOM implies a number of target accounts. Those accounts have decision-makers. Those decision-makers have emails and phone numbers. The chain from TAM to territory plan to quota to daily activity only works if you can identify and verify the people inside your target segments.
Once you've defined your ICP - industry, headcount range, tech stack, funding stage - tools like Prospeo let you pull verified contacts using 30+ search filters, then layer in buyer intent data across 15,000 topics to prioritize accounts actively researching solutions like yours. You go from "our SOM is $15M across 3,000 accounts" to a sorted, verified contact list in an afternoon. (If you want a repeatable workflow, see Clay list building.)

Going from TAM to SOM means knowing exactly who you can reach. Prospeo's database lets you filter by geography, tech stack, company size, and intent signals across 15,000 topics - so your accessible market isn't a guess, it's a verified list refreshed every 7 days.
Start with 75 free verified emails and see your real accessible market.
TAM Mistakes That Kill Strategy
Most TAM slides are fiction. Not because founders are dishonest, but because the methodology is sloppy. I've seen an AI-driven CRM startup inflate their TAM by relying solely on top-down analysis and ignoring competitive crowding. The result: high CAC, missed quotas, and investors who stopped returning calls.
Here are the seven mistakes that show up repeatedly.
1. Using only top-down analysis. Industry reports give you a starting point, not an answer. Without bottom-up validation, you're guessing at your own market position.
2. Ignoring competition. Your TAM isn't the whole market - it's the market minus what competitors already own. If three incumbents hold 70% share, your realistic opportunity is dramatically smaller.
3. Treating TAM as static. Markets expand, contract, and shift. A TAM calculated two years ago is probably 30% wrong today. Revisit annually at minimum.
4. Conflating TAM with revenue or SOM. TAM is a ceiling, not a forecast. If your financial projections assume you'll capture 40% of TAM in year three, investors will laugh you out of the room. A thread on r/venturecapital put it bluntly: "If your SOM equals your TAM, you haven't done the work."
5. Not defining your ICP. "All mid-market companies" isn't an ICP. Without specificity on industry, tech stack, headcount, and buying behavior, your SAM is meaningless. Use a simple ICP template and score it.
6. Using outdated data. A 2022 Gartner report doesn't reflect 2026 market dynamics. Stale inputs produce stale outputs.
7. Skipping sensitivity analysis. A single-point estimate looks confident but fragile. Show the range. Show what breaks your model. That's what separates a pitch from a plan.
Tools and Resources
You don't need to build your TAM model from scratch. HubSpot offers a free market size calculator with five templates covering TAM, SAM, and SOM - a solid starting point for teams that want structure without cost.
For industry data, syndicated research from Gartner, Forrester, and IBISWorld runs $2K-$10K+ per report. Government sources like the US Census Bureau and Bureau of Labor Statistics are free and surprisingly useful for bottom-up company counts.
For teams that need to go beyond sizing and actually build a contact list from their ICP definition, Prospeo covers 143M+ verified emails and 125M+ mobile numbers with a 7-day refresh cycle and intent data across 15,000 topics. Free tier available, no contracts. If you're evaluating vendors, start with a quick scan of B2B company data providers and data enrichment services.
FAQ
Is total accessible market the same as TAM?
Not necessarily. "Total accessible market" isn't standardized and gets used three ways: as a TAM synonym, as a SAM equivalent, or as a distinct constraint-based subset of TAM. Before using it in a pitch deck, clarify which definition your audience expects. When in doubt, stick with the standard TAM/SAM/SOM framework - it's what investors know.
How do you calculate your market size?
Run both top-down and bottom-up methods in parallel. Top-down starts with published industry data and narrows by segment; bottom-up counts real prospects and multiplies by average contract value. If the two estimates align within roughly 15%, your assumptions are solid. See the calculation section above for a step-by-step walkthrough.
What TAM do investors expect?
$1B+ is the typical VC threshold for venture-scale returns, but methodology matters more than magnitude. A defensible bottom-up approach with clear ICP definition and realistic SAM/SOM will impress investors far more than a massive top-down number with no supporting logic.
How often should you revisit market sizing?
At least annually, or whenever you enter a new segment, change pricing, or shift your ICP. Markets move - new competitors enter, regulations change, buyer behavior evolves. A static TAM slide from a prior fundraise loses credibility fast.
How do you turn a TAM into a prospect list?
Define your ICP filters - industry, headcount, tech stack, funding stage - then use a B2B data platform to find and verify contacts within those segments. Layer in intent data to prioritize accounts actively in-market, and export verified emails and direct dials into your sequencer or CRM. The faster you close the gap between "addressable" and "contacted," the faster you build pipeline.