The Best Total Addressable Market Databases in 2026
Most TAM numbers in investor decks come from a Gartner report someone skimmed and a spreadsheet no one audited. The hard part isn't the formula - it's finding a reliable total addressable market database to plug real numbers into.
Here's what actually works, from zero budget to enterprise contracts.
What Is a TAM Database?
A total addressable market database is any structured data source you use to count and size the companies or people who could buy your product. That ranges from free government datasets with aggregate establishment counts by industry and geography, all the way to paid B2B platforms with company-level records and verified contacts.
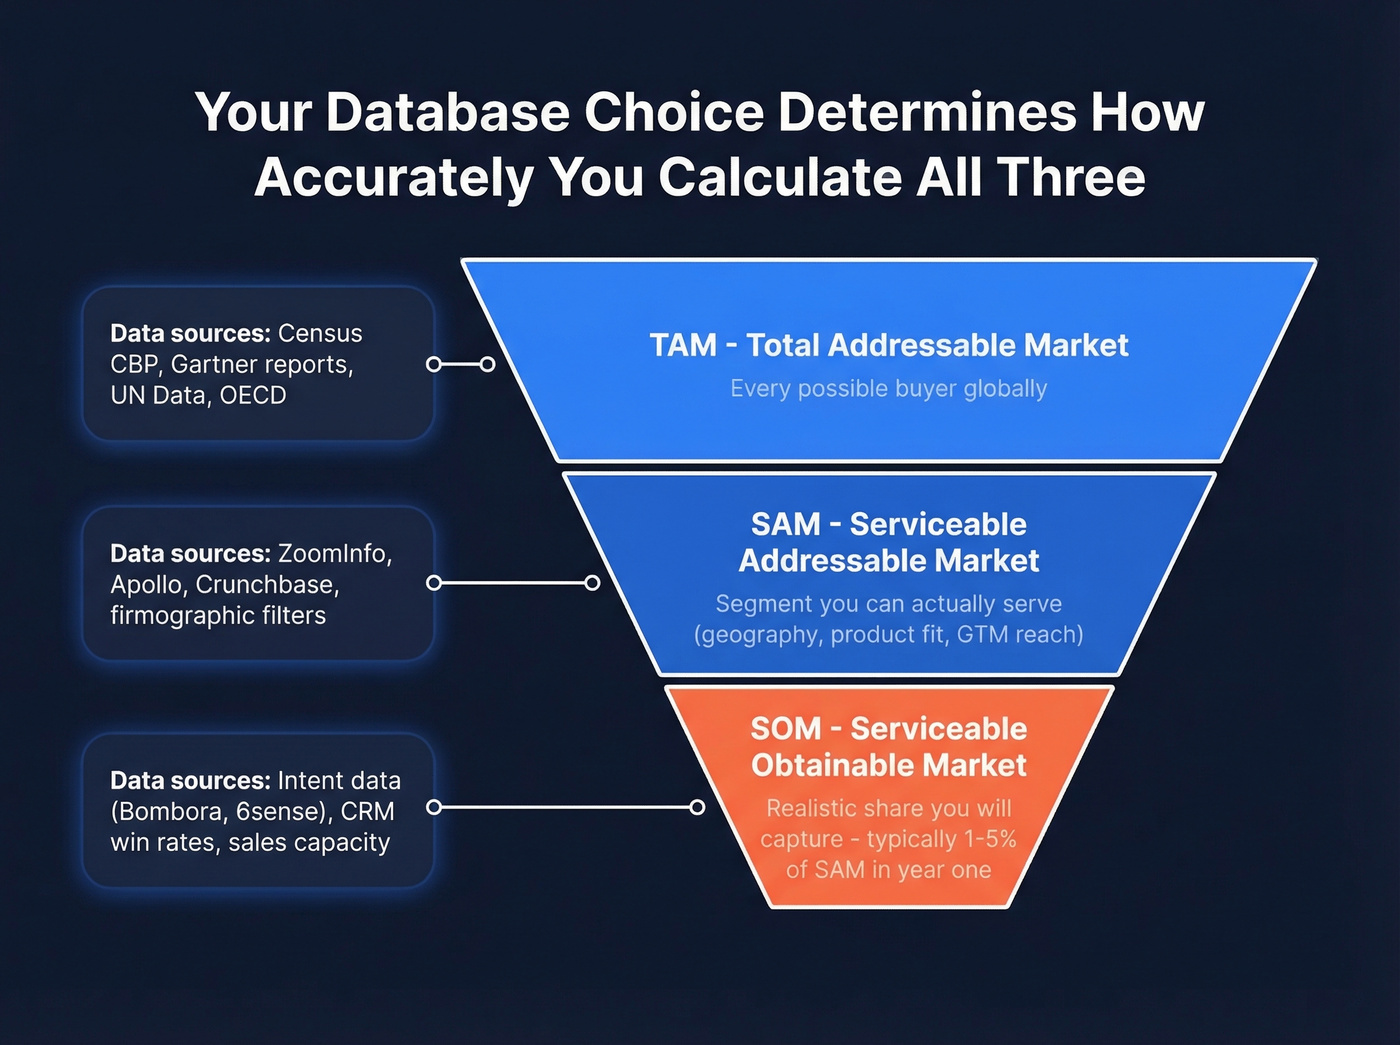
Quick refresher on the acronyms: TAM is total market demand, SAM is the slice you can actually serve, and SOM is what you'll realistically capture. Your database choice determines how accurately you calculate all three - and ultimately, how defensible your market share assumptions are when someone pushes back on them.
What You Need
- Free baseline: The US Census Bureau's County Business Patterns gives establishment counts by industry and geography - completely free.
- Enterprise all-in-one: ZoomInfo if you've got $15k+/year and need TAM sizing and outbound in one platform.
Free TAM Data Sources
You don't need a $30k database to calculate your TAM. We've seen teams build credible bottom-up models using nothing but CBP establishment counts and BLS employment data, then validate against a paid database later. The Census Bureau and a few other public sources get you surprisingly far.
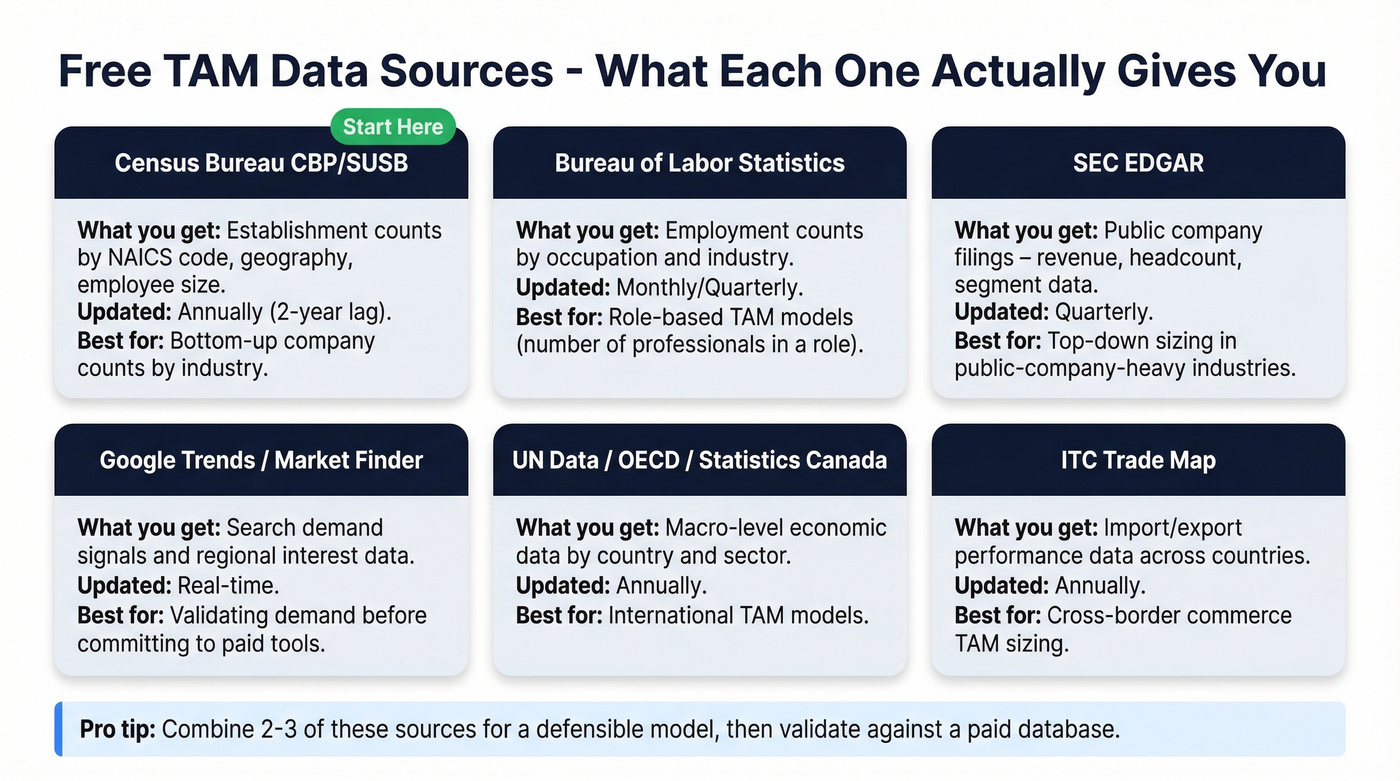
Census Bureau CBP/SUSB is the backbone. It provides establishment counts by NAICS code, geography, and employee size - free, updated annually, though data runs about two years behind. Pair it with Bureau of Labor Statistics employment counts by occupation, which are essential when your TAM is "number of professionals in a role" rather than "number of companies."
SEC EDGAR gives you public company filings with revenue, headcount, and segment data. Useful for top-down sizing in industries dominated by public players. Google Trends and Google Market Finder help validate demand signals and regional interest before you commit to a paid platform.
For international models, UN Data, OECD, and Statistics Canada provide macro-level economic data. And if your TAM involves cross-border commerce, the ITC Trade Map tracks import/export performance data across countries.
Combining multiple data sources - free and paid - is how you build a defensible model instead of a guess.
Stop paying for bounced emails. Prospeo verifies every contact with 98% accuracy, refreshed every 7 days.
Start free and only pay for verified contacts
Paid B2B Databases for TAM
Free sources give you counts. Paid databases give you company-level records you can act on - names, emails, firmographics. The best total addressable market software goes further, letting you filter, score, and export directly into your outreach stack.
| Tool | Coverage | Starting Price | Best For | Data Refresh |
|---|---|---|---|---|
| Prospeo | 300M+ profiles, 143M+ emails | Free (75 emails/mo) | Verified contacts + TAM lists | 7 days |
| ZoomInfo | 500M+ contacts, 100M+ cos | ~$15k+/yr | Enterprise TAM + outbound | Not public |
| Apollo | 275M+ contacts | Free (1,200 credits/mo) | SMB prospecting | Not public |
| Crunchbase | Startup/VC focus | $49/mo (annual) | Startup TAM sizing | Not public |
| D&B | Global firmographics | $49/mo (300 credits) | Legacy enterprise data | Not public |
| BuiltWith | Technographic data | $295/mo (annual) | Tech-stack TAM | Not public |
| PitchBook | PE/VC deal data | ~$20k-$50k+/yr | Investor-grade sizing | Not public |
ZoomInfo is the heavyweight. Paid plans start around $15k/year and climb past $40k once you add intent data, extra credits, and global coverage. Sales teams consistently flag the renewal process as a pain point - watch for multi-year contracts with 60-90 day auto-renewal windows. Miss the cancellation window and you're locked in for another year. The consensus on r/sales is that you should negotiate hard and never accept the first quote.
Apollo's free plan with 1,200 credits/month is generous for early-stage teams. Crunchbase is the go-to for startup-heavy markets. BuiltWith is niche but powerful if your TAM is defined by technology adoption - skip it if you're sizing a market that isn't tech-dependent.
Here's the thing: ZoomInfo is still the most comprehensive all-in-one platform. But most teams doing TAM analysis don't need all-in-one. They need accurate counts and verified contacts. If your average deal size sits below $15k, you almost certainly don't need a $40k data contract to size your market.
How to Build a TAM Model
- Define your ICP criteria. Industry, revenue range, headcount, geography, and any technographic signals. Be specific - "SaaS companies" isn't an ICP.
- Map to NAICS codes. Find the 6-digit codes matching your target industry using the Census Bureau's NAICS guide.
- Pull baseline counts. Use Census CBP or SUSB for establishment counts by NAICS code and geography. This is your raw universe.
- Enrich with a B2B database. Filter by firmographics - revenue, headcount, tech stack - to get company-level detail and turn aggregate counts into a real list.
- Score and rank accounts. Prioritize by firmographic match, tech stack alignment, and buying signals so your sales team focuses on the highest-value segments first.
- Segment and calculate. Break companies into size tiers, apply your ACV per segment, and multiply.
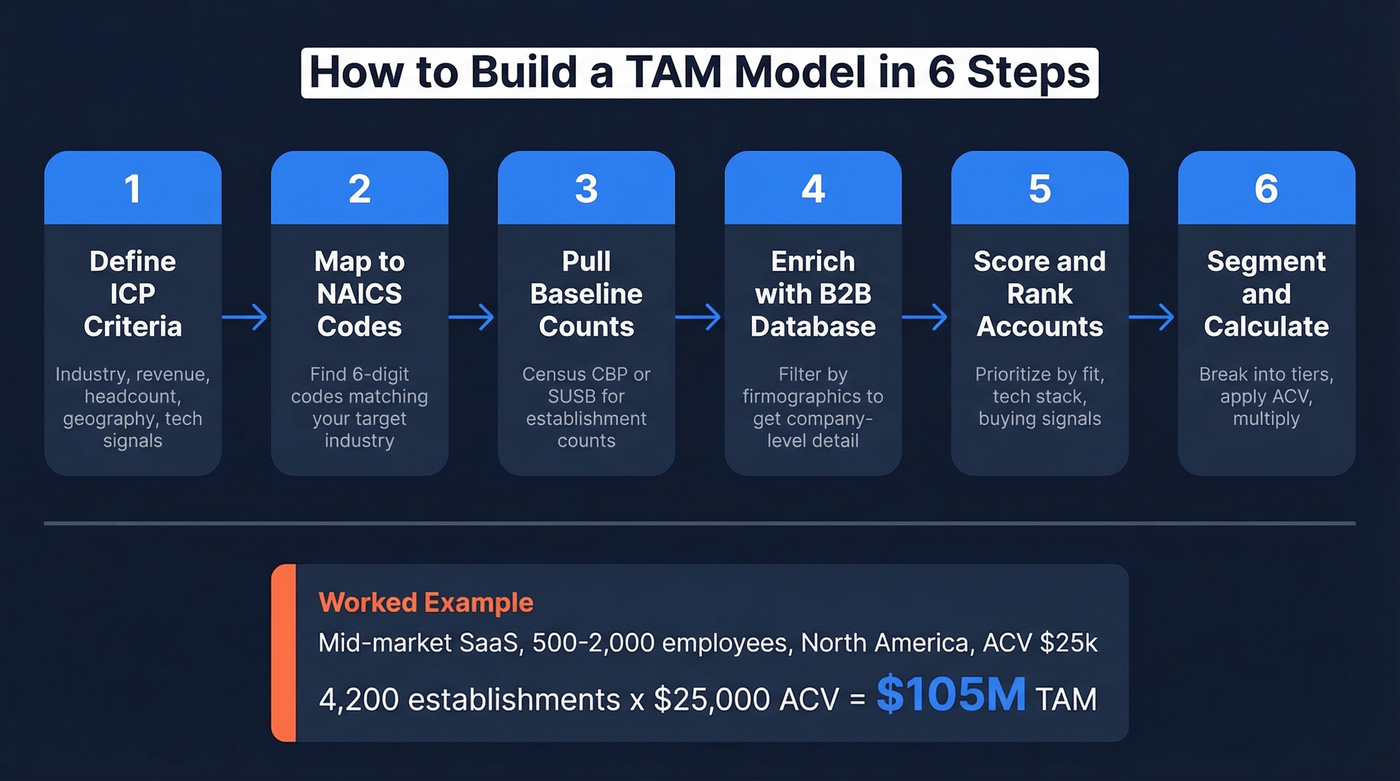
Worked example: You sell to mid-market SaaS companies with 500-2,000 employees in North America and your ACV is $25k. Census CBP shows 4,200 establishments matching that NAICS code and size range. Your bottom-up TAM: 4,200 x $25,000 = $105M. Slice that by geography or tech stack for your SAM.
For enterprise teams, ZoomInfo offers a Snowflake-based variant of this workflow - useful if you're running TAM analysis at scale, overkill for everyone else.
TAM Mistakes to Avoid
Over-relying on top-down estimates. Gartner says the market is $50B - that's not your TAM. Combine top-down with bottom-up validation.
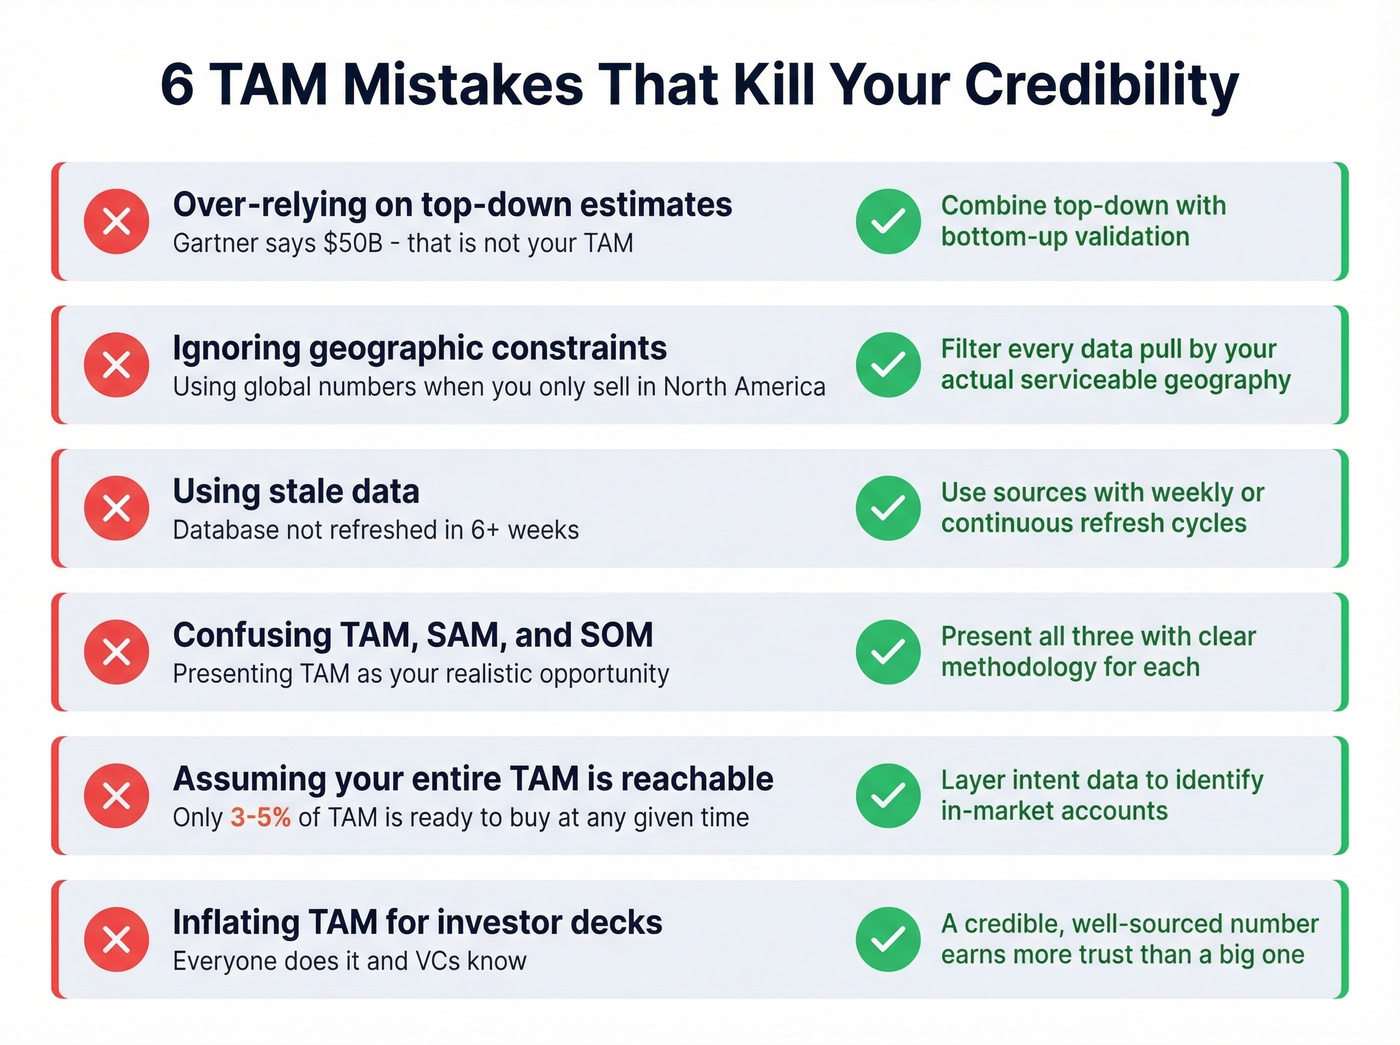
Ignoring geographic constraints. If you only sell in North America, your TAM isn't global. Filter every data pull by your actual serviceable geography.
Using stale data. If your database hasn't refreshed in 6+ weeks, your numbers are already drifting. Use sources with weekly or continuous refresh cycles. In our experience, even a one-quarter lag introduces enough noise to throw off SAM calculations by double digits.
Confusing TAM, SAM, and SOM. Investors notice when you present TAM as your realistic opportunity. Present all three with clear methodology for each. (If you need a clean definition set, start with TAM, SAM, and SOM.)
Assuming your entire TAM is reachable. Research consistently shows the percentage of TAM ready to buy at any given time is roughly 3-5%. The rest need nurturing or aren't in-market yet. Layer intent data to identify in-market accounts and focus outbound there.
Inflating TAM for investor decks. Everyone does it. VCs know. A credible, well-sourced number earns more trust than a big one with no methodology behind it.
From TAM to Sales-Ready Lists
A TAM number is just a number. It doesn't book meetings.
The gap between "our TAM is $105M" and "here are 4,200 companies we can actually reach" is where most teams stall, and it's genuinely frustrating to watch a solid sizing exercise die in a spreadsheet because nobody built the bridge to outbound. Effective total addressable market sales prep means turning your sizing model into segmented, prioritized prospect lists before a single rep picks up the phone.

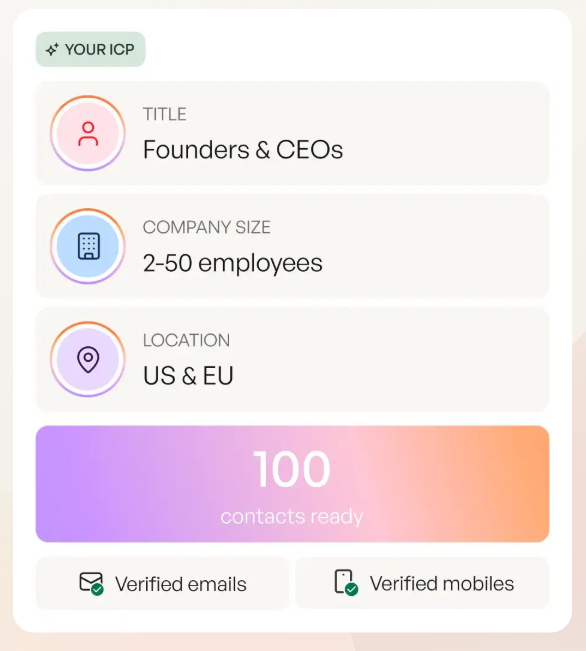
Prospeo's 30+ search filters match your ICP criteria directly - industry, headcount, revenue, tech stack, buyer intent across 15,000 topics - with a 7-day data refresh so the list reflects current reality. Intent data surfaces accounts actively researching solutions like yours, so reps spend time on buyers, not bystanders. Export verified emails and mobile numbers, push them straight to your CRM or sequencer, and go from TAM model to live outreach in a single workflow. (If you're building lists across multiple sources, data enrichment helps keep records consistent.)
Let's be honest: the whole point of sizing your market is to sell into it. Don't let the analysis become the deliverable.
Your outbound is only as good as your data. With 300M+ profiles and verified emails at ~$0.01 each, Prospeo keeps your pipeline full.
Try it free - no credit card required
FAQ
What's the best free TAM database?
Census Bureau's County Business Patterns gives free establishment counts by NAICS code and geography - it's the strongest public foundation for bottom-up sizing. Layer in BLS employment data for role-specific models and validate against SEC EDGAR for public-company revenue benchmarks.
How often should I refresh TAM data?
At least quarterly. Companies close, merge, and pivot faster than most teams realize. Prospeo refreshes records every 7 days; the industry average is 6 weeks. Stale data inflates your TAM with companies that no longer match your ICP.
What's the difference between TAM, SAM, and SOM?
TAM is every possible buyer globally. SAM is the segment you can actually serve given geography, product fit, and go-to-market reach. SOM is the realistic share you'll capture given competition and sales capacity - typically 1-5% of SAM in year one.
How do I find in-market accounts within my TAM?
Combine your TAM database with intent data. Platforms like Bombora and 6sense track buying signals - content consumption, keyword research, competitor visits - to flag accounts actively evaluating solutions in your category. You can also layer intent signals with firmographic filters to prioritize outbound by both fit and timing.