How to Track Sales in Excel (2026 Guide + Formulas)
It's the last Friday of the month. Your manager pings you for pipeline numbers. You open the spreadsheet, scroll through 200 rows of inconsistent data - some reps typed "Closed Won," others wrote "closed," one just left the cell blank - and you realize that tracking sales in Excel without a proper structure is a recipe for chaos.
Stop downloading random templates. In about 30 minutes, you can build a sales tracker that'll outperform most pre-built ones floating around because it'll match your sales process. Let's build it.
What You Need Before You Start
Five things separate a functional sales tracking spreadsheet from a mess:
- Format as Table (Ctrl+T). Dynamic ranges, auto-extending formulas, structured references. Non-negotiable.
- A "Lists" sheet with Data Validation dropdowns. This prevents reps from typing "Qualified" five different ways.
- Learn SUMIFS. It's the single most important formula for real sales tracking.
- Conditional formatting for at-a-glance status. Green for won, red for lost, yellow for open.
- Verified contact data before it enters the tracker. Garbage in, garbage out - and that applies to email addresses as much as deal stages.
Which Tracker Type Do You Actually Need?
Not every tracker is a pipeline tracker. Figure out which type matches your workflow before building anything.
| Tracker Type | Best For | Complexity | Build Time |
|---|---|---|---|
| Pipeline/Forecasting | Deals through stages | Medium | 30 min |
| Activity Tracking | Calls, emails, meetings | Low | 15 min |
| Outreach/Email | Cold outreach campaigns | Medium | 20 min |
| Performance Improvement | Individual rep development | Medium | 30 min |
| Management/Coaching | Comparing rep metrics | Medium-High | 45 min |
| Compensation Planning | Commission calculations | High | 60 min |
If you build one thing, build a pipeline tracker. If you build two, add a dashboard tab that pulls KPIs from the pipeline data. Those two cover most of what sales managers actually need from a spreadsheet.
Build Your Sales Tracker Step by Step
We're building a pipeline tracker with a dashboard - a setup that works especially well for teams of one to six reps.
Set Up Your Data Table
Open a blank workbook. In cell A1, type your first column header. Use this schema:
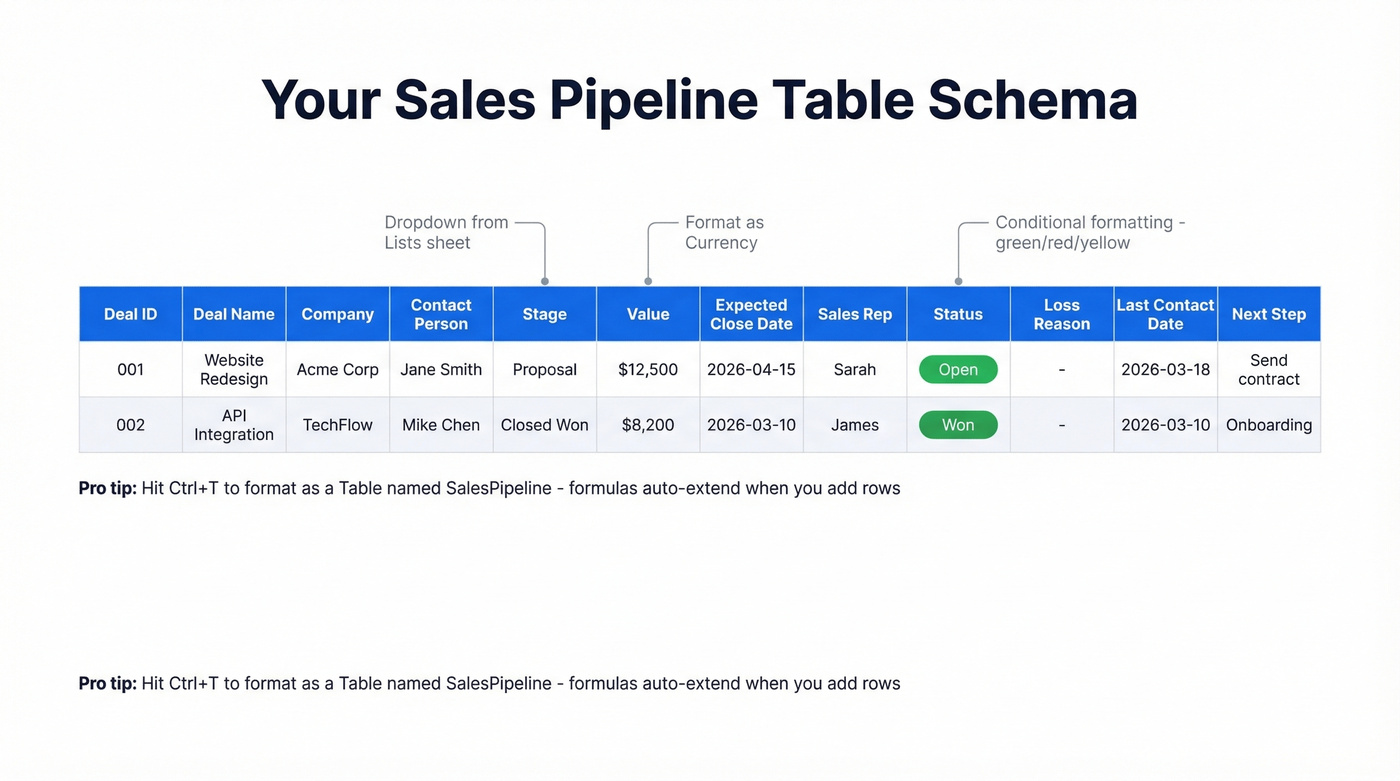
Deal ID | Deal Name | Company | Contact Person | Stage | Value | Expected Close Date | Sales Rep | Status | Loss Reason | Last Contact Date | Next Step
Select your header row and hit Ctrl+T to format as a table. Name it "SalesPipeline" in the Table Design tab. Structured references like SalesPipeline[Value] make every formula readable and auto-extending - when you add a new row, your formulas and charts update automatically.
Set your data types: Value as Currency, dates as Date, Deal ID as Number. This prevents sorting nightmares later.
Create Dropdowns for Clean Data
Create a new sheet called "Lists." In column A, list your deal stages (Prospecting, Qualified, Proposal, Negotiation, Closed Won, Closed Lost). Column B: statuses (Open, Won, Lost). Column C: your reps. Column D: loss reasons (Price, Timing, Competitor, No Decision, Feature Gap).
Back on your main sheet, select the Stage column, go to Data > Data Validation > List, and point the source to your Lists sheet. Repeat for Status, Sales Rep, and Loss Reason. This single step eliminates the number-one problem in sales trackers: inconsistent data entry across reps.
When a rep leaves, update the Lists sheet but don't delete their name, or you'll break historical data. New hire? Just add them to the list.
Add Conditional Formatting
Select the Status column. Add three rules:
- Text that contains "Won" - green fill
- Text that contains "Lost" - red fill
- Text that contains "Open" - yellow fill
For overdue follow-ups, select the Expected Close Date column and add a rule: Format only cells that contain > Cell Value > less than > =TODAY() with red text. Now any deal past its expected close date screams at you.
Pro tip: seed your template with placeholder dates like =TODAY()-30 and =TODAY()+7 so the conditional formatting is visible the moment someone opens the file.
Build Your KPI Formulas
On a new tab called "Dashboard," set up these four formulas. Copy-paste them directly.
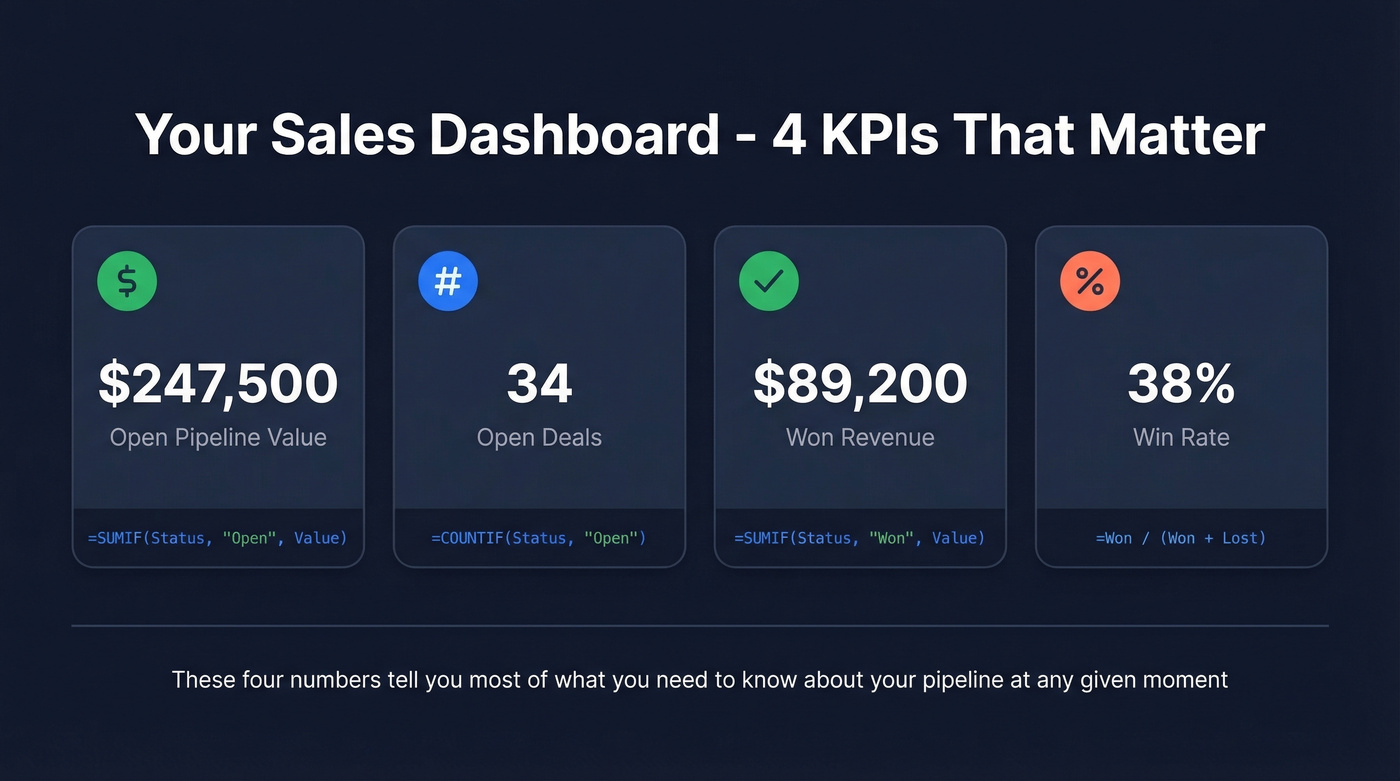
Pipeline value (open deals):
=SUMIF(SalesPipeline[Status], "Open", SalesPipeline[Value])
Number of open deals:
=COUNTIF(SalesPipeline[Status], "Open")
Won revenue:
=SUMIF(SalesPipeline[Status], "Won", SalesPipeline[Value])
Win rate:
=COUNTIF(SalesPipeline[Status],"Won")/(COUNTIF(SalesPipeline[Status],"Won")+COUNTIF(SalesPipeline[Status],"Lost"))
Format the win rate cell as a percentage. These four numbers tell you most of what you need to know about your pipeline at any given moment.
Add a Dashboard for Sales Reports
With your KPI cells in place, add three charts:
- Bar chart for pipeline value by stage (pivot table source, grouped by Stage, summing Value)
- Pie chart for win/loss distribution (Won vs Lost counts)
- Line chart for monthly revenue trend (group by Expected Close Date month)
Connect a slicer for Sales Rep so you can filter the entire dashboard by rep with one click. This matches what we've seen sales managers describe on r/excel: they need daily, weekly, and monthly reporting views across five or six reps, all from one workbook. Once your dashboard is set up, generating sales reports takes seconds instead of hours.
Essential Formulas for Sales Tracking
SUMIFS is the workhorse. Here are the patterns you'll actually use.
Revenue by rep for a specific stage:
=SUMIFS(SalesPipeline[Value], SalesPipeline[Sales Rep], "Sarah", SalesPipeline[Stage], "Negotiation")
Q1 revenue using date windows:
=SUMIFS(SalesPipeline[Value], SalesPipeline[Expected Close Date], ">=" & DATE(2026,1,1), SalesPipeline[Expected Close Date], "<=" & DATE(2026,3,31))
Am-I-on-track pacing formula - inspired by a freelancer's r/excel question about an $18,900 monthly goal and wanting to know if their daily pace would hit it:
=IF(SUM(SalesPipeline[Value])/MAX(DAY(TODAY())-1,1)*DAY(EOMONTH(TODAY(),0)) >= 18900, "On Track", "Behind")
Replace 18900 with a cell reference to your target. The MAX(DAY(TODAY())-1,1) prevents a #DIV/0! error on the first of the month. This formula extrapolates your current daily average across the remaining days - simple, but surprisingly useful when your manager asks "are we going to hit quota?" mid-month.
Pipeline velocity - the metric that ties everything together:
=COUNTIF(SalesPipeline[Status],"Open") * (Win_Rate * Avg_Deal_Size) / Avg_Sales_Cycle_Days
Pipeline velocity is a per-day throughput metric: how much revenue you can expect to move through your pipeline based on volume, win rate, deal size, and cycle length. If you track only one advanced metric, make it this one (and if you want the deeper math, see deal velocity).
Look up deal details by ID:
=XLOOKUP(A2, SalesPipeline[Deal ID], SalesPipeline[Company])
You just built a pipeline tracker - now fill it with data that won't break it. Prospeo gives you 300M+ profiles with 98% email accuracy, so every row in your spreadsheet connects to a real buyer. No bounces, no blanks, no garbage data.
Stop tracking dead leads. Start with verified contacts at $0.01 each.
Mistakes That Break Your Tracker
Five problems kill sales trackers over and over. We've seen every one of them in the wild.
Inconsistent product or deal names. Reps type "Enterprise Plan," "enterprise," "Ent. Plan" - and your SUMIFS returns three different numbers. Fix: Data Validation dropdowns from your Lists sheet. Force selection, prevent free-text.
No rep attribution. If you can't filter by rep, you can't coach. Add a Sales Rep column with validation tied to your Lists sheet.
Ignoring returns and refunds. Your "Won Revenue" number is overstated if you don't account for churn. Add a Returns column and a Net Value column with this row formula: =[@Value]-[@Returns]. Then update your dashboard revenue formulas to sum SalesPipeline[Net Value] instead of SalesPipeline[Value].
Vague goals with no variance tracking. "Sell more" isn't a goal. Create a Targets sheet with monthly targets per rep, then add a variance formula: =Actual - Target. Conditional format negative variances in red so underperformance is visible before the quarter ends, not after (more on setting targets in quota management).
Not tracking why you lose deals. This is the mistake almost everyone makes, and it's the most expensive one. Add a Loss Reason column with validation (Price, Timing, Competitor, No Decision, Feature Gap) and build a pivot chart on your Dashboard tab to spot patterns. If "Price" dominates, that's a positioning problem, not a sales problem. It's one of the most actionable columns you can add to any tracker.
Stale contact data. Here's the thing - if emails in your tracker are invalid, your pipeline value becomes fiction and your reps waste sequences on dead addresses. Verify emails before they enter the spreadsheet, not after you've built forecasts on top of them. Tools like Prospeo validate emails at 98% accuracy with a 7-day refresh cycle, so contacts entering your tracker stay current.
Excel Data Analysis for Larger Pipelines
When your tracker exceeds 1,000 rows and basic formulas start lagging, it's time to restructure.
Import your data via Data > Get Data > From File > From Text/CSV. In the Power Query Editor, set data types, remove duplicates, and add calculated columns. Then use Close & Load To > Only Create Connection + Add this data to the Data Model.
In Power Pivot, create relationships between tables (e.g., Sales[RepID] to Reps[RepID]) and build DAX measures:
Total Revenue := SUM(Sales[Revenue])
Profit Margin := DIVIDE([Total Profit], [Total Revenue], 0)
Add slicers and timelines connected to multiple pivot tables via Report Connections. Your dashboard now filters across every chart simultaneously. For automated refresh, a one-line VBA macro handles it:
Sub RefreshData()
    ThisWorkbook.RefreshAll
End Sub
Assign it to a button or run it on workbook open. This setup handles tens of thousands of rows far better than formula-heavy workbooks, and it's where Excel starts to feel like a real analytics tool rather than a glorified list.
When Excel Stops Being Enough
Excel is genuinely great for sales tracking - until it isn't. Watch for these signals:
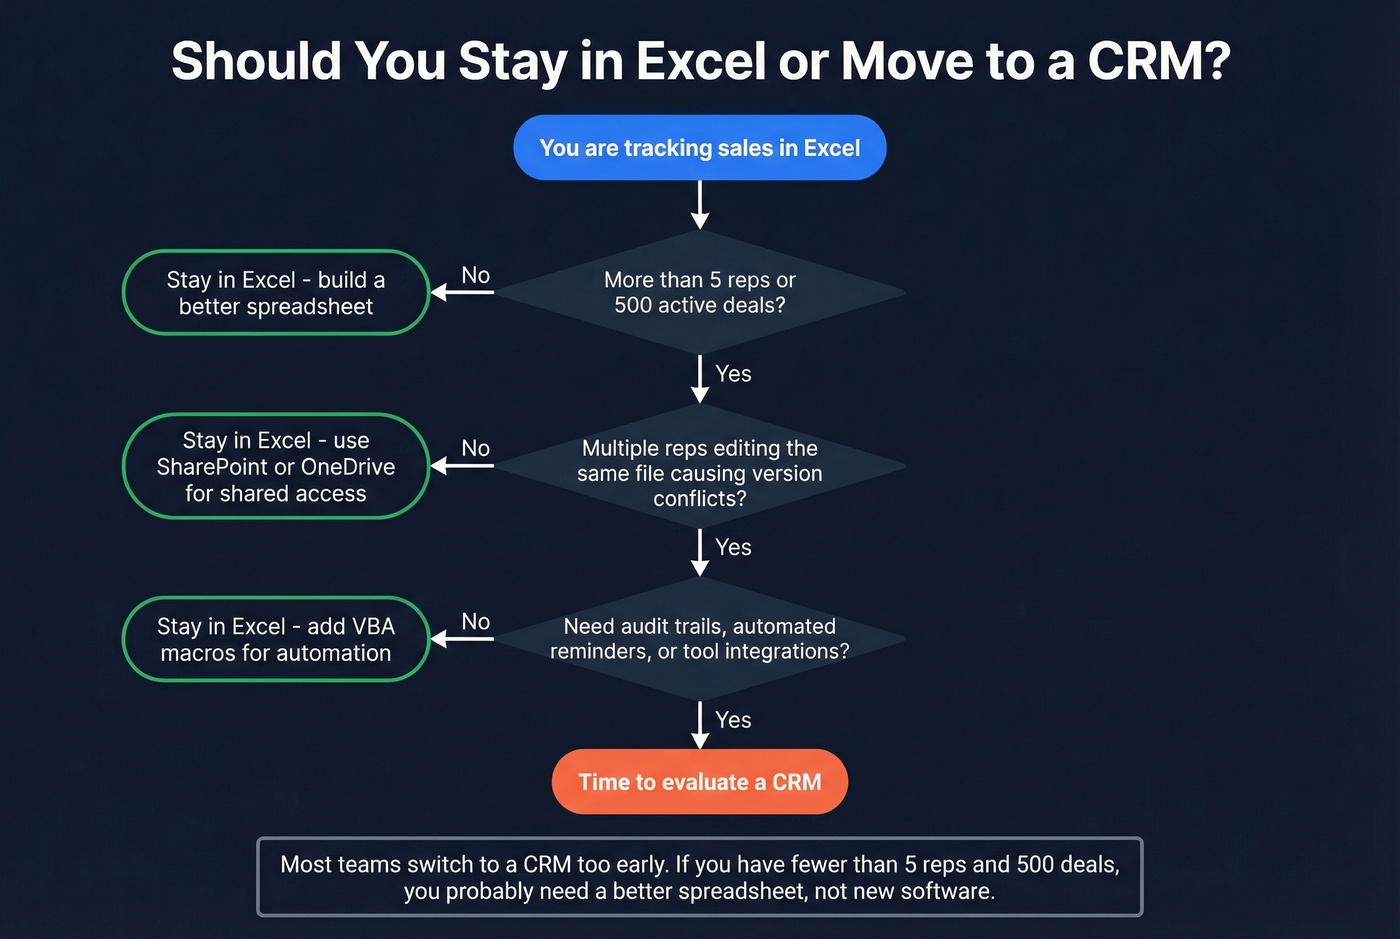
- You're manually updating statuses, sending follow-up reminders, and copying data between sheets every day
- Multiple reps editing the same file creates version conflicts and overwritten data
- You need audit trails that worksheet protection can't provide
- Integrations with email, phone, and marketing tools require manual export/import cycles
Let's be honest: you don't need a CRM if you have fewer than five reps and fewer than 500 active deals. You need a better spreadsheet. Most teams switch to a CRM too early, then spend six months configuring it to do what their spreadsheet already did. The Reddit sentiment backs this up - users on r/sales regularly complain that CRMs become "glorified spreadsheets" without a clear workflow driving them (if you're evaluating the switch, start with CRM analytics for sales).
Skip the CRM search if you're under those thresholds. When you genuinely outgrow Excel, HubSpot's free CRM ($0) is the right first step, with Salesforce Starter ($25/user/mo) for teams that need deeper customization.
Data Quality Makes or Breaks Everything
A perfectly built tracker with bad contact data is just a pretty spreadsheet full of lies.
I've seen teams spend hours building gorgeous dashboards only to realize half their pipeline is built on bounced emails and disconnected phone numbers. The formulas don't matter if the underlying data is wrong. Before any contact enters your tracker, verify the email is deliverable and the phone number is real. That one step protects every formula, chart, and forecast you build on top of it (and if you're cleaning lists, an email address verifier is the fastest fix).

Garbage in, garbage out applies to contact data too. Prospeo's 5-step verification and 7-day data refresh mean the emails and phones in your tracker actually work - teams see bounce rates drop from 35% to under 4%.
Your formulas are perfect. Make your contact data match.
FAQ
Can I use Google Sheets instead of Excel?
Yes. Google Sheets supports SUMIFS, COUNTIF, conditional formatting, and data validation - everything this guide covers. It lacks Power Query and Power Pivot, but you gain real-time collaboration without version conflicts. For solo users or teams under five reps, either platform works. Google's Sheets documentation covers the formula syntax differences.
How many deals can Excel handle before it slows down?
Standard Excel handles 5,000-10,000 rows with formulas comfortably. Beyond that, switch to Power Query and the Data Model. Avoid volatile functions like INDIRECT and OFFSET on large datasets - they recalculate on every change and will grind your workbook to a halt.
What's the fastest way to keep contact data accurate?
Verify emails before importing them into your tracker. Real-time validation catches dead addresses before they inflate your pipeline numbers, and regular refresh cycles prevent records from going stale between pipeline reviews. Hunter and NeverBounce offer verification as well, though they lack the built-in enrichment that fills missing fields automatically.