What Does KPI Stand For? Meaning & Examples (2026)
Only 30% of surveyed managers feel their teams understand the difference between leading and lagging indicators. That single gap - confusing "numbers we track" with "numbers that drive decisions" - is where most measurement programs fall apart. If you've ever asked what KPI stands for and gotten a vague answer about "tracking stuff," this guide fixes that for good.
KPI Stands for Key Performance Indicator
KPI stands for Key Performance Indicator - a quantifiable measure of progress toward a specific strategic objective. Revenue growth rate, customer churn, pipeline velocity: these qualify as KPIs because they connect directly to strategic goals. Page views alone? That's a metric, not a KPI.
The word "key" does the heavy lifting. Every business generates hundreds of data points. A KPI is the small subset that actually changes how you allocate time, money, or people. If a number can move without triggering a decision, it's background noise.
72% of organizations cite aligning KPIs to strategic objectives as crucial for performance management. Yet most teams still confuse activity metrics with performance indicators - and that mismatch explains why dashboards get ignored.
KPI vs. Metric vs. OKR
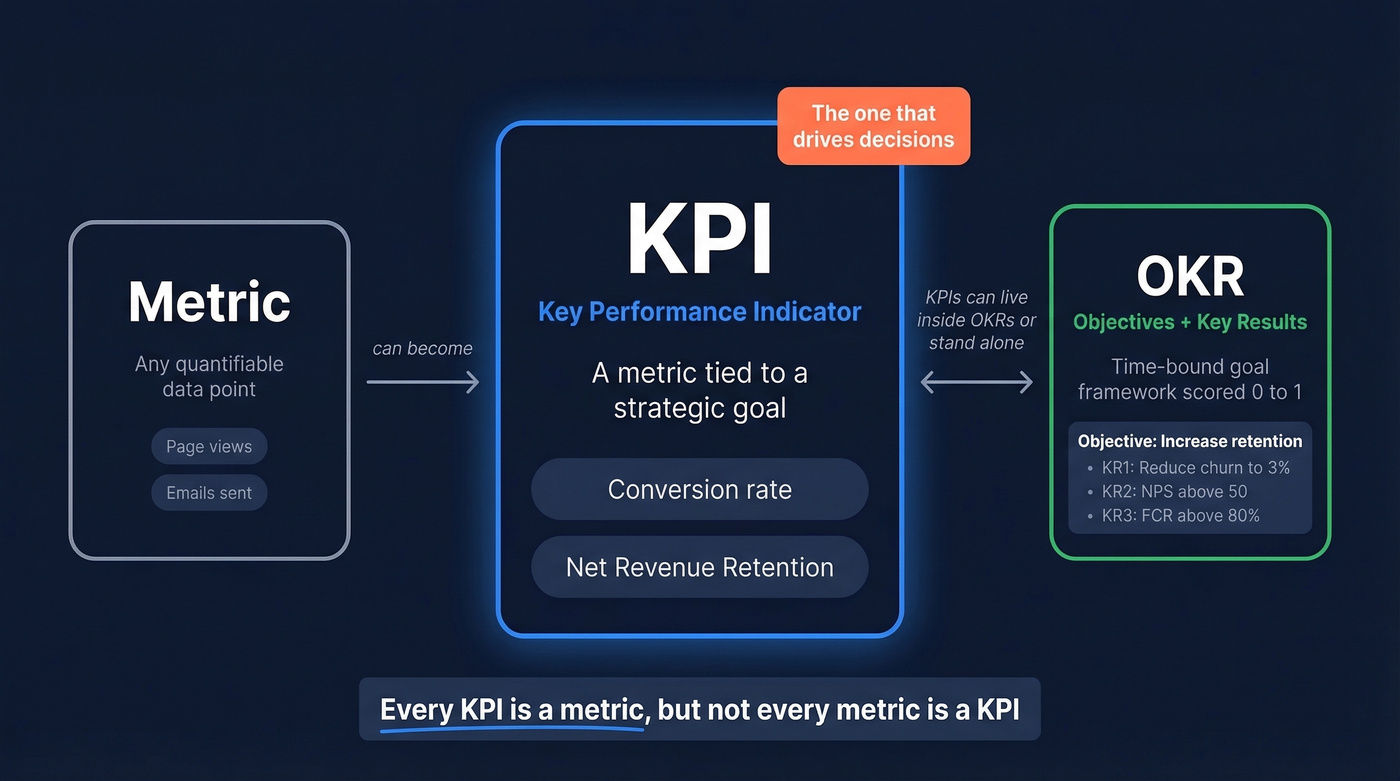
These three terms get swapped constantly, and it causes real confusion. Comparing KPIs and OKRs is like comparing apples and oranges - an OKR is a strategic framework, while a KPI is a measurement that can live inside that framework or outside it entirely.
| Concept | What It Is | Example |
|---|---|---|
| Metric | Any quantifiable data point | Page views, emails sent |
| KPI | A metric tied to a strategic goal | Conversion rate, NRR |
| OKR | Goal + measurable results framework | "Increase retention" + 3 key results scored 0-1 |
Every KPI is a metric, but not every metric qualifies as a key performance indicator. That distinction matters more than most teams realize.
OKRs have specific structural rules: up to 3 objectives, 3-5 key results per objective, each scored on a 0-1 or 0-100 scale, bound to a deadline, and deliberately ambitious. KPIs, by contrast, are ongoing measurements. OKRs are time-bound sprints; KPIs are the instruments you read throughout the flight.
Can KPIs be qualitative? Technically yes. Practically, don't bother. If you can't measure something objectively and consistently, it isn't a useful performance indicator.
Types of KPIs
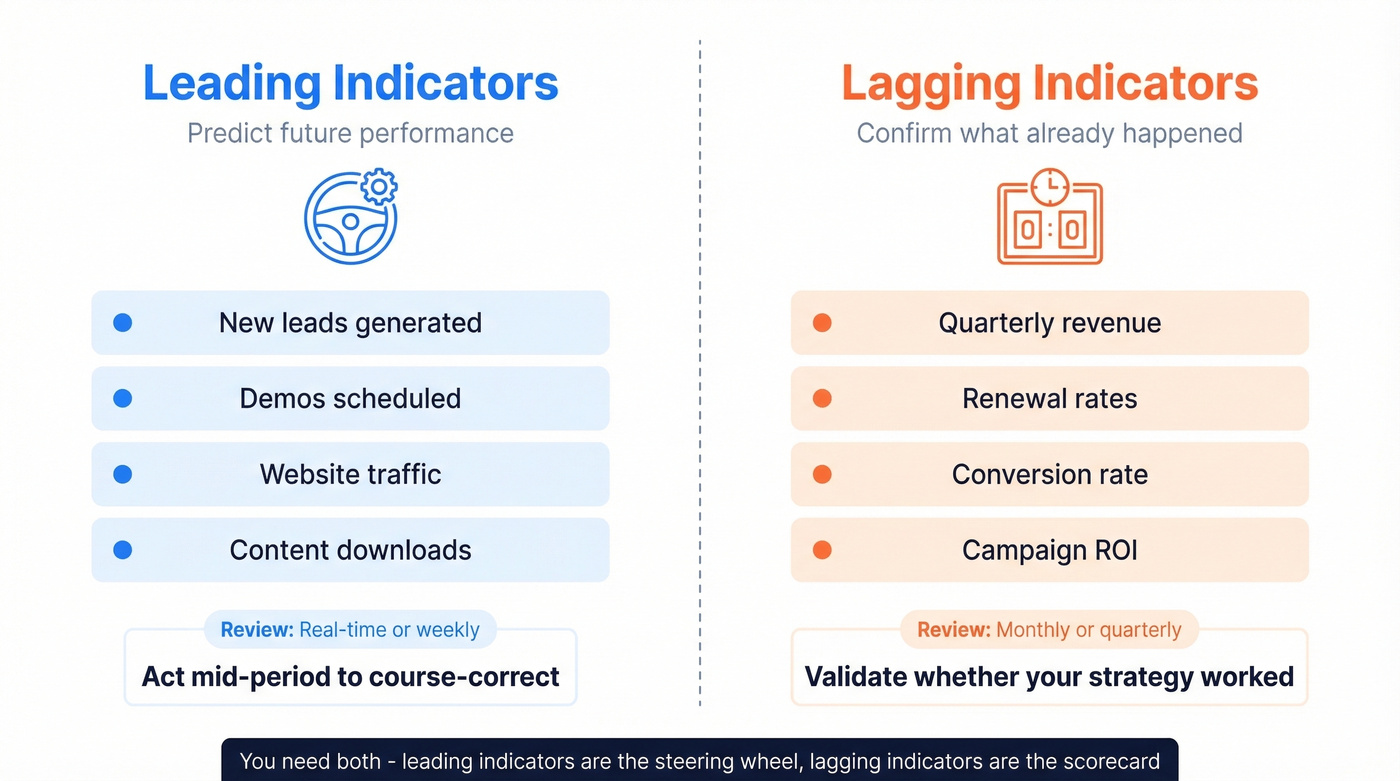
The most important distinction is leading vs. lagging. Leading indicators predict future performance. Lagging indicators confirm what already happened. You need both, but they serve different purposes and demand different review cadences.
| Type | Sales Example | Marketing Example | Review Cadence |
|---|---|---|---|
| Leading | New leads, demos scheduled | Website traffic, downloads | Real-time / weekly |
| Lagging | Quarterly revenue, renewal rates | Conversion rate, campaign ROI | Monthly / quarterly |
Leading indicators let you act mid-period. If demo bookings drop in week two, you can course-correct before the quarter's revenue number is locked in. Lagging indicators validate whether your strategy worked - they're the scorecard, not the steering wheel.
There's also a strategic vs. operational split. Strategic KPIs like net revenue retention inform board-level decisions. Operational KPIs like average handle time guide day-to-day execution. Both matter, but they belong in different dashboards and different meetings.
Track leading indicators on real-time dashboards; review lagging indicators monthly or quarterly. Mixing cadences creates noise.
Pipeline velocity, win rate, bounce rate - every sales KPI in this article depends on one thing: reaching real people at real emails. Prospeo delivers 98% email accuracy on a 7-day refresh cycle, so your KPIs measure actual performance, not data decay.
Stop tracking data quality problems. Start tracking real sales KPIs.
KPI Examples by Department
This is where things get practical. We've included formulas because they eliminate ambiguity - everyone calculates the number the same way.
Sales KPIs
Pipeline Velocity = (Number of Opportunities x Average Deal Value x Win Rate) / Sales Cycle Length
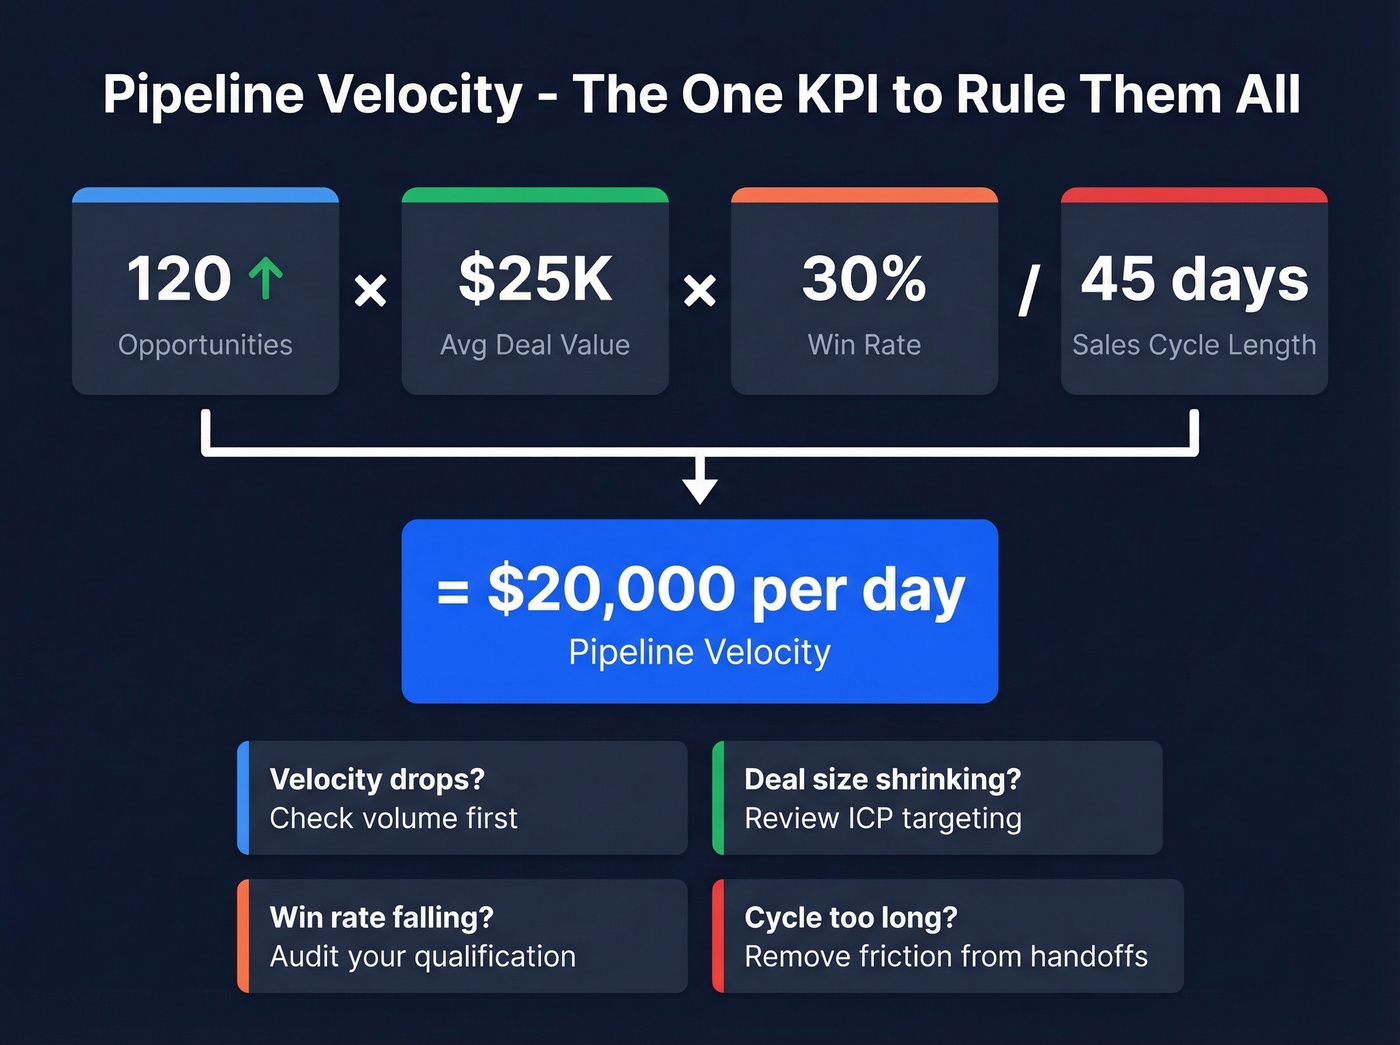
This single formula captures the health of your entire funnel. If velocity drops, you can diagnose whether it's a volume problem, a deal-size problem, a conversion problem, or a speed problem. The consensus on r/sales is that pipeline velocity is the one KPI most leaders would keep if forced to choose.
Win Rate = (Deals Won / Total Opportunities) x 100
Track the trend over quarters. A declining win rate across three consecutive quarters is a red flag regardless of where you started.
Two KPIs outbound teams overlook: email bounce rate and connect rate. Here's the thing - these only matter if your contact data is verified. When Meritt switched to Prospeo's 98%-accurate emails on a 7-day refresh cycle, their bounce rate dropped from 35% to under 4%, and connect rates tripled to 20-25%. That's the difference between measuring real performance and measuring data quality problems.

Marketing KPIs
Customer Acquisition Cost (CAC) = Total Sales & Marketing Spend / Number of New Customers Acquired
CAC is the marketing KPI that finance actually cares about. Pair it with customer lifetime value (LTV) to get the ratio that determines whether growth is sustainable - an LTV:CAC ratio below 3:1 usually means you're spending too much to acquire.
Conversion Rate = (Conversions / Total Visitors) x 100
Click-Through Rate (CTR) varies enormously by channel. WordStream's most recent analysis covering April 2024 through March 2025 found an average CTR of 6.66% across 16,000+ Google Ads campaigns, with Arts & Entertainment hitting 13.10% and Business Services at 5.65%. Know your industry baseline before setting targets.
Finance KPIs
Gross Profit Margin = ((Revenue - COGS) / Revenue) x 100
Net Profit Margin = (Net Profit / Revenue) x 100
Days Sales Outstanding (DSO) = (Accounts Receivable / Total Credit Sales) x Number of Days
DSO is the finance KPI most non-finance teams ignore - and shouldn't. A rising DSO means you're closing deals but not collecting cash, which creates cash flow crises even when revenue looks healthy on paper. For SaaS businesses, Net Revenue Retention above 110% is the gold standard because it proves your customer base grows revenue without needing new logos.
Customer Service KPIs
CSAT = (Number of Satisfied Customers / Number of Survey Responses) x 100
NPS = % Promoters - % Detractors
Churn Rate = (Customers Lost / Total Customers) x 100
First Contact Resolution (FCR) is one of the strongest drivers of customer satisfaction. Solve the problem on the first interaction, and CSAT almost always follows.
IT & Operations KPIs
System Uptime % = (Total Operational Time / Total Time Period) x 100
MTTR (Mean Time to Resolve) = Total Resolution Time / Number of Incidents
On-Time Project Completion = (Projects Completed On Time / Total Projects) x 100
Not glamorous, but these are the indicators that keep everything else running. Skip them and you'll find out the hard way.
Benchmarks: What Good Looks Like
Raw numbers are meaningless without context.
Call Center Benchmarks
| KPI | Good | World-Class |
|---|---|---|
| FCR | 70-79% | 80%+ |
| CSAT | 75-84% | 85%+ |
| AHT | 7-10 min | Varies by complexity |
| NPS | +30 to +50 | +50 to +70 |
| Service Level | 80/20 | 90/15 |
Healthcare call centers run tighter: FCR of 75-85%, CSAT of 85-90%+, and abandonment rates under 5%.
Marketing Benchmarks
| KPI | Benchmark |
|---|---|
| Google Ads CTR | 6.66% avg (16K campaigns) |
| SaaS NRR | >110% strong |
| LTV:CAC Ratio | >3:1 healthy |
Let's be honest about benchmarks: they're starting points, not targets. A 75% CSAT score is "good" by industry standards, but if your direct competitor is at 90%, that benchmark is irrelevant. Always benchmark against your own trajectory first, your competitive set second, and industry averages third.
Most teams spend more time debating which benchmarks to use than actually improving the underlying number. Pick a reasonable target, commit for two quarters, and adjust. Paralysis-by-benchmarking is a real disease.
How to Create KPIs
A six-step process that works across departments.
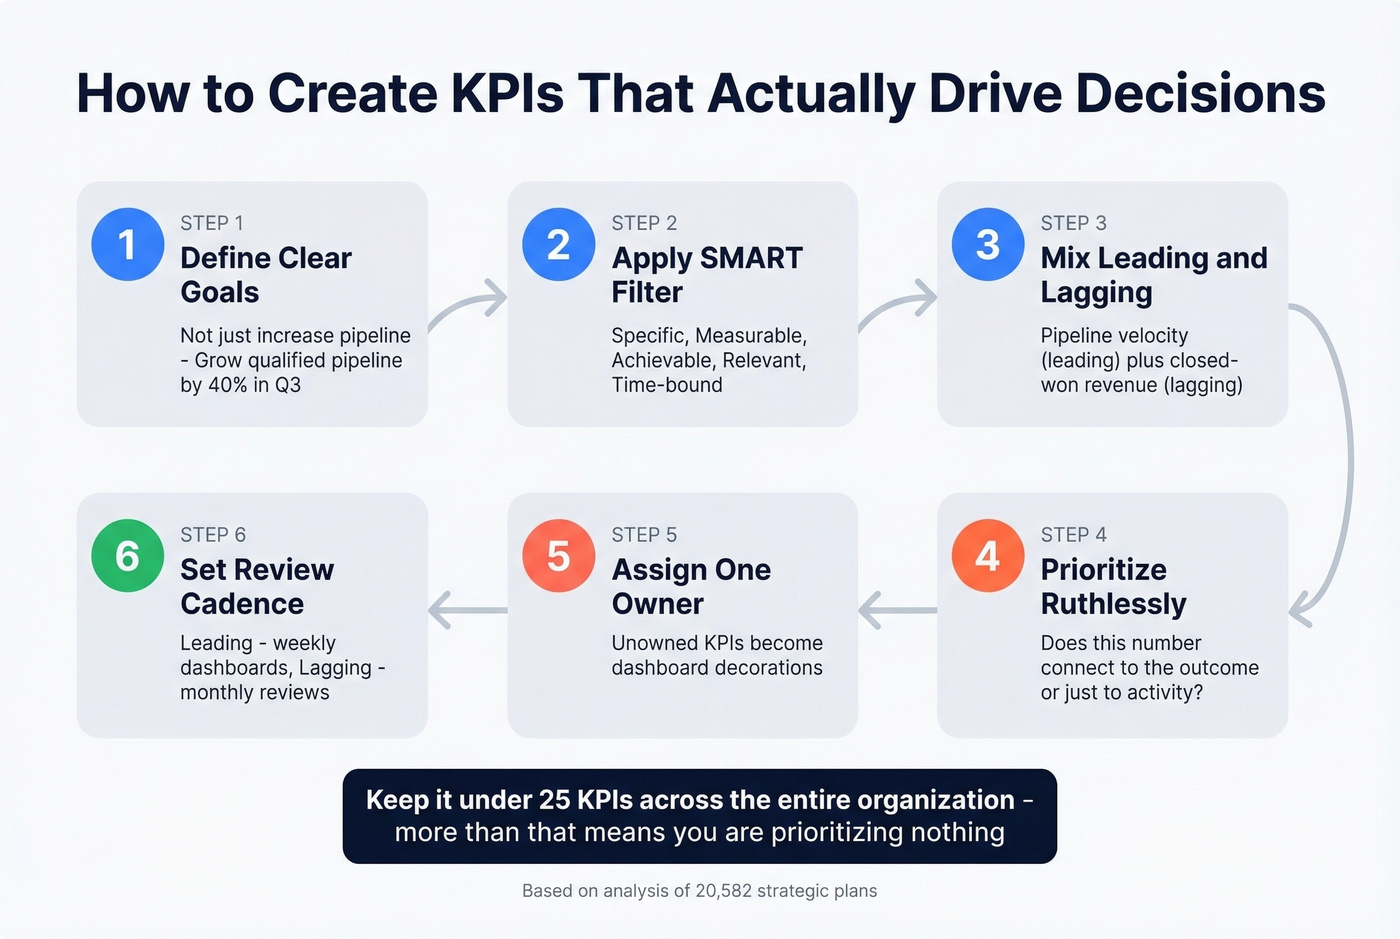
1. Define clear business goals. KPIs without goals are just numbers. "Increase pipeline" isn't a goal. "Grow qualified pipeline by 40% in Q3" is.
2. Apply the SMART framework. Every indicator should be Specific, Measurable, Achievable, Relevant, and Time-bound. This isn't a buzzword exercise - it's the filter that separates useful KPIs from vanity metrics.
3. Identify the right metrics. Mix leading and lagging indicators. For a revenue goal, you might track pipeline velocity (leading) and closed-won revenue (lagging). Aim for 5-7 KPIs per goal - enough for visibility, few enough to stay focused.
4. Prioritize ruthlessly. For revenue goals, conversion rate matters more than total website traffic. Traffic without conversion doesn't drive revenue. Apply this logic to every indicator you're considering: does this number connect to the outcome, or just to activity?
5. Assign ownership. Every KPI needs a single person responsible for monitoring it and taking action when it moves. Unowned KPIs become dashboard decorations.
6. Set a review cadence and track with dashboards. Leading indicators get weekly or real-time dashboards. Lagging indicators get monthly or quarterly reviews. Refresh the entire set annually. An analysis of 20,582 strategic plans reinforces a critical constraint: keep the total under 25 KPIs across the organization. More than that and you're measuring everything, which means you're prioritizing nothing.
Why KPIs Fail
Most KPI programs don't fail because of bad math. They fail because of bad management. We've watched organizations spend months building dashboards that nobody opens after week two. Five patterns show up repeatedly.
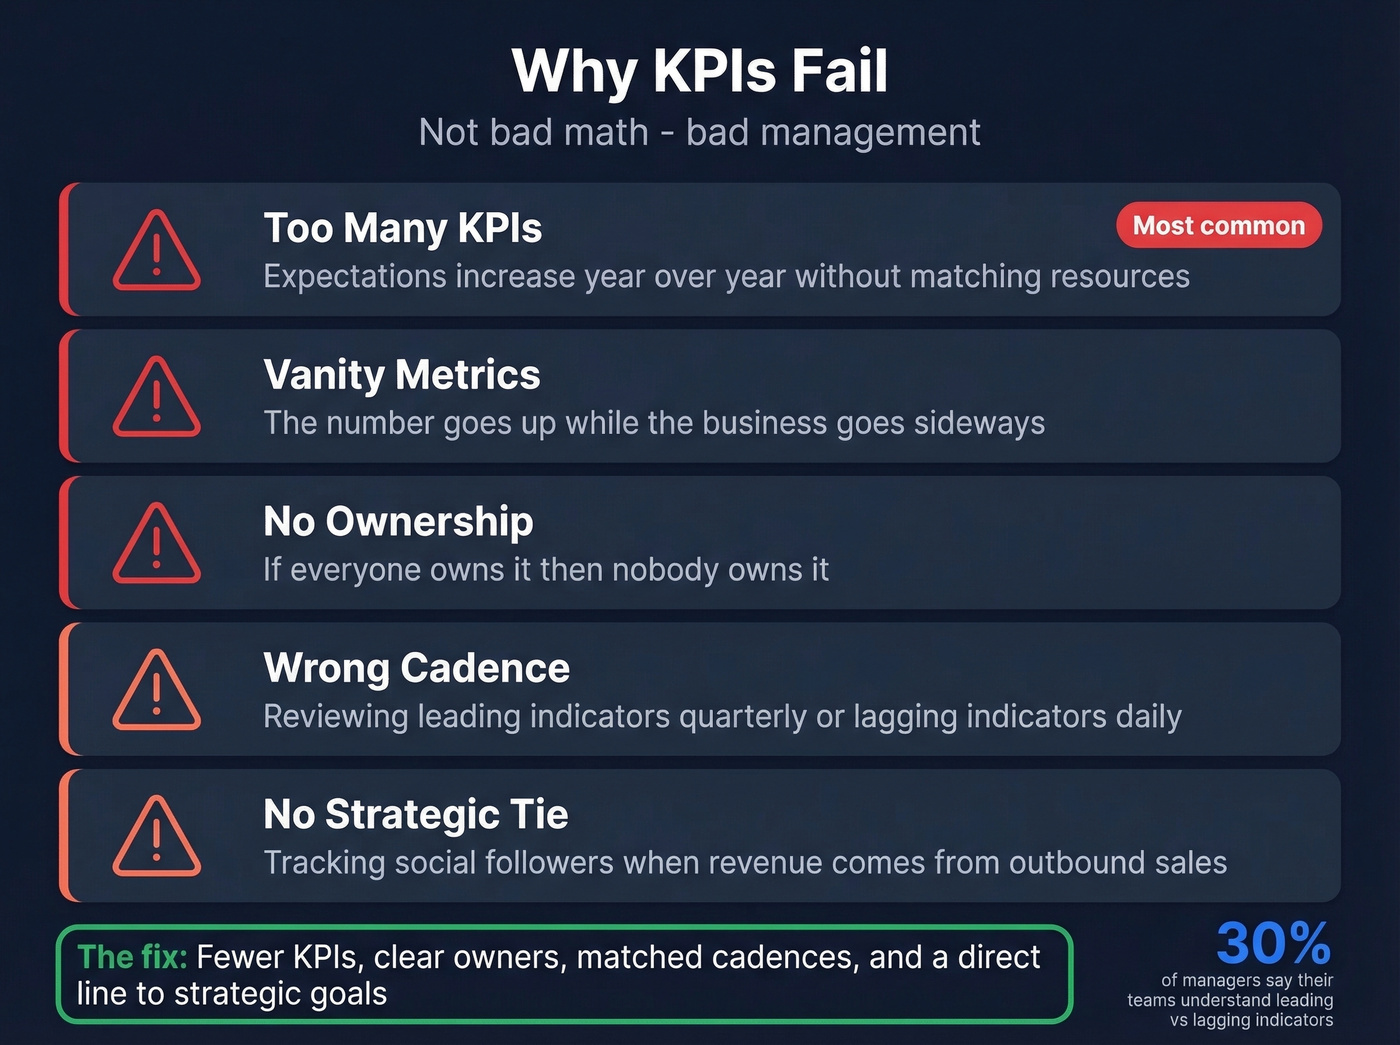
Too many KPIs, not enough capacity. One Reddit practitioner described being assigned initiative-heavy KPIs while their team was under-resourced for basic BAU work. When expectations increase year-over-year without matching resources, KPIs become a demoralization tool instead of a performance tool.
Vanity metrics with no strategic tie. Tracking social media followers as a KPI when your revenue comes from outbound sales is a waste of dashboard space. If the number can go up while the business goes sideways, it's not a key performance indicator.
No ownership assigned. A KPI that belongs to "the team" belongs to nobody. Someone specific needs to own the number and have the authority to act on it.
Benchmarking without context. A manager on r/managers shared how individual KPI rankings demoralized newer staff who were actually improving - just not as fast as tenured employees. Benchmarks need ramp-time adjustments, or they punish progress.
Never retiring stale KPIs. Last year's critical metric might be this year's noise. Most teams keep adding KPIs without ever removing one.
You don't need a dashboard with 47 widgets. You need 5 numbers on a whiteboard that everyone in the room can explain.
Meritt tracked the same outbound KPIs you do. After switching to Prospeo, their bounce rate dropped from 35% to under 4% and connect rates tripled - turning lagging indicators into leading ones. That's what happens when your contact data is verified across 300M+ profiles.
Turn your outbound KPIs from red flags into proof of growth.
FAQ
How many KPIs should I track?
Aim for 5-7 per strategic goal, with fewer than 25 total across the organization. An analysis of 20,000+ strategic plans confirms that beyond 25, teams lose focus and indicators become background noise rather than decision-driving signals.
How often should I review KPIs?
Leading indicators deserve daily or weekly attention via real-time dashboards. Lagging indicators fit a monthly or quarterly review cycle. Refresh the full set at least once a year to retire stale measures and add new ones that reflect where the business is headed.
What's the difference between a KPI and a goal?
A goal is the destination; a KPI is the speedometer. Goals are qualitative aspirations like "become the market leader in satisfaction." KPIs are the quantifiable measures - CSAT, NPS, FCR - that tell you whether you're getting there.
How do I improve outbound sales KPIs like bounce rate?
Start with data quality. If 20-30% of your emails bounce, reply rate and connect rate are measuring noise, not performance. Verified contact data on a short refresh cycle ensures your outbound KPIs reflect actual sales execution rather than stale records.