What Is a KPI in Sales? The Only Guide That Tells You Which Ones Actually Matter
It's Monday morning. You open the dashboard. Pipeline coverage is 2.1x, win rate is sitting at 18%, and the team's at 73% quota attainment with six weeks left in the quarter. There are 47 metrics on that screen, and not one of them tells you what to do next.
That's the problem with most sales KPI setups - teams track too many numbers and act on none. If you're asking what a KPI in sales actually is, most guides will list a pile of metrics and call it a day. Nobody tells you which ones matter for your team, your stage, your sales motion. Let's fix that.
The Five-KPI Starter Pack
Short on time? Here's what most B2B sales teams actually need:
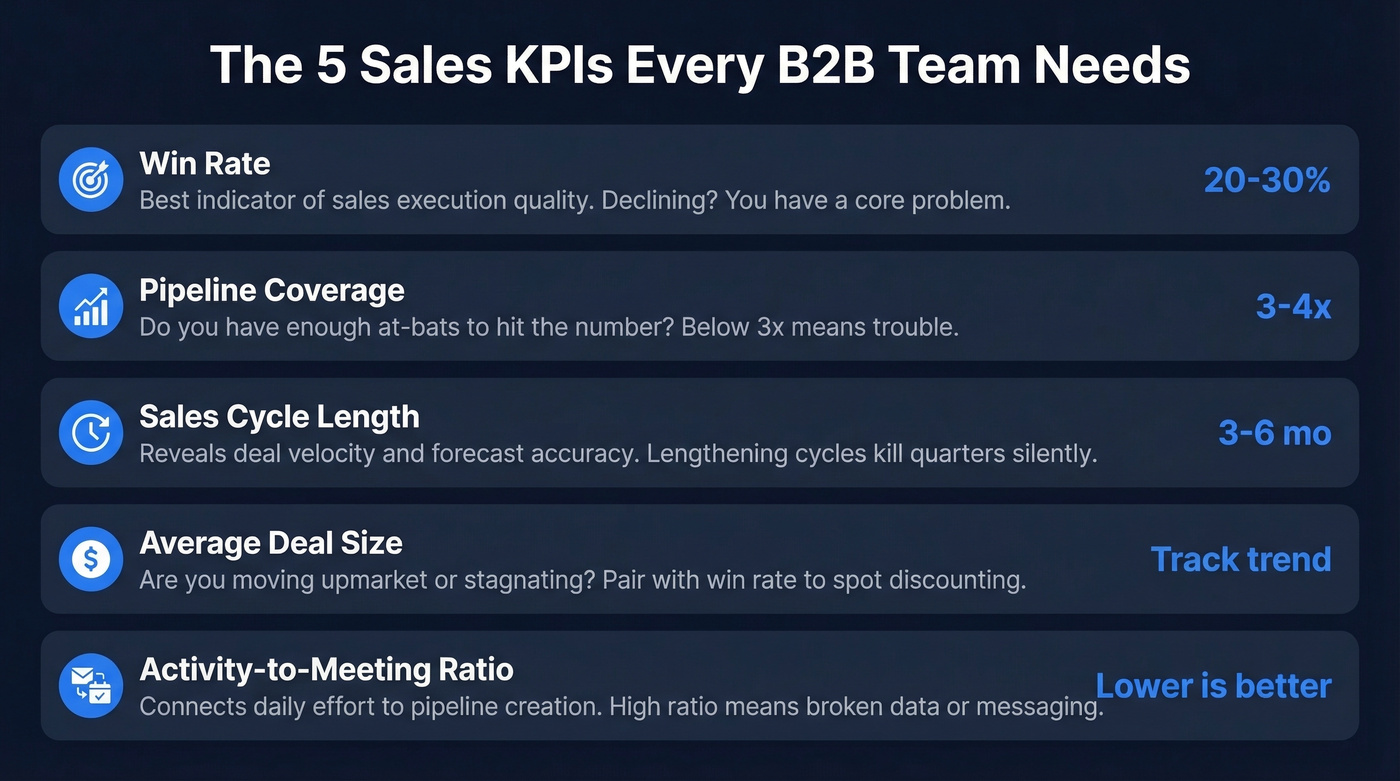
- Win rate - one of the best indicators of sales execution quality. If it's declining, you've got a core problem.
- Pipeline coverage - tells you whether you have enough at-bats to hit the number. Below ~3x? Start worrying.
- Sales cycle length - reveals deal velocity and forecasting accuracy. Lengthening cycles kill quarters silently.
- Average deal size - tracks whether you're moving upmarket, downmarket, or stagnating. Pair it with win rate to spot discounting problems.
- Activity-to-meeting ratio - the leading indicator that connects daily effort to pipeline creation. If reps are sending a huge volume of emails to book one meeting, the data or the messaging is broken.
Sales KPI Definition and Core Concepts
A KPI - key performance indicator - is a quantifiable measure used to evaluate progress toward a specific business objective. In a sales context, it's the handful of numbers that tell you whether the team is on track to hit revenue targets, and more importantly, why or why not.
Not every number on your dashboard qualifies. KPIs are the most critical subset of metrics - the ones tied directly to strategic goals. "Total emails sent" is a metric. "Win rate" is a KPI. One measures activity; the other measures whether that activity is producing results.
These indicators also operate at different levels. Your CEO cares about ARR growth. Your VP of Sales cares about pipeline coverage. Your SDR manager cares about rep ramp time. Same company, three different tiers - and the tier determines who owns it and how often it gets reviewed.
KPI vs Metric vs OKR
These three terms get used interchangeably, and that's where confusion starts:
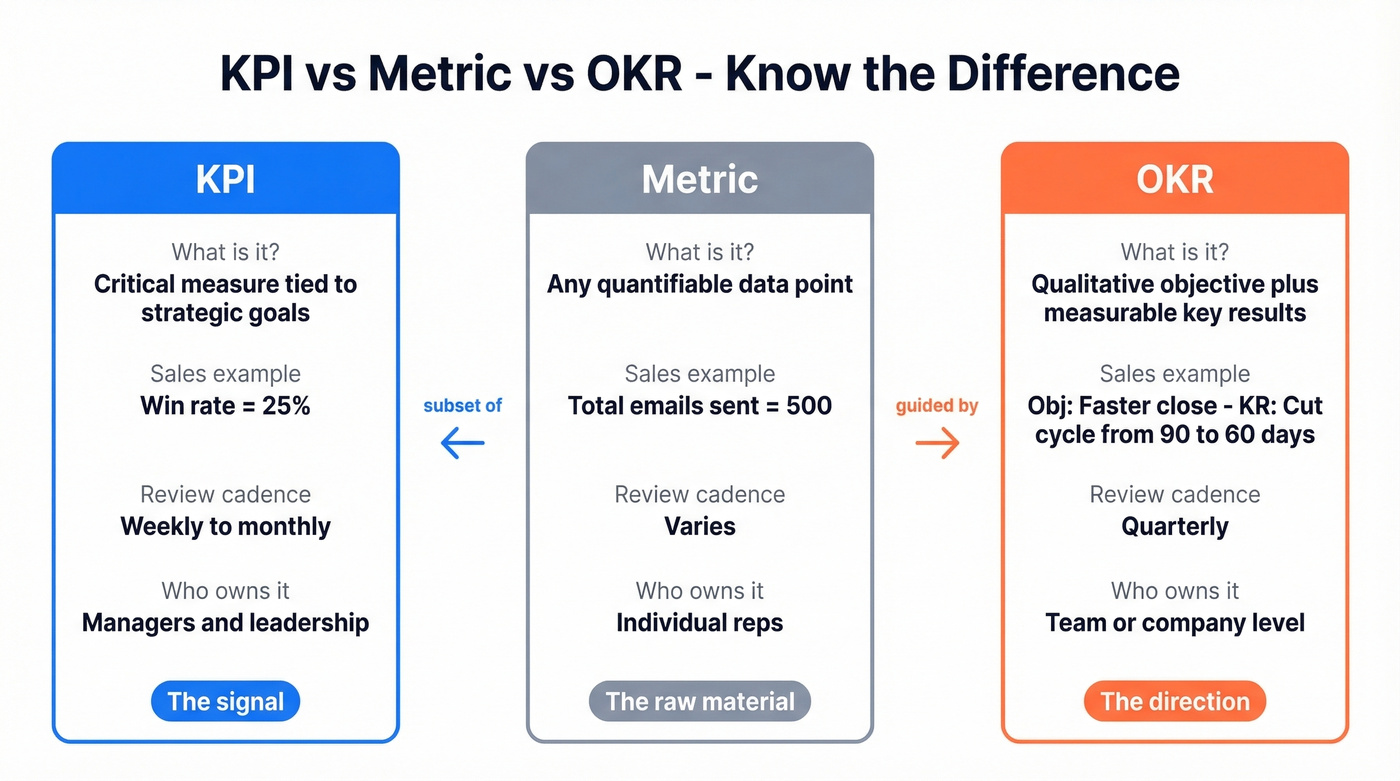
| KPI | Metric | OKR | |
|---|---|---|---|
| Definition | Critical subset tied to strategic goals | Any quantifiable data point | Qualitative objective + measurable key results |
| Sales example | Win rate = 25% | Total emails sent = 500 | Obj: "Faster close" -> KR: "90->60 day cycle" |
| Review cadence | Weekly-monthly | Varies | Quarterly |
Metrics are the raw material. KPIs are the metrics that matter most. OKRs are the framework that gives KPIs direction. You don't need all three systems running simultaneously, but you do need to know which numbers are key performance indicators and which are just noise.
Why Sales KPIs Matter
The case for tracking these indicators isn't philosophical - it's financial. Teams that implement CRM dashboards with clear KPI tracking see an average increase of 29% in sales. Organizations using mobile CRM hit their targets at a 65% rate compared to 22% for those without mobile access. The difference isn't the software. It's the visibility.
There's a motivation angle too. Employees who understand how success is measured are 2x more likely to feel motivated, which makes intuitive sense - if a rep doesn't know whether they're winning or losing until the end of the quarter, they can't course-correct. KPIs create a feedback loop between effort and outcome.
Here's the thing, though: they only work if they're the right ones, tracked at the right cadence, by the right people. A dashboard with 30 metrics isn't a KPI system. It's a screensaver.
How to Choose the Right Sales KPIs
The SMART Framework
The SMART framework isn't new, but it's still the fastest way to pressure-test whether an indicator is worth tracking:
- Specific - "Improve pipeline" isn't a KPI. "Increase pipeline coverage from 2.5x to 3.5x" is.
- Measurable - if you can't pull the number from your CRM without manual calculation, it won't get tracked.
- Achievable - setting a 50% win rate target when your team's been at 22% for three quarters isn't ambitious, it's demoralizing.
- Relevant - an SDR team shouldn't be measured on average deal size. That's an AE metric.
- Time-bound - "by end of Q2" or "within 90 days." Without a deadline, a KPI is just a wish.
The biggest failure mode we see is teams picking KPIs that sound impressive in a board deck but don't connect to anything a rep can actually influence on a Tuesday afternoon. Pick 3-5 per role, assign clear ownership, and set a review cadence before you build a single dashboard.
Leading vs Lagging Indicators
Managing sales by lagging indicators alone is like driving by looking in the rearview mirror. By the time revenue misses, it's too late to change anything meaningful.
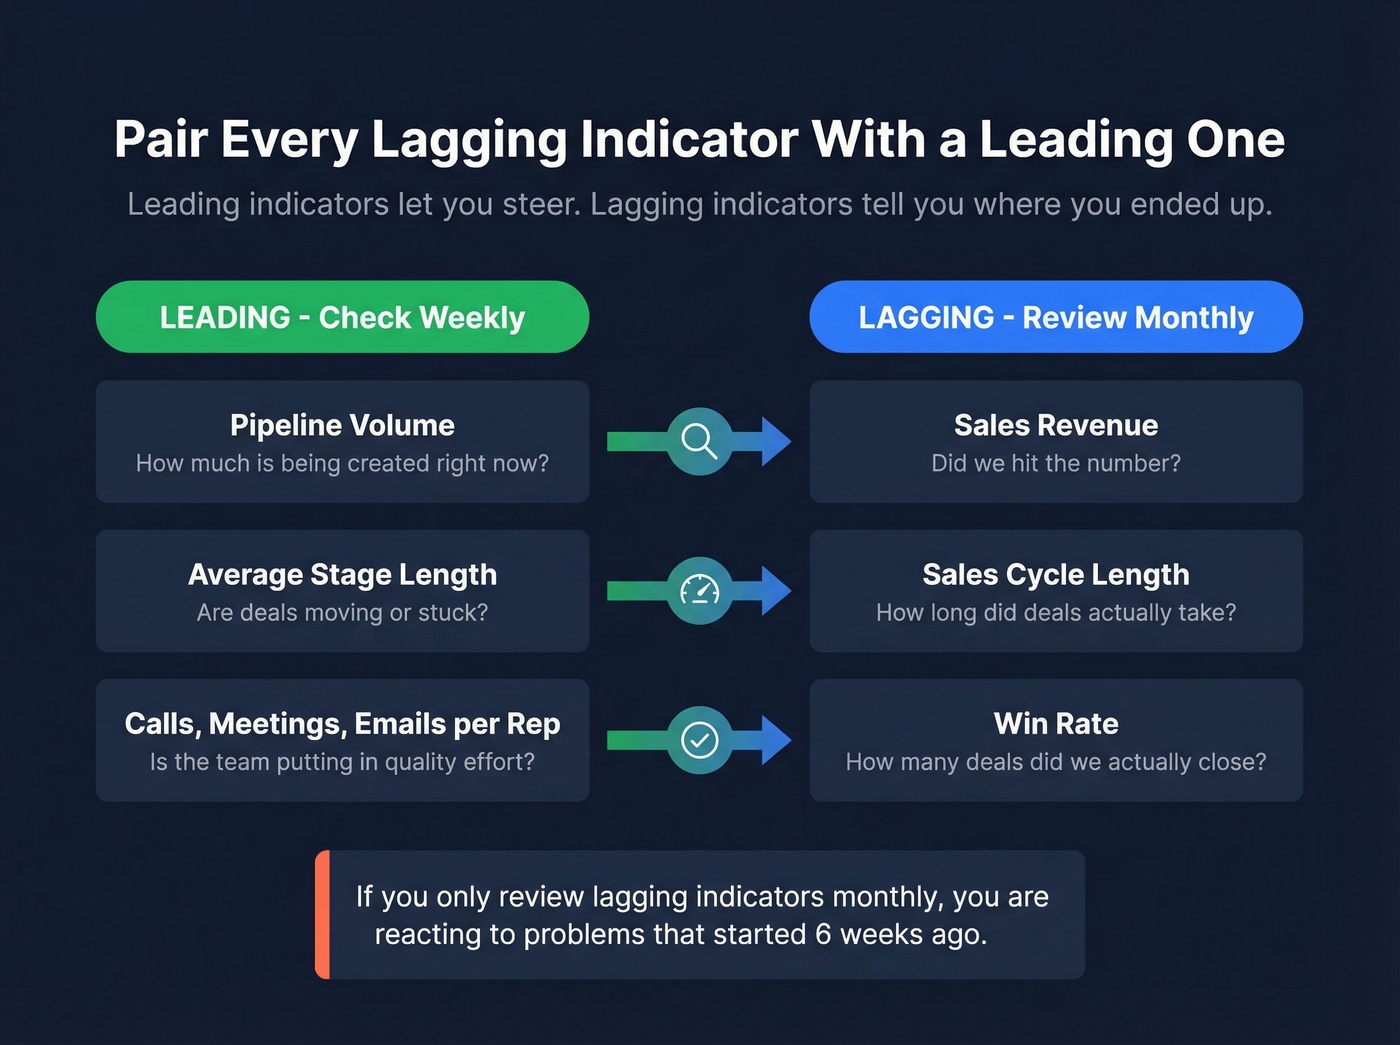
The fix is pairing every lagging indicator with a leading one. Geckoboard's framework makes this concrete:
| Leading (check weekly) | Lagging (review monthly) |
|---|---|
| Pipeline volume | Sales revenue |
| Average stage length | Sales cycle length |
| Calls/meetings/emails per rep | Win rate |
Leading indicators go on the rep-facing dashboard. Lagging indicators are for managers and leadership. If you're only reviewing lagging indicators in a monthly business review, you're reacting to problems that started six weeks ago.
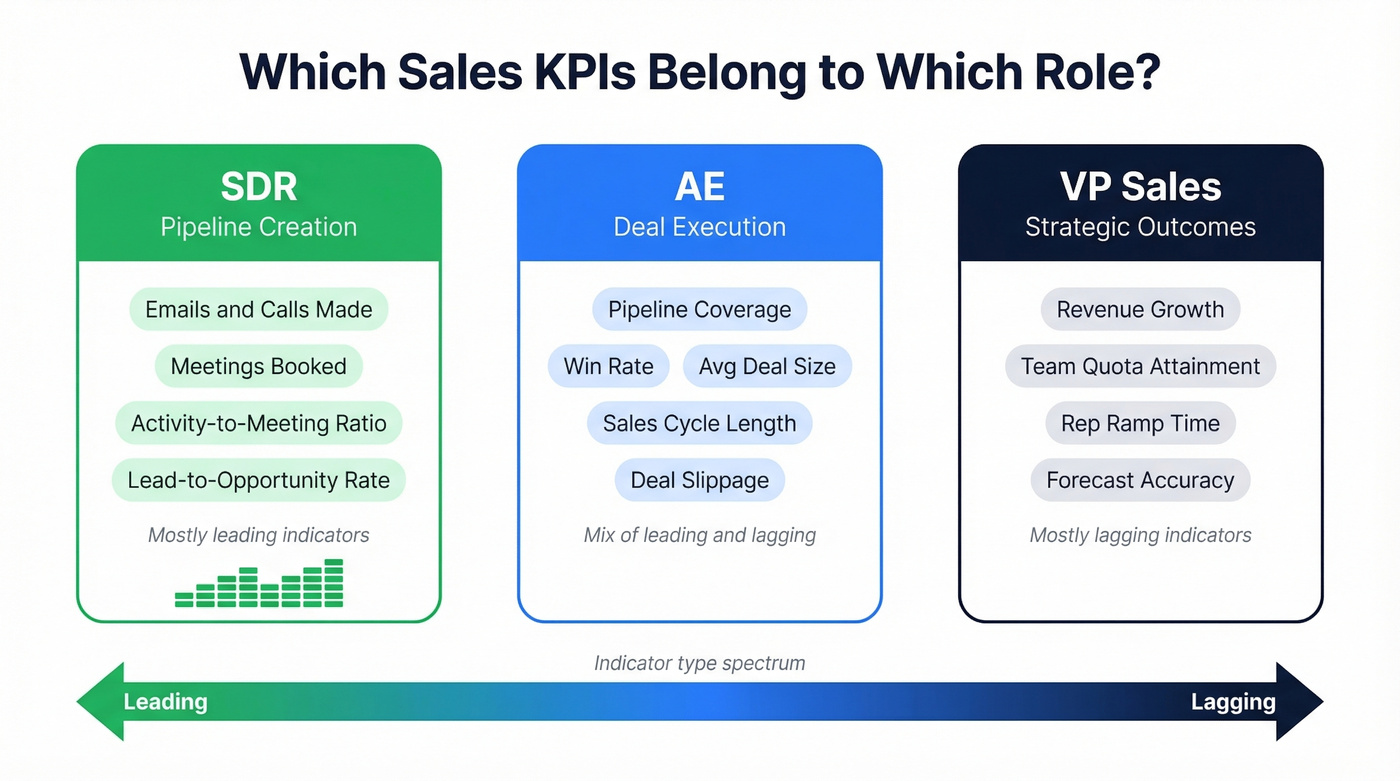
Role-Based KPI Mapping
| Role | KPIs | Indicator Type |
|---|---|---|
| SDR | Emails/calls made, meetings booked, activity-to-meeting ratio, lead-to-opportunity rate | Mostly leading |
| AE | Pipeline coverage, win rate, avg deal size, sales cycle length, deal slippage | Mixed |
| VP Sales | Revenue growth, team quota attainment, rep ramp time, forecast accuracy | Mostly lagging |
Your activity-to-meeting ratio is one of the most telling sales KPIs - and bad contact data destroys it. Prospeo delivers 98% email accuracy and 125M+ verified mobiles with a 30% pickup rate, so every dial and send counts toward pipeline, not bounce reports.
Stop inflating activity metrics with dead emails. Start connecting.
Essential Sales KPIs With Formulas
Revenue & Growth
Revenue growth rate = ((Current Period Revenue - Previous Period Revenue) / Previous Period Revenue) x 100. Healthy B2B companies target 15-25% annual growth.
MRR/ARR is the heartbeat of any subscription business. MRR = sum of all monthly recurring subscription revenue. ARR = MRR x 12. Simple math, but the trend line is what matters - a flat ARR with rising CAC is a company slowly dying.
Average deal size = total revenue / number of closed deals. Track this alongside win rate. If deal size is climbing but win rate is falling, reps are chasing deals they can't close.
Pipeline & Conversion
Your SDR manager pulls the weekly report: 12 new opportunities created, average deal size $45K, team win rate at 24%, and an 87-day average cycle. Sounds fine in isolation. But run those numbers through the sales velocity formula and you get a very different picture.
Sales velocity = (# opportunities x avg deal size x win rate) / sales cycle length. This is one of the most useful single indicators because it captures pipeline health, deal quality, execution skill, and speed in one number. If velocity is declining, at least one of those four inputs is broken.
Pipeline coverage = total pipeline value / quota. Benchmark: 3-4x. Below 3x and you're likely to miss the number. Above ~5x can signal a bloated pipeline or weak qualification.
Win rate = deals won / total opportunities. B2B benchmark: 20-30%. It's one of the most diagnostic performance indicators - it tells you about qualification, competitive positioning, and rep skill simultaneously.
Sales cycle length = average days from opportunity creation to close. B2B benchmark: 3-6 months. Track this by deal size segment. Blending enterprise and SMB deals masks problems.
Deal slippage = deals that push past their expected close date / total deals. Keep this under 20%.
Activity & Efficiency
Activity-to-meeting ratio = total outbound activities / meetings booked. This leading indicator tells you whether targeting and messaging are working before pipeline numbers show it.
Calls/emails per rep - track raw volume as a baseline. Benchmark varies by motion: 50-80 calls/day for phone-heavy teams, 30-50 personalized emails/day for email-first.
Quota attainment = actual revenue / assigned quota x 100. If fewer than 60% of reps are hitting quota, the problem is often the quota, the territory, or the data - not the reps.
Rep ramp time = days from hire to first quota-carrying month at full attainment. Benchmark: 3-6 months. In our experience, the biggest variable here isn't training quality - it's whether new reps have clean, verified contact data from day one.
Customer & Retention
Most teams treat these as "Customer Success KPIs" and ignore them in sales reviews. That's a mistake. If your sales team is closing customers who churn in 90 days, your win rate is a lie.
CAC = total sales and marketing spend / new customers acquired. Median B2B SaaS CAC runs around $1,200, but enterprise motions can exceed $5,000.
CLV = average revenue per customer x average customer lifespan. The LTV:CAC ratio should land between 3:1 and 5:1. Below 3:1, you're spending too much to acquire customers who don't stick around long enough to pay you back.
Churn rate = customers lost / total customers at start of period x 100. Annual churn under 7% is generally considered acceptable. Target under 5-7% in SaaS.
NRR = (starting MRR + expansion - contraction - churn) / starting MRR x 100. Top performers hit 120%+, and companies at that level see 2.3x higher valuations.
2026 Sales KPI Benchmarks
B2B Sales Benchmarks
| KPI | Benchmark Range |
|---|---|
| Win rate | 20-30% |
| Sales cycle | 3-6 months |
| Pipeline coverage | 3-4x quota |
| Deal slippage | <20% |
| Annual churn | <7% |
| Rep ramp time | 3-6 months |
| Team turnover | <15% annually |
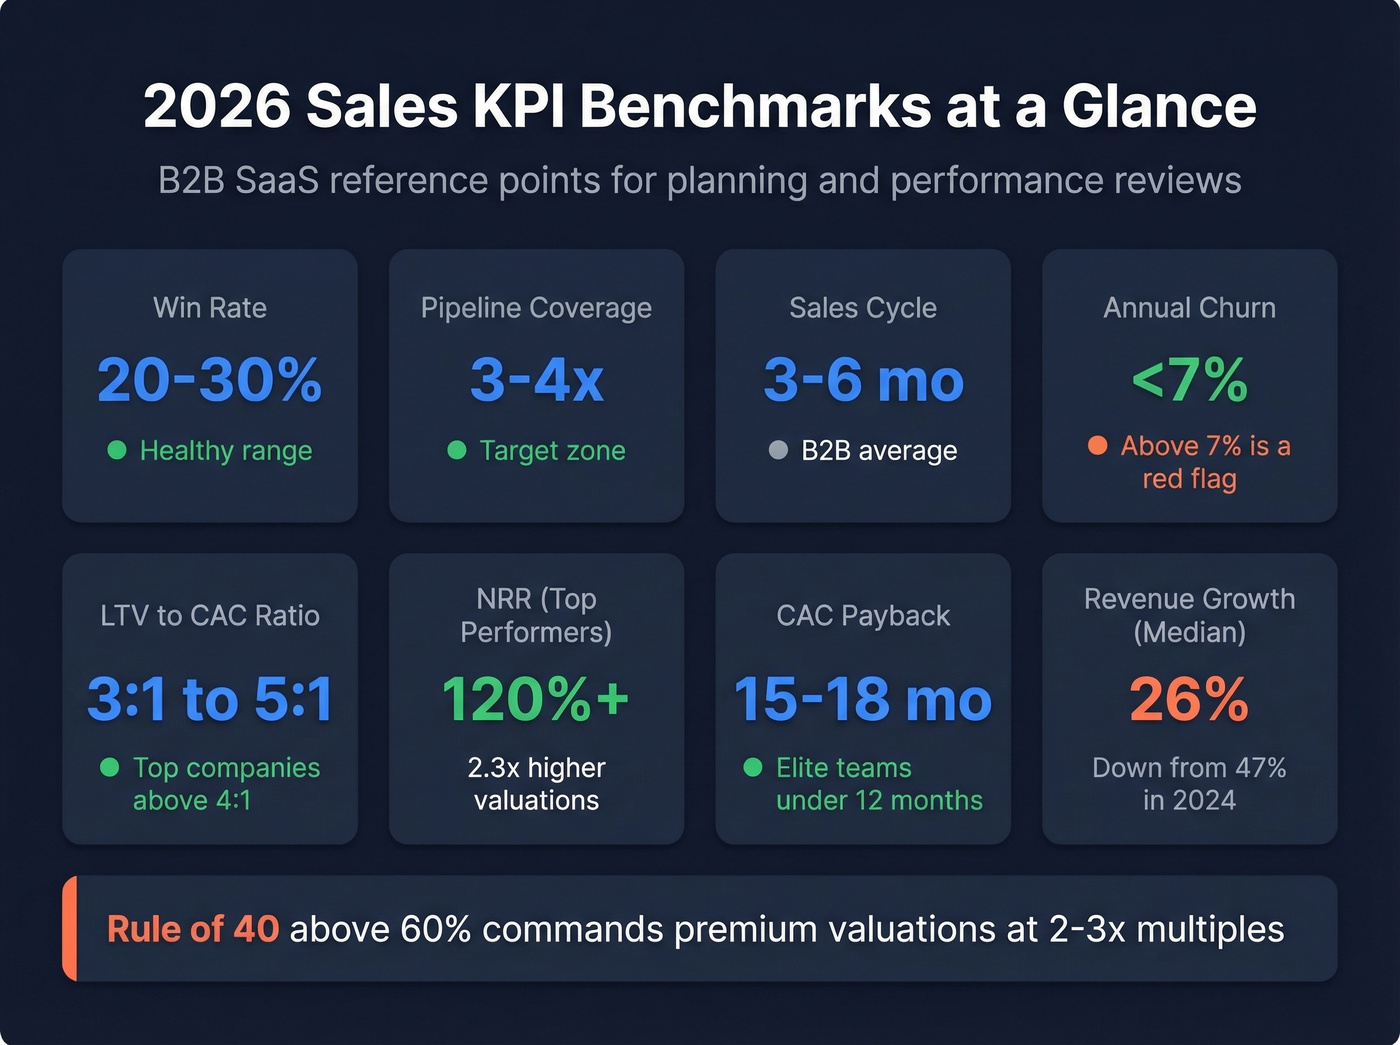
SaaS-Specific Benchmarks
| KPI | Benchmark | Notes |
|---|---|---|
| Annual revenue growth | 26% median | Down from 47% in 2024 |
| NRR (top performers) | 120%+ | 2.3x higher valuations |
| CAC payback | 15-18 months | Elite: <12 months |
| LTV:CAC | 3:1-5:1 | Top companies >4:1 |
| Rule of 40 | >60% = premium | 2-3x higher valuations |
| MRR growth (seed) | 15-25% MoM | <$1M ARR |
| MRR growth (Series A) | 10-20% MoM | $1M-$5M ARR |
| MRR growth (>$100M) | 1-5% MoM | Mature stage |
For context on deal sizes: ACV ranges vary wildly by vertical. Enterprise security averages around $180K, DevOps and infrastructure sits near $85K, and horizontal SaaS lands around $12K. Benchmark your average deal size within your vertical - not against the SaaS median.
Let's be honest: most teams under $5M ARR don't need more than five KPIs total. The obsession with building an elaborate KPI framework is a procrastination strategy disguised as rigor. Pick five, act on them for 90 days, then reassess. You'll learn more from acting on imperfect KPIs than from spending six weeks choosing perfect ones.
Five KPI Mistakes That Kill Performance
1. Tracking Too Many KPIs
"If we try to focus on everything, we focus on nothing." That line from WhatMatters should be taped to every RevOps monitor. We've seen dashboards with 40+ metrics where nobody can name the three numbers that actually matter. Three to five per role. That's the ceiling.
2. Copying KPIs That Don't Fit
A PLG company tracking outbound calls per rep is measuring the wrong thing. A field sales team tracking MQLs is measuring someone else's job. Before you can define the right key performance indicators for your org, you need to understand your own sales motion - your go-to-market approach, your buyer journey, your stage. Skip this step and you'll end up with a dashboard that looks great in screenshots but tells you nothing about your business.
3. Confusing Tasks With Objectives
"Implement Salesforce company-wide" is a task. "Close sales faster" is an objective. When KPIs start looking like to-do lists, you've lost the plot. Describe results, not actions.
4. Tracking Without Acting
Real talk: the most common failure isn't picking the wrong KPIs. It's picking the right ones and doing nothing when they flash red. If pipeline coverage drops below 3x and nobody changes the prospecting cadence, the dashboard is just expensive wallpaper. Knowing what a KPI means is only useful if the insight drives a change in behavior - a new play, a coaching session, a territory rebalance. Something.
5. Ignoring Data Quality
Here's a scenario we've watched play out repeatedly. An SDR manager sees 500 emails sent per rep per week and 40 meetings booked. Looks productive. But 28% of those emails bounced, meaning the "500 sent" number is fiction and the activity-to-meeting ratio is wildly inflated. Bad contact data corrupts every activity KPI downstream.
This is where data quality becomes a KPI prerequisite, not an afterthought. GreyScout ran into exactly this problem - their bounce rate was sitting at 38%, which meant their pipeline numbers were built on sand. After switching to Prospeo's verified data with its 7-day refresh cycle, bounce rates dropped under 4% and rep ramp time fell from 8-10 weeks to 4 weeks. The KPIs didn't change. The data feeding them did.

How to Track Sales KPIs
A KPI system has three layers. Skip any one and the whole thing breaks.
CRM as foundation. Salesforce (~$25-$330/user/mo depending on edition) or HubSpot (free tier; paid ~$20-$150+/seat/mo) is where deal data lives. Your pipeline, conversion, and revenue KPIs all pull from here. If reps aren't updating the CRM, no dashboard will save you.
BI layer for visualization. Tableau (~$15-$75/user/mo for Viewer/Explorer) or Power BI (free-$10/user/mo for Pro) turns CRM data into dashboards people actually open. Build two views: a pipeline dashboard for leadership and a rep scorecard for managers.
Data quality layer. This is the one most teams skip. If the contact data feeding your CRM and outbound sequences is stale or unverified, activity metrics downstream are built on bounced emails and dead numbers. Tools like Prospeo sit here - verifying emails at 98% accuracy and refreshing data every 7 days so the numbers on your dashboard actually mean something. If you're troubleshooting bounces, start with email bounce rate benchmarks and fixes.
Four-Week Quick Start
- Week 1: Pick 3-5 KPIs per role using the role-based mapping above. Assign ownership.
- Week 2: Build two dashboards - pipeline view for leadership, rep scorecard for managers.
- Week 3: Run your first weekly review using leading indicators only.
- Week 4: Calibrate targets against the benchmarks in this guide. Adjust anything that's clearly off.
For ongoing cadence, leading indicators get reviewed daily or weekly in standups. Lagging indicators get reviewed monthly. Run a full KPI audit quarterly - retire metrics that no longer align with goals and add new ones as the sales motion evolves. The consensus on r/sales is that quarterly audits are the minimum; I'd argue monthly check-ins on whether you're even looking at the right numbers are worth the 30 minutes.
Tracking win rate and pipeline coverage means nothing if reps waste hours chasing wrong numbers and bounced emails. Teams using Prospeo book 35% more meetings than Apollo users - because data quality is the leading indicator behind every lagging KPI on your board.
Better data in, better KPIs out. See the difference at $0.01 per email.
FAQ
How is a sales KPI different from a sales metric?
All KPIs are metrics, but not all metrics are KPIs. A KPI is the critical subset tied directly to strategic objectives - like win rate or pipeline coverage. A metric is any measurable data point, like total emails sent. Tracking 40 metrics as if they're all KPIs leads to information overload and zero action.
How many KPIs should a sales team track?
Three to five per role is the sweet spot. SDRs focus on activity and conversion rates. AEs track pipeline coverage and deal execution. VPs monitor revenue growth and team quota attainment. More than five per person and nobody can optimize six things simultaneously.
What are the most important leading indicators in sales?
Pipeline volume, meetings booked, and activity-to-meeting ratio are the three leading indicators that best predict future revenue. Review them weekly to course-correct before lagging indicators like win rate and quota attainment reveal problems too late to fix.
How does bad data affect sales KPIs?
If 30% of outbound emails bounce, every activity metric downstream is inflated - meetings-per-email, pipeline creation rate, and cost-per-opportunity all become fiction. Clean, verified contact data with regular refresh cycles keeps CRM data honest so your KPIs reflect reality instead of garbage-in-garbage-out math.