What Is Market Sizing? The Practitioner's Guide
You're staring at slide 7 of a pitch deck - the one that says "Market Opportunity" - and it's blank. Every guide on market sizing wants to teach you how to estimate the number of piano tuners in Chicago, but you need a defensible number for a real business. One that won't get laughed out of a partner meeting.
Let's fix that.
Market Sizing Defined
Market sizing is the process of estimating the total revenue opportunity for your product in a defined market. Not the size of "the cloud" or "the AI industry" - the revenue your specific product could capture from your specific customers.
The goal isn't precision. It's being broadly right rather than precisely wrong. You want to estimate the revenue opportunity for your product in a defined segment, use bottom-up math (customer count × price) as your primary method, lean on free government data plus a B2B database for inputs, and validate by triangulating methods and stress-testing assumptions. Never present a single number without showing the math and a range.
TAM, SAM, and SOM Explained
Three concentric circles. Every pitch deck has them. Most get them wrong.
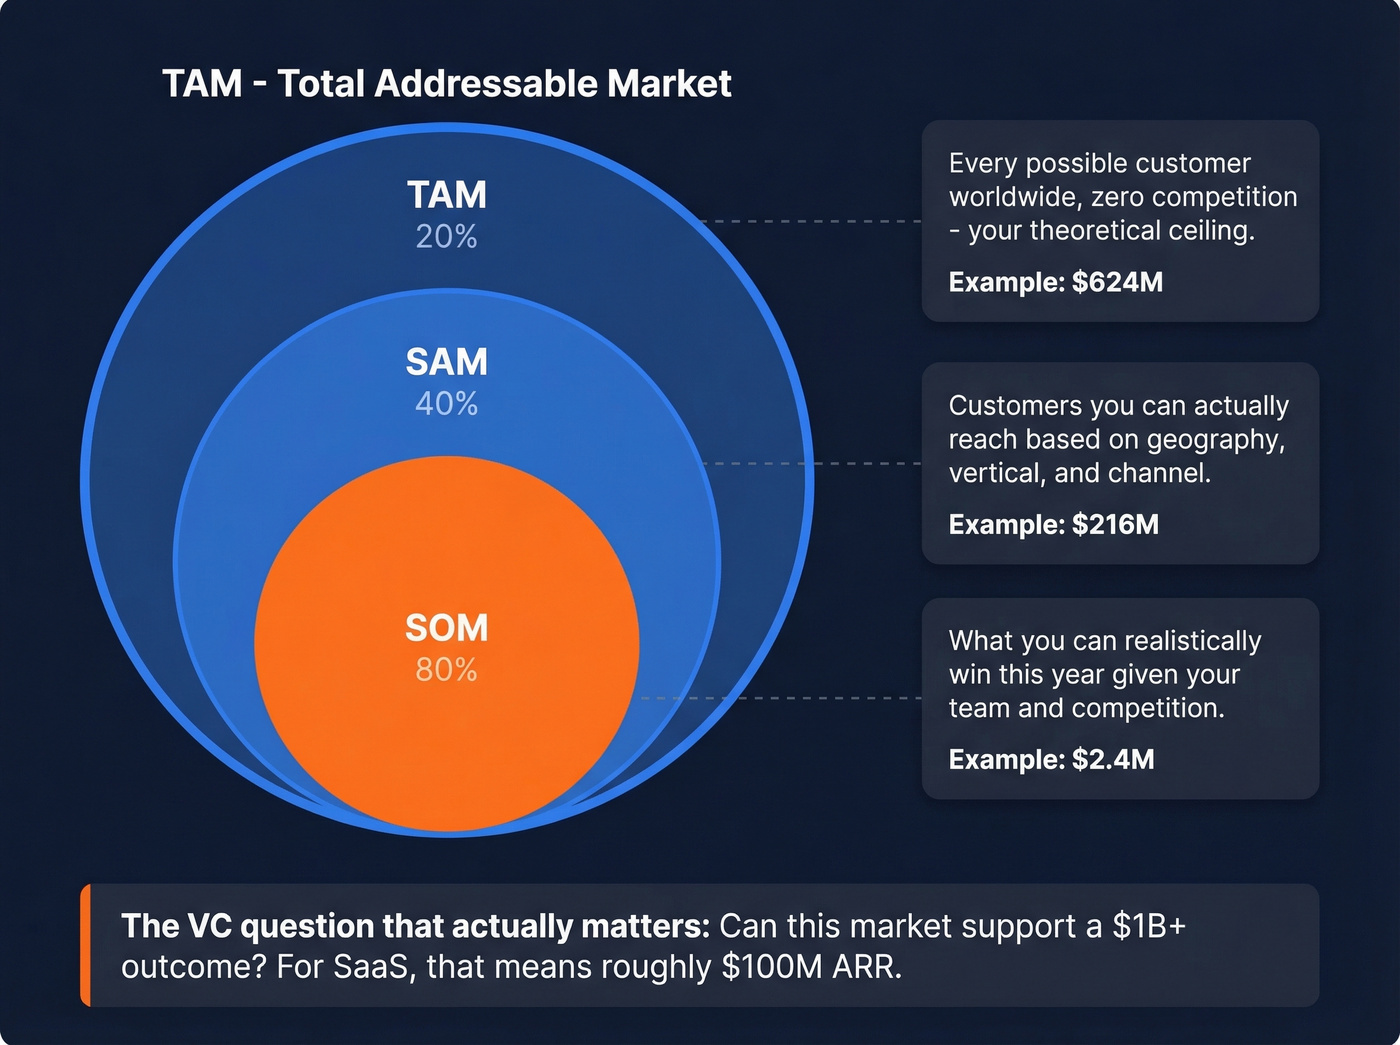
TAM (Total Addressable Market) is the total revenue opportunity if you sold to every possible customer in the world with zero competition - a theoretical ceiling. A solid total addressable market model starts by defining the boundaries of "every possible customer" with specificity, not hand-waving at an industry report. SAM (Serviceable Addressable Market) narrows TAM to the segment you can actually reach, filtered by geography, vertical, company size, or distribution channel. SOM (Serviceable Obtainable Market) is the slice of SAM you can realistically win in a given timeframe, accounting for competition, sales capacity, and go-to-market constraints.
The TAM/SAM/SOM Trap
Underscore VC calls the market size slide "one of the most commonly wasted slides in a pitch deck." PitchDoctor goes further: the TAM/SAM/SOM framework is "not your friend" for fundraising. Investors anchor on the smallest number, they hold conflicting definitions of what each circle means, and it's harder to make three numbers believable than one. If you're going to use this framework, defend every input - or skip the circles entirely and show a single bottom-up number with the math behind it.
Here's the VC mental model that actually matters: can this market support a $1B+ outcome? For SaaS, a common shorthand is $100M ARR ≈ $1B valuation. Another common bar is a market roughly 20× larger than your revenue target. That's the bar. Everything else is decoration.
Top-Down vs. Bottom-Up Frameworks
Two methods, very different credibility levels.
Top-Down (Chain Ratio Method)
Use this if: you need a quick sanity check, an investor-context number, or a ceiling for your bottom-up estimate.
Skip this if: you're building a defensible pitch deck number or planning GTM resources. Top-down tends to run high because each assumption in the chain compounds uncertainty.
Top-down starts with a large industry number - say, a Gartner forecast - and applies successive filters: the percentage that's B2B, the percentage in your geography, the percentage using the relevant technology. The chain ratio method is fast and cheap, but stacking four or five assumptions makes the final number feel arbitrary.
Bottom-Up (Counting Noses)
Use this if: you want a number investors can't easily dispute.
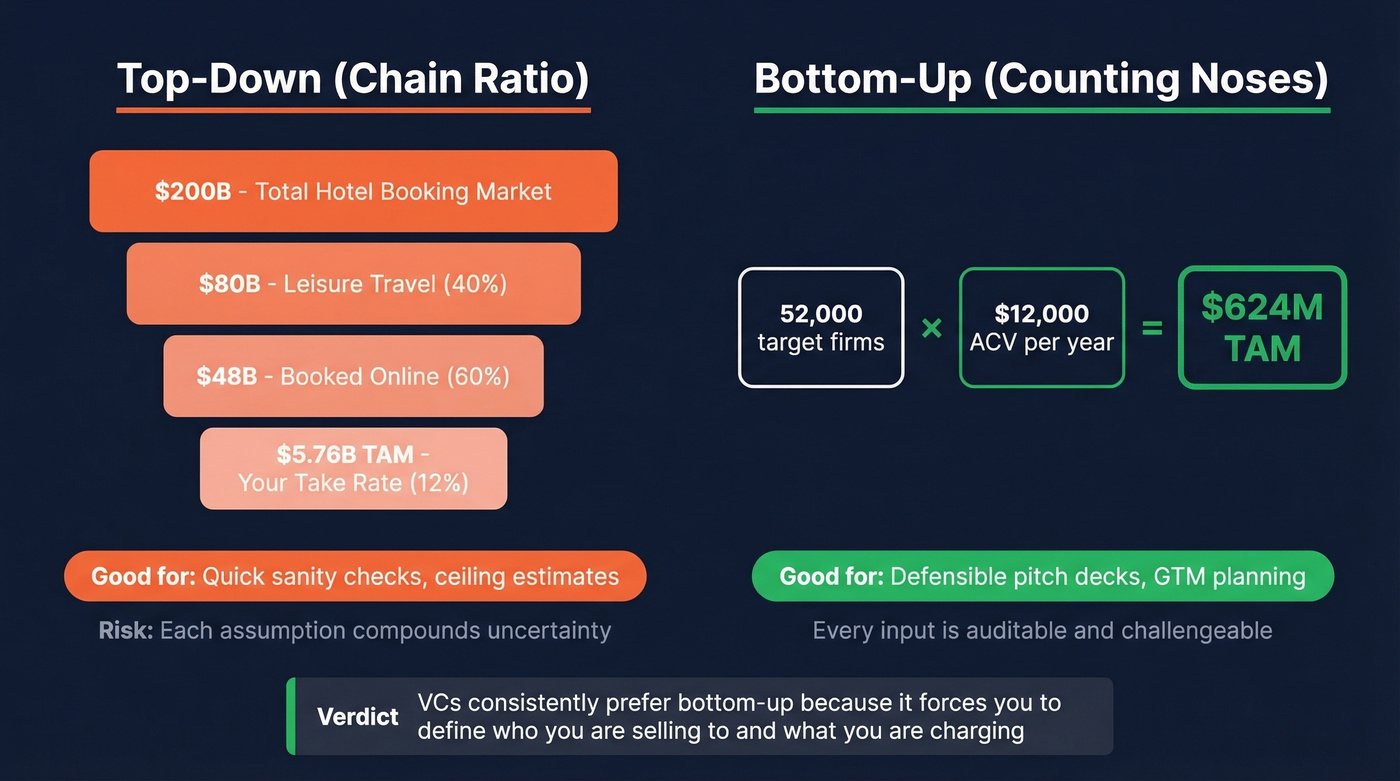
Bottom-up is multiplication: [number of target customers] × what they'll pay you per year. That's it. If investors believe those two inputs, the math is hard to argue with. To find how many companies match your ICP criteria, filter a B2B database by industry, headcount, and geography - you get an actual count in minutes instead of guessing. Bottom-up also communicates your pricing, your target customer, and your revenue mechanics, not just a vague dollar amount.
VCs consistently prefer bottom-up because it forces you to define who you're selling to and what you're charging. Top-down lets you hide behind analyst reports.
How to Calculate Market Size
Both methods with real numbers.
Bottom-Up Example (B2B SaaS)
Say you're building compliance software for mid-market financial services firms:
- Target businesses: 52,000 firms matching your ICP - financial services, 50-500 employees, US-based
- Annual contract value: $12,000/year
- TAM: 52,000 × $12,000 = $624M
Now narrow it. Your SAM is the 18,000 firms in the three states where you have sales coverage, using legacy compliance tools. That's $216M. Your SOM is what you can realistically close in year one - maybe 200 deals based on your team's funnel capacity. That's $2.4M.

The power of bottom-up is that every number is auditable. An investor can challenge "52,000 firms" and you can show the database filter. They can challenge "$12,000 ACV" and you can point to pricing research or early customer contracts. This is exactly how to size a new market when you don't have years of historical data - start with observable, countable inputs.
Top-Down Example (Marketplace)
Start with an analyst number: the US hotel booking market is $200B annually. Apply chain ratio filters - 40% is leisure travel, 60% is booked online, and your platform's take rate is 12%.
$200B × 0.40 × 0.60 × 0.12 = $5.76B TAM
Notice the take-rate correction. A common mistake is claiming the entire $200B as your market when you only capture a percentage of each transaction. Your TAM is the revenue you'd earn, not the gross merchandise volume flowing through the platform.
And please - never say "we just need 1% of the market." Investors hear that line ten times a week. It communicates nothing about how you'll actually acquire customers.
That bottom-up number is only as good as your customer count. Prospeo's B2B database lets you filter 300M+ profiles by industry, headcount, geography, and 30+ other criteria - giving you an auditable ICP count in minutes, not weeks.
Turn your market sizing slide from a guess into a filter query.
Where to Find the Data
You don't need an expensive Gartner report. Government data is free, B2B databases often start free, and the math is multiplication.
Free Government Sources
| Source | What It Provides | Use Case |
|---|---|---|
| NAICS codes | Industry classifications | Group industries, count firms |
| U.S. Census Bureau | Business counts, demographics | Regional segmentation |
| Bureau of Labor Statistics | Employment by role/industry | Quantify B2B personas |
| County Business Patterns | Establishments by county | Geo-based territory sizing |
| Bureau of Economic Analysis | GDP, economic indicators | Macro market context |
Paid and Self-Serve Sources
| Source | Approx. Cost | Best For |
|---|---|---|
| Crunchbase | Free limited; Pro ~$49/mo | Startup/funding benchmarking |
| Statista | Free limited; ~$99/mo | Quick industry stats |
| IBISWorld | ~$500-$1,200/report | Deep industry reports |
| Gartner/Forrester/IDC | $2,000-$15,000/report | Authoritative niche forecasts |
| PitchBook | ~$20,000+/yr | VC/PE deal data, financials |
For bottom-up B2B sizing, the sticking point is always counting companies that match your ICP. We've found that filtering a B2B database like Prospeo by industry, headcount, revenue, technographics, and funding stage turns a guessing game into an actual addressable account count. Filter to your target segment, get the count, multiply by your ACV, and you've got a defensible TAM built on real company data rather than analyst estimates.
Mistakes That Kill Credibility
Here's the thing: your co-founder just dropped a Gartner number on the TAM slide - a huge "global SaaS market" figure - and your seed investor is going to laugh. Here's why, and what else to avoid.
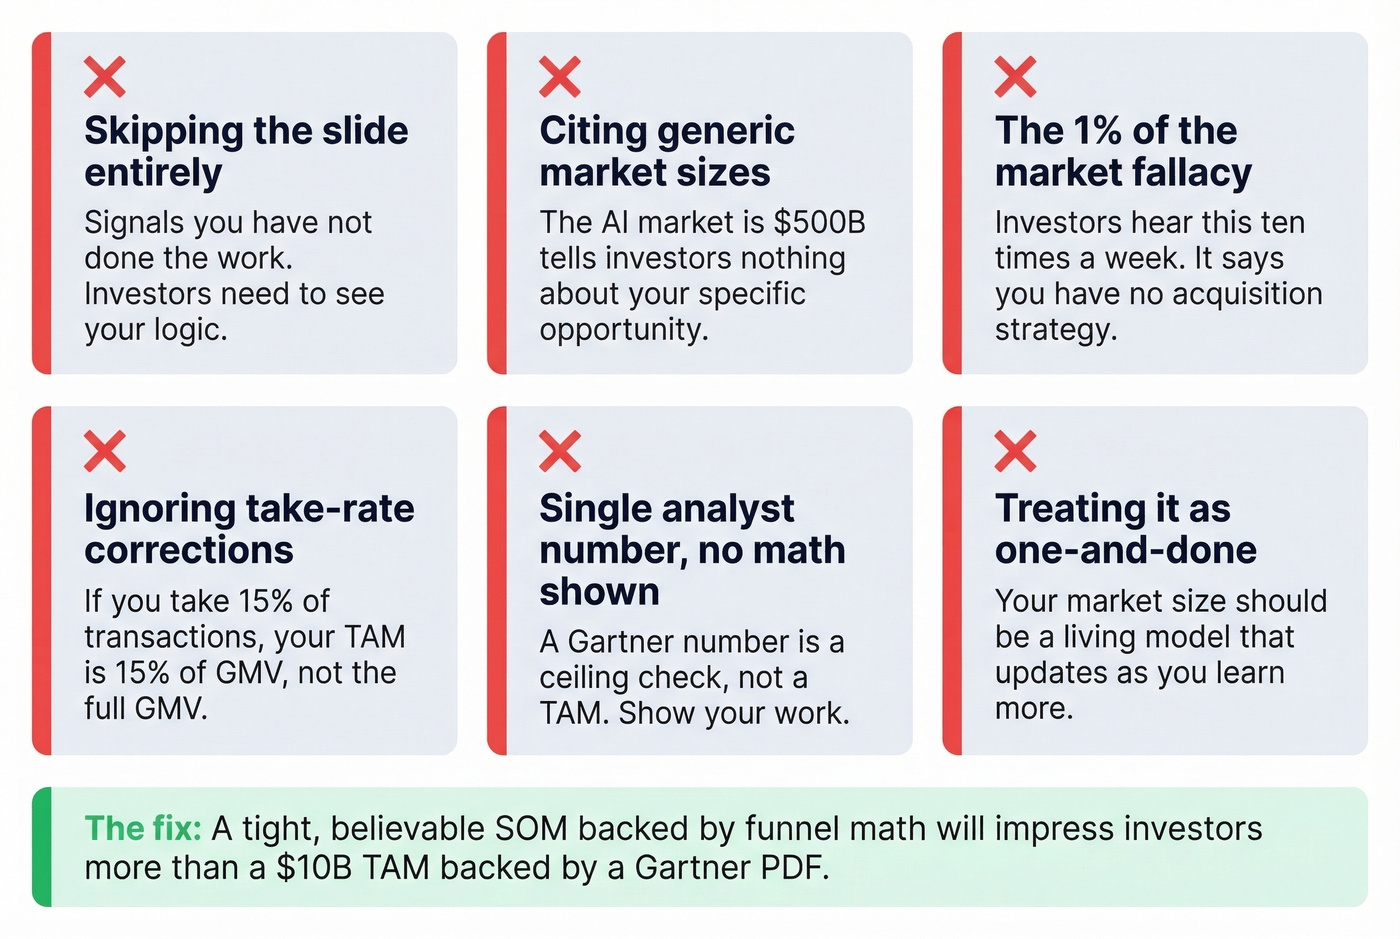
Not including market size at all. Investors need to see your logic for target audience and monetization. Skipping the slide signals you haven't done the work.
Using generic market sizes. "The AI market is $500B" tells an investor nothing about your specific opportunity. Size the vertical spend relevant to your product.
The "1% of the market" fallacy. The single fastest way to lose credibility. It implies you have no customer acquisition strategy.
Ignoring take-rate corrections for marketplaces. If you're a platform taking 15% of transactions, your TAM is 15% of GMV - not the full GMV. We've seen founders inflate their market by multiples with this mistake alone.
Citing a single analyst number without showing your work. A Gartner number is a ceiling check, not a TAM.
Stacking assumptions without bounding uncertainty. Three or four assumptions, each with its own range, can swing the final number dramatically. This is the anxiety founders voice constantly on r/Entrepreneur and r/consulting - and the fix is simple: bound each assumption with a high/low range and show the spread.
Treating the exercise as one-and-done. Your market size should be a living model that updates as you learn more about customers, pricing, and win rates.
Look - most early-stage founders over-invest in TAM precision and under-invest in SOM realism. A tight, believable SOM backed by funnel math will impress investors more than a $10B TAM backed by a Gartner PDF. The number that matters is the one you can actually go get.
How to Validate Your Numbers
A single market size number is a guess. Three converging estimates are a model.
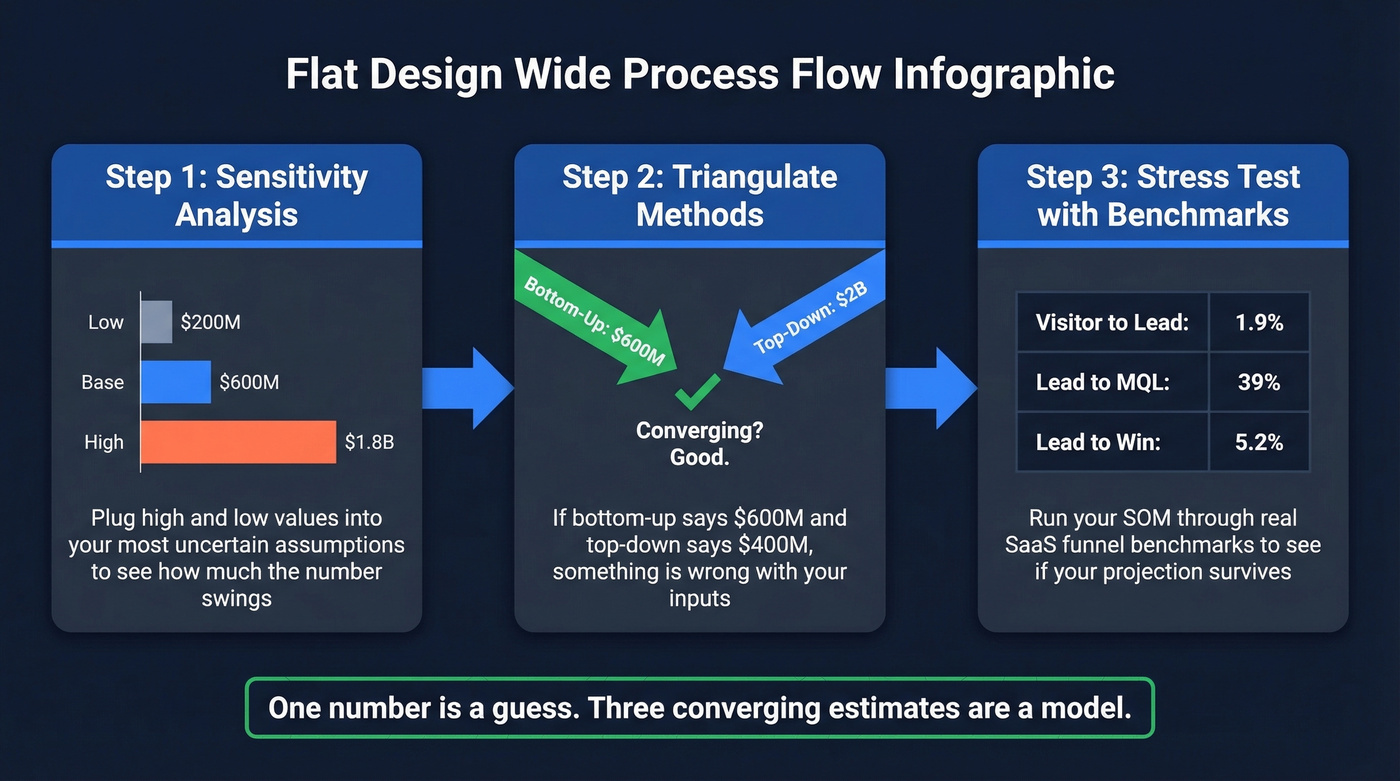
Run a sensitivity analysis first: take your most uncertain assumptions and plug in high/low values. If your TAM swings from $200M to $1.8B depending on one assumption about adoption rate, that assumption needs more research before you present the number.
Then triangulate. Estimating the same variable using two or three different approaches narrows the range substantially. If your bottom-up says $600M and your top-down ceiling says $2B, you're in a reasonable range. If bottom-up says $600M and top-down says $400M, something's wrong with your inputs.
For advanced validation, the Delphi method - structured expert interviews that converge on consensus - and regression analysis using predictors like GDP growth or industry employment can fill gaps where data is thin.
SOM Reality Check: SaaS Benchmarks
If you're sizing a SaaS market, your SOM projection needs to survive contact with real funnel benchmarks:
| Metric | Benchmark |
|---|---|
| Visitor → Lead | 1.9% |
| Lead → MQL | 39% |
| Lead → Win | 5.2% |
| Annual Churn | 5.2% |
| LTV:CAC | 6:1 |
If your SOM projection implies win rates 3× above these benchmarks, your model is broken. Work backward from realistic conversion rates and your actual sales team capacity. A five-person SDR team can only generate so many qualified opportunities per quarter - that's your real SOM constraint, not a percentage of SAM.
From Slide Deck to GTM Execution
Market sizing isn't a slide you build once and forget. It's the foundation for territory planning, account tiering, and resource allocation.
The connection is direct: once you've sized your SAM and identified the companies in it, you tier them by ICP fit and allocate sales resources accordingly. This is where your addressable market estimate becomes operational - it determines how many reps you hire, which territories you open, and how you sequence your launch. PartnerStack demonstrated this by scoring and tiering accounts across 40+ signals, resulting in a 34% drop in cost per pipeline dollar and a 58% increase in pipeline value. That's what happens when sizing feeds directly into execution instead of sitting in a forgotten deck.
Teams that treat their market model as a living document - updating it quarterly with new win/loss data, pricing changes, and expansion into adjacent segments - consistently outperform those who treat it as a fundraising checkbox. Your seed-stage TAM should look materially different by Series A, because you'll have real data replacing assumptions.
You just sized the market. Now reach it. Prospeo gives you 98% accurate emails and 125M+ verified mobiles for the exact companies in your SAM - starting at $0.01 per email, with no contracts and no sales calls required.
Go from TAM slide to booked meetings without switching tabs.
FAQ
What's the difference between top-down and bottom-up market sizing?
Top-down starts with a large industry number and narrows it through assumption-based filters; bottom-up counts target customers and multiplies by annual price. Bottom-up is more defensible because investors can verify both inputs. Top-down is useful as a ceiling check - if your bottom-up number exceeds the top-down estimate, revisit your assumptions.
How do I estimate SOM without sales data?
Model it through funnel capacity: realistic lead volume × conversion rates × average deal size. Use SaaS benchmarks as guardrails - 1.9% visitor-to-lead, 5.2% lead-to-win. If your SOM implies conversion rates far above industry norms, the number won't hold up. Never default to the "1% of the market" shortcut.
What tools help with bottom-up B2B sizing?
Free government data from the Census Bureau, BLS, and County Business Patterns gives you macro counts and industry segmentation. For filtering companies by ICP attributes like headcount, revenue, and tech stack, a B2B database with granular filters turns estimates into actual addressable account counts. Paid analyst reports from Gartner or IBISWorld add third-party validation for niche forecasts.
Why does market sizing matter for GTM planning?
It ensures you allocate budget and headcount against a realistic opportunity, not a fantasy number. When your addressable market is grounded in actual company counts and verified ACV, you can build territory plans, set quota, and forecast pipeline with confidence. Without it, you're guessing at how many reps to hire and which segments to prioritize.