Win Rate vs Close Rate: The Real Difference (and What to Track)
Why the Numbers Never Match
You're in a QBR, and three people use three different numbers to describe "how well we're closing." One says 47%. Another says 22%. The CFO's spreadsheet says 31%. Nobody's wrong - they're just measuring different things with different denominators. That confusion around win rate vs close rate costs more than you'd think, because teams end up coaching to the wrong metric and forecasting off fantasy numbers.
The industry hasn't standardized definitions. Some orgs calculate win rate from all leads, others start from qualified opportunities, and still others use only deals that reached the proposal stage. Industry content reflects this mess - you'll find guides that swap the two terms or use identical denominators for both.
Until your team picks a denominator and sticks with it, every benchmark comparison is noise.
The One-Sentence Answer
- Win rate = deals won / qualified opportunities. It measures sales execution - how well reps convert real pipeline.
- Close rate = deals closed / total leads. It measures the full funnel, including unqualified volume that never should've been there.
If you only track one, track win rate with a qualified-opportunity denominator. It's cleaner, more coachable, and harder to game by stuffing the top of funnel.
Definitions and Key Differences
| Win Rate | Close Rate | |
|---|---|---|
| Measures | Sales execution | Full-funnel conversion |
| Denominator | Qualified opps (or proposals/quotes) | All leads |
| Best for | Coaching, forecasting | Diagnosing lead quality |
| Common mistake | Excluding no-decisions | Mixing lead/opp denominators |
Outreach's breakdown frames it well: close rate looks at every lead entering the funnel, while win rate focuses on deals that've been vetted. Your org will define "qualified" differently - SAL, SQL, or proposal-stage - but the principle holds. Pick one stage, document it, and don't let anyone compare numbers across different denominators.
Some teams also use an opportunity close rate definition: closed opportunities divided by opportunities created. That's useful inside a CRM, but it isn't the same as a lead-based close rate.
How to Calculate Each Metric
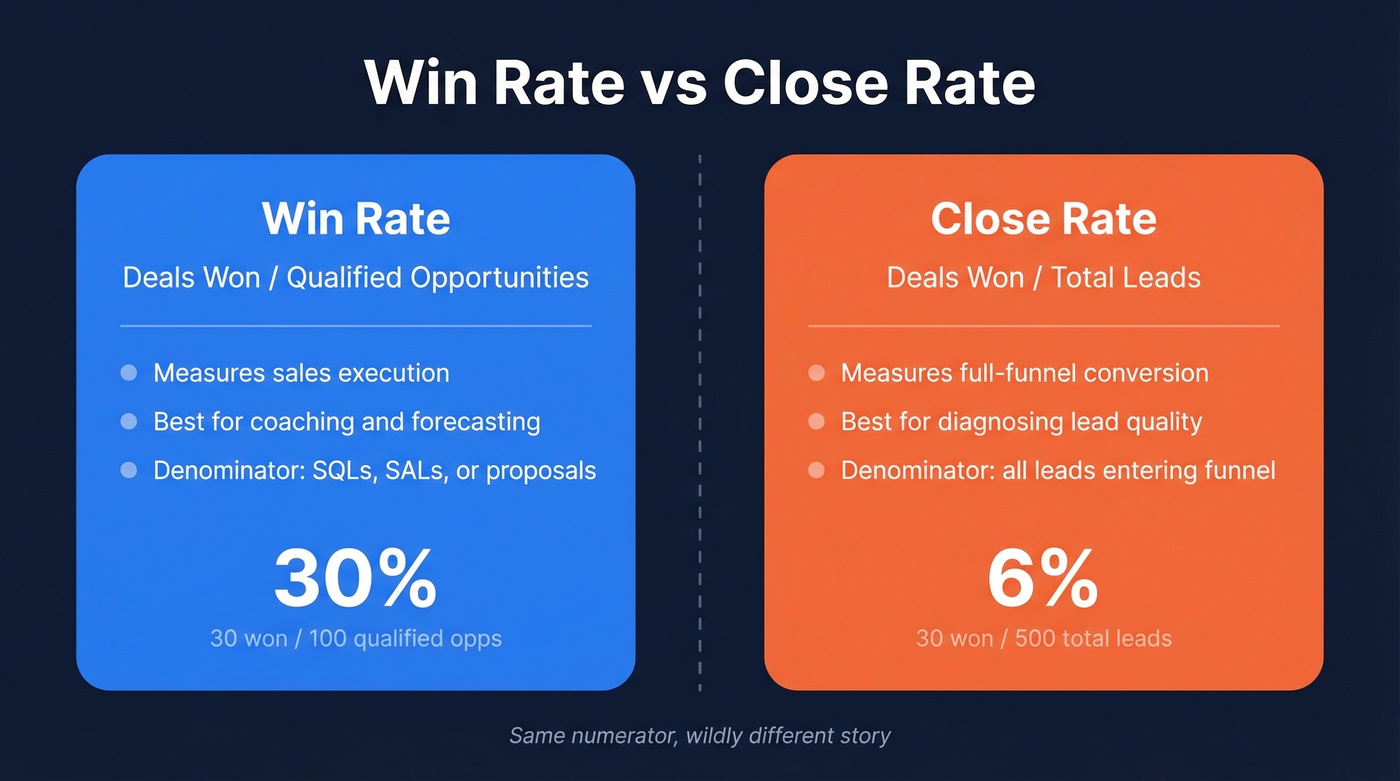
Let's walk through a real example. Your team generated 500 leads last quarter. Of those, 100 became qualified opportunities. You closed 30 deals.
Win rate formula: 30 won / 100 qualified opps = 30%
Close rate formula: 30 won / 500 total leads = 6%
Same numerator. Wildly different story. The win rate tells you reps are converting at a healthy clip once they get real pipeline. The close rate tells you most of your leads aren't making it to the table - a marketing problem, a qualification problem, or both. Report only the 30% and you miss the funnel leak. Report only the 6% and you panic about rep performance when the real issue is lead quality.
The Denominator Debate
Here's the thing: that 47% average win rate everyone cites uses "opportunities proposed or quoted" as the denominator. That's proposal/quote-stage, not all pipeline. If you're calculating from all created opportunities and comparing yourself to 47%, you're measuring against a narrower funnel than you think.
Use proposal/quote-stage denominator to benchmark against that widely-cited RAIN Group data and measure competitive effectiveness late in the cycle.
Use qualified-opportunity denominator for a broader view that catches deals dying before they reach proposal.
Skip the "all leads" denominator for win rate entirely. That's close rate territory. Mixing them is how you end up with three different numbers in a QBR.
A 30% win rate means nothing when half your pipeline is built on bad contact data. Teams using Prospeo's 98% verified emails cut bounce rates below 4% and tripled pipeline - because every qualified opportunity starts with reaching the right person.
Stop losing deals before the first email even lands.
The Hidden Third Outcome
Most win/loss analyses pretend every deal ends in a decision. They don't. Research from CSO Insights puts 20-60% of qualified pipeline in "no decision" territory, with enterprise software often exceeding 40%.
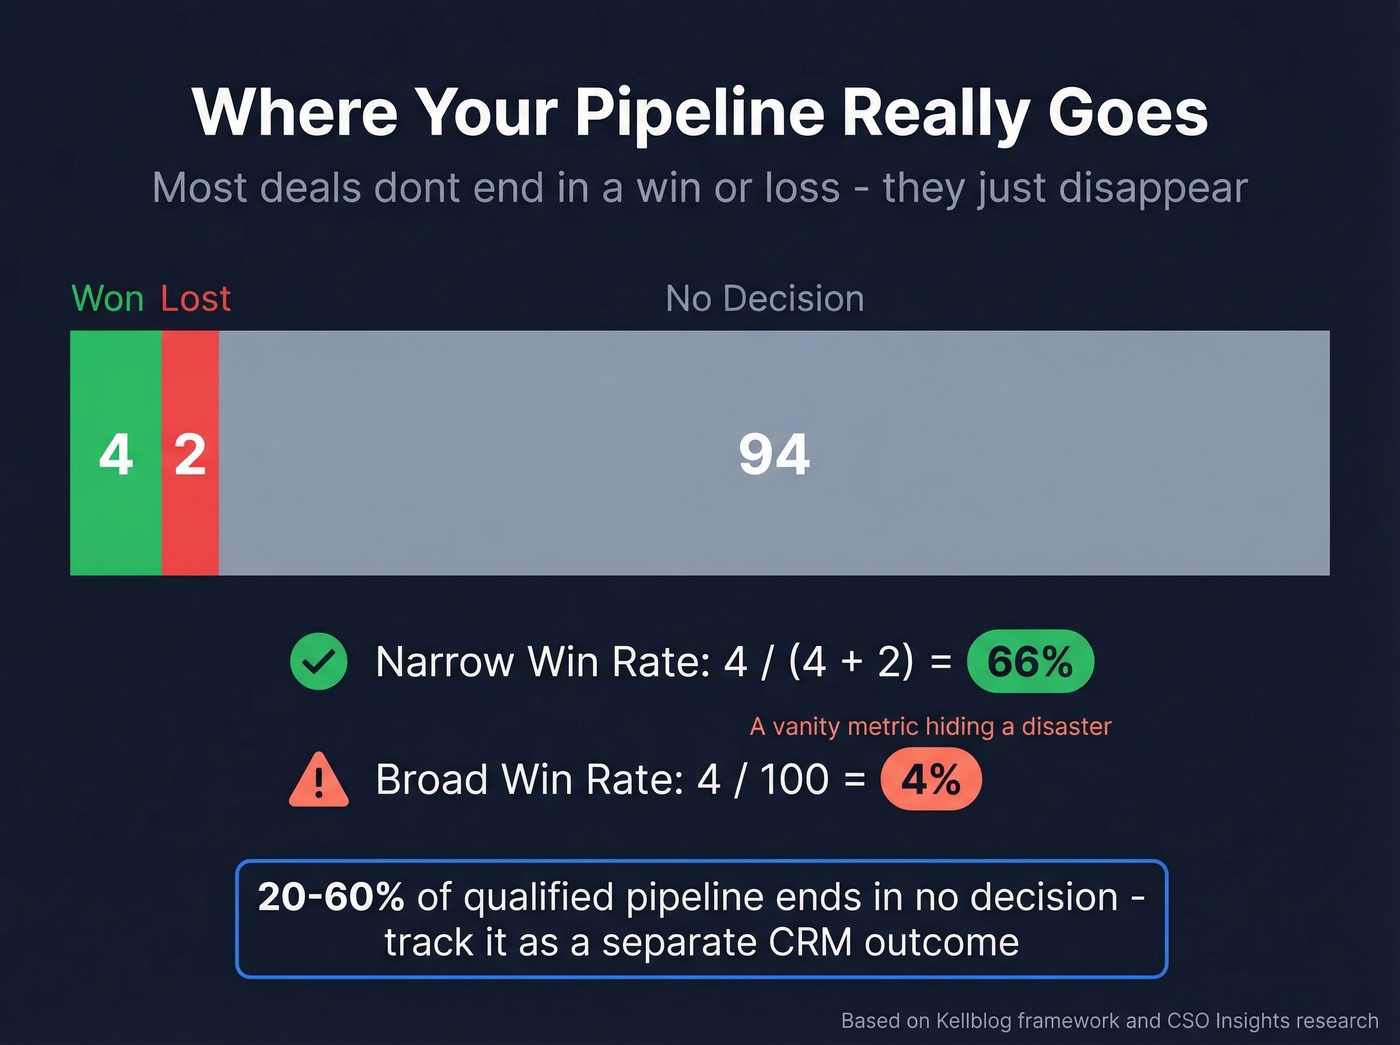
A widely-circulated benchmark stat: 60% of "lost" deals are actually no-decisions, not competitive losses.
Kellblog's framework makes this concrete. A team won 4 deals, lost 2, and had 94 derail or go silent. Narrow win rate (wins divided by wins plus losses) = 66%. Looks great. Broad win rate (wins divided by all outcomes) = 4%. That's a disaster hiding behind a vanity metric.
Kellblog also distinguishes milestone analysis - counting deals hitting stages in a period - from cohort analysis, which tracks a group of opportunities created in Q1 through to their final outcomes. Cohort analysis is slower but far more accurate for planning because it automatically accounts for derails and slippage that milestone snapshots miss.
If you're not tracking no-decision as a separate outcome in your CRM, your win rate is lying to you.
Benchmarks (Use Carefully)
| Source | Metric | Number | Denominator |
|---|---|---|---|
| RAIN Group (n=472) | Avg win rate | 47% | Proposals/quotes |
| RAIN Group tiers | Elite / Top / Rest | ~75% / 62% / 40% | Proposals/quotes |
| Forecastio SaaS | SMB / Mid / Ent | 30-40% / 25-35% / 20-25% | Closed opportunities (won/lost) |
| Outreach 2026 | Within 50 days | 47% | Platform data |
| Outreach 2026 | After 50 days | <=20% | Platform data |
| Cross-industry | Solid close rate (qualified leads) | ~20-30% | SQLs / qualified leads |
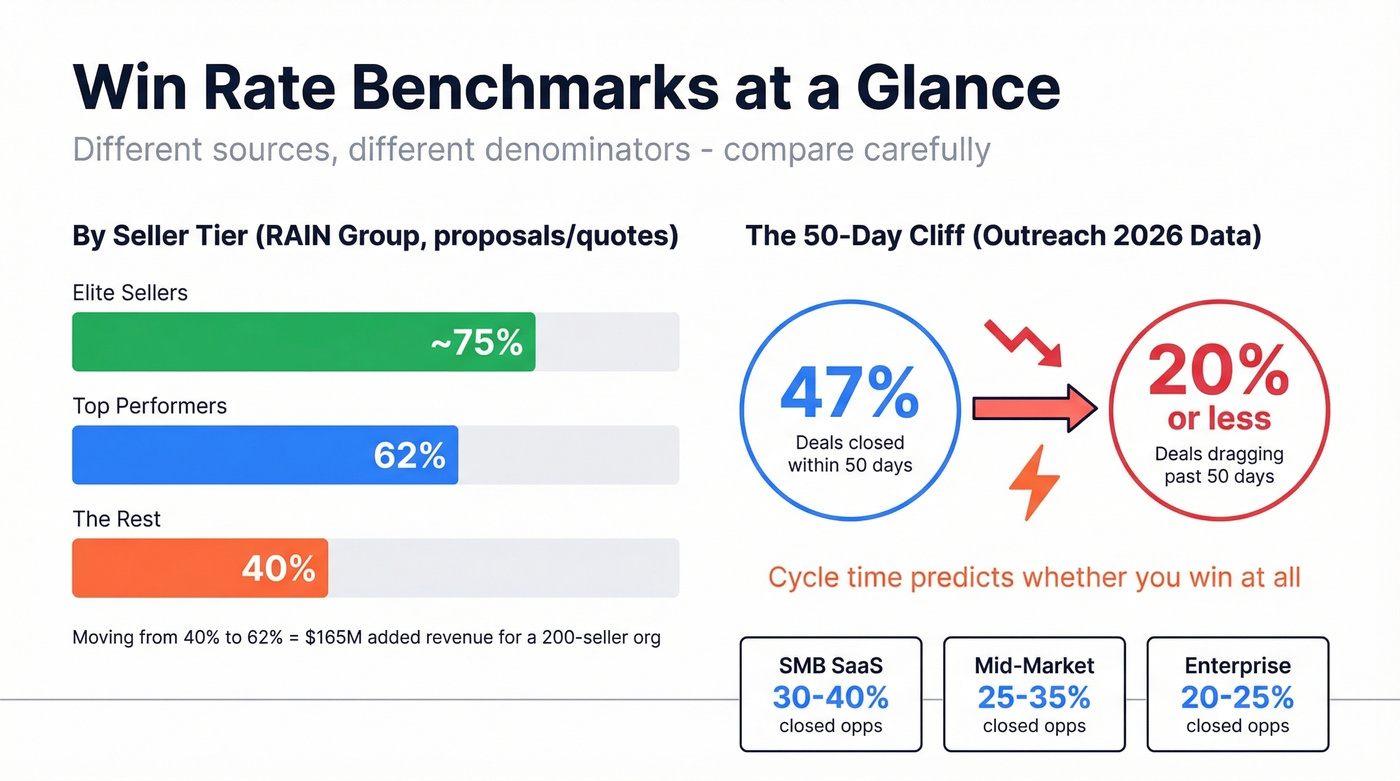
Two things jump out. First, the 47% benchmark from proposals and the 47% from platform data use different denominators - don't average them. Second, the platform data reveals a brutal cliff: deals that drag past 50 days see conversion collapse to 20% or lower. Cycle time isn't just an efficiency metric. It's a predictor of whether you'll win at all.
On r/sales, one common baseline for opp-to-closed-won conversion is around 32% for mixed inbound/outbound pipeline. It's a useful gut-check if you're wondering whether your team's numbers are in the ballpark.
The revenue math from RAIN Group is staggering - a 200-seller org moving from 40% to 62% adds $165M in annual revenue (55% growth) without hiring a single rep. Most teams obsess over top-of-funnel volume when the real upside is conversion.
Which Metric to Report
Report win rate to sales leadership. It's the coaching and forecasting metric. Use a qualified-opportunity denominator, but lock down what "qualified" means and audit stage movement so the metric can't be gamed by over-disqualifying.
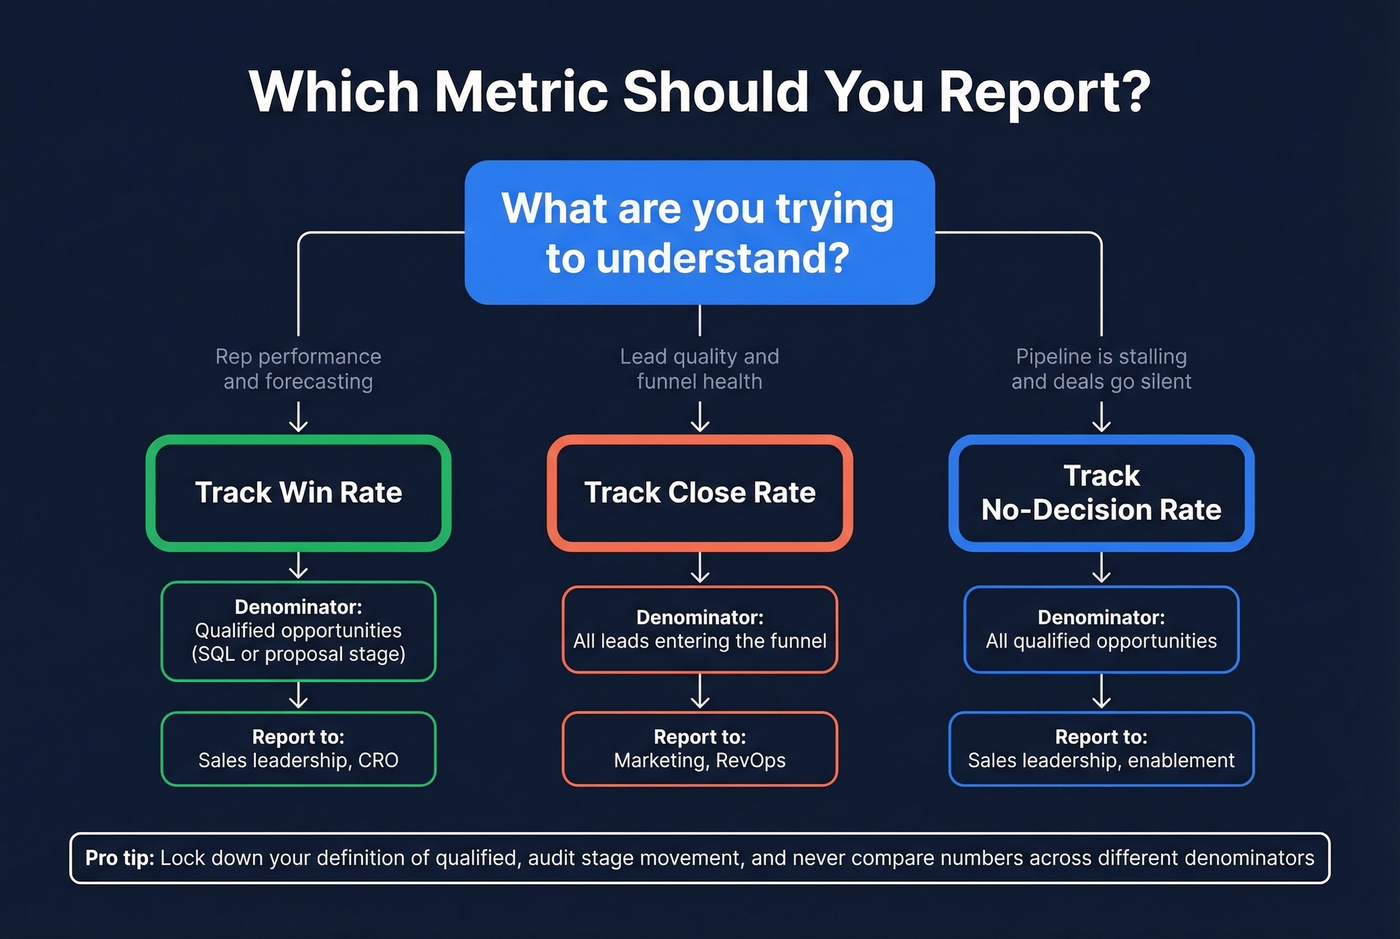
Use close rate to diagnose lead quality. If close rate is tanking but win rate is stable, your problem is upstream - marketing, SDR qualification, or ideal customer profile drift.
Track no-decision rate as a third KPI when pipeline is stalling. We've seen teams discover that 40%+ of their "pipeline" is zombie deals that'll never close. That changes the forecast conversation entirely.
Pull It From Your CRM
HubSpot: Use a dataset-calculated formula for win rate:
DISTINCT_COUNT(IF([DEAL.hs_is_closed_won]=TRUE,[DEAL.hs_object_id],NULL)) / DISTINCT_COUNT(IF([DEAL.hs_is_closed_count]=1,[DEAL.hs_object_id],NULL))
One limitation worth knowing: reports built with datasets can't apply dashboard filters, per HubSpot community threads. You'll need separate reports per segment instead of one filterable dashboard. Plan for it.
Salesforce: Create an Opportunities report filtered to Closed Won and Closed Lost. Group by owner or segment. For no-decision tracking, add a Closed Reason picklist value so "no decision" is a first-class outcome instead of a deal that just rots in pipeline forever.
How to Improve Both Metrics
Shorten cycle time ruthlessly. Deals closed within 50 days convert at 47%; after 50 days, 20% or lower. Build stage-duration alerts in your CRM. This single change has more impact than most pipeline reviews.
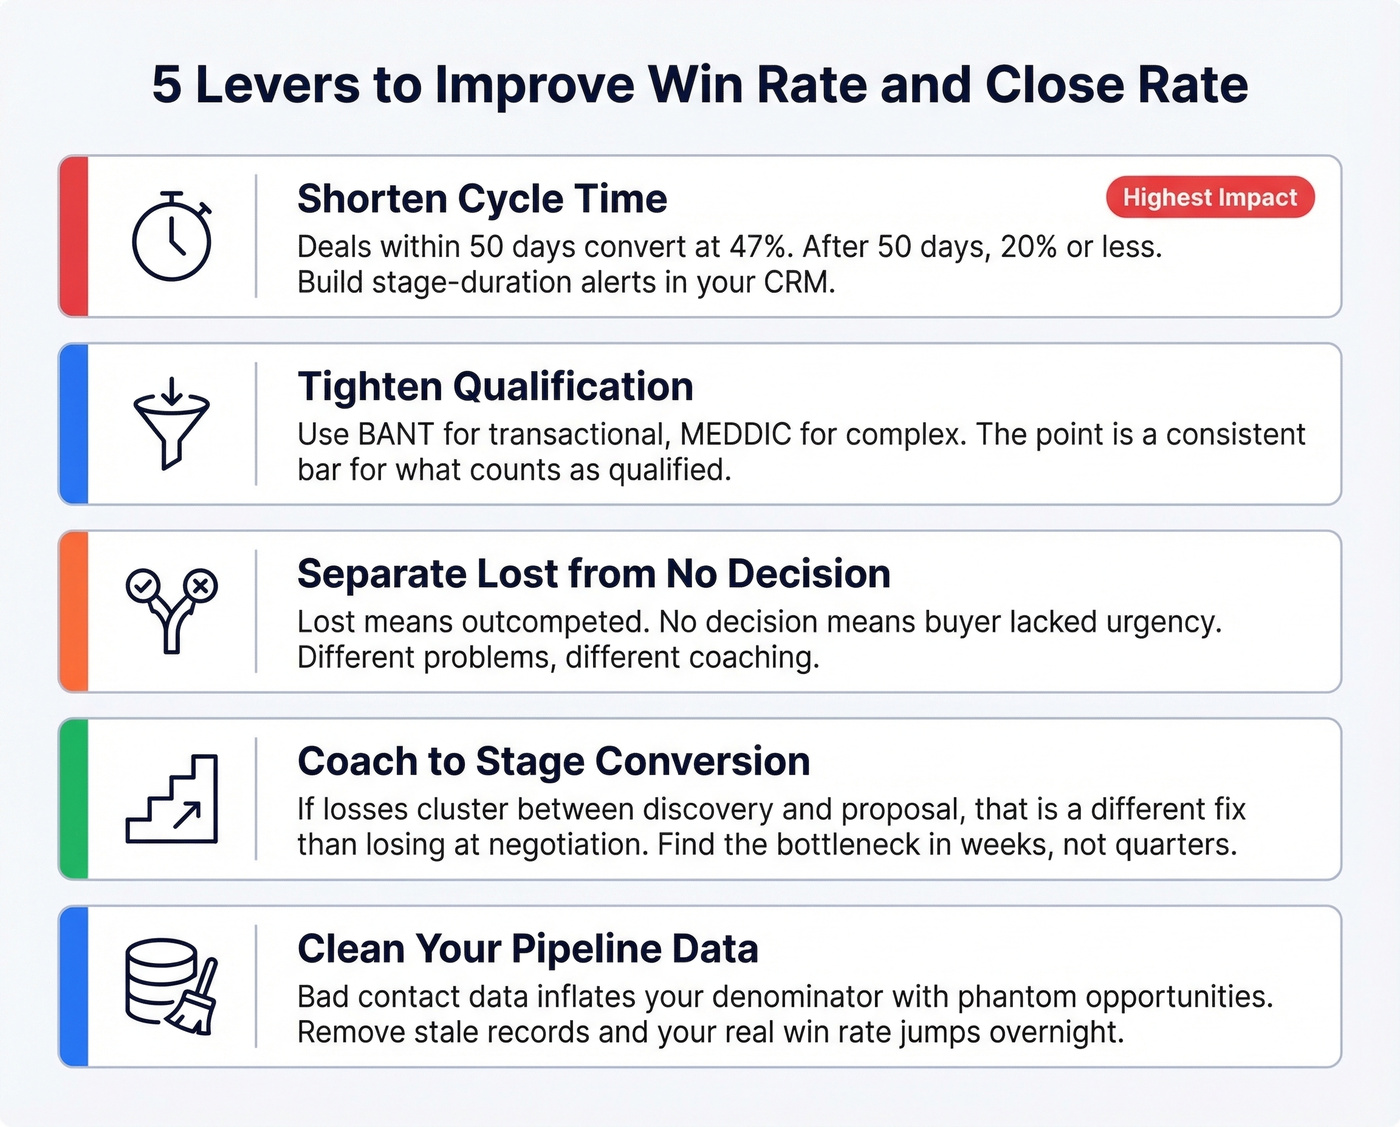
Tighten qualification frameworks. BANT for transactional deals, MEDDIC or MEDDPICC for complex sales. The point isn't which framework - it's that reps have a consistent bar for what counts as "qualified."
Separate "lost" from "no decision." A lost deal means you got outcompeted. A no-decision means the buyer lacked urgency or internal alignment. Different problems, different coaching.
Coach to stage conversion, not just outcomes. If most of your losses happen between discovery and proposal, that's a different fix than losing at negotiation. In our experience, teams that track stage-to-stage conversion find the bottleneck in weeks instead of quarters.
Clean your pipeline data. Bad contact data inflates your denominator with phantom opportunities - deals attached to bounced emails, wrong numbers, and contacts who left months ago. We've seen teams shave 15-20% off their opportunity count just by removing stale records, and their "real" win rate jumps overnight because the denominator finally reflects actual pipeline.
Run your opportunity contacts through Prospeo's verification to strip out invalid emails and dead records. When 98% email accuracy replaces high bounce rates, your win and close rates reflect reality instead of fiction. (If you want a broader stack view, compare data enrichment services and SDR tools that support ongoing hygiene.)
That 47% benchmark assumes reps are actually reaching decision-makers. Prospeo gives you 300M+ verified profiles with 30+ filters - buyer intent, job changes, headcount growth - so your denominator is full of real opportunities, not dead leads.
Build pipeline worth measuring. Start free with 75 verified emails.
FAQ
Is win rate the same as close rate?
No. Win rate divides deals won by qualified opportunities, measuring how well reps convert vetted pipeline. Close rate divides closed deals by total leads, capturing full-funnel conversion. A team can have a 35% win rate and a 7% close rate from the same quarter's data - same numerator, different denominators telling different stories.
Should no-decision count as a loss?
Track it separately. Counting it as a loss inflates your loss rate and hides buyer inertia. Excluding it inflates your narrow win rate. Kellblog's example shows a 66% narrow rate masking a 4% broad conversion. Give no-decision its own CRM status and report on it as a third metric.
How do I make win rate more accurate?
Standardize your opportunity definition so every rep uses the same qualification bar. Then clean your contact data - phantom pipeline built on bounced emails and departed contacts warps the denominator. Enrichment tools that verify records on a weekly refresh cycle keep your CRM reflecting who's actually reachable, not who was reachable six months ago.
What's a good win rate benchmark for SaaS?
For SaaS companies measuring from closed opportunities (won + lost), expect 30-40% at SMB, 25-35% mid-market, and 20-25% enterprise. If you're measuring from proposals or quotes, the RAIN Group average is 47%. Always confirm which denominator a benchmark uses before comparing it to your own numbers.