Win Rate vs Conversion Rate: What's the Difference and Why It Matters
Your VP of Sales says the win rate is 35%. Your CMO says conversion rate is 4%. The CEO looks at both numbers and asks why the pipeline isn't converting.
This confusion is real, and it costs teams weeks of misaligned reporting every quarter. Win rate and conversion rate aren't interchangeable terms - they measure different stages, use different denominators, and tell you different things about your business. Let's sort it out.
Side-by-Side Comparison
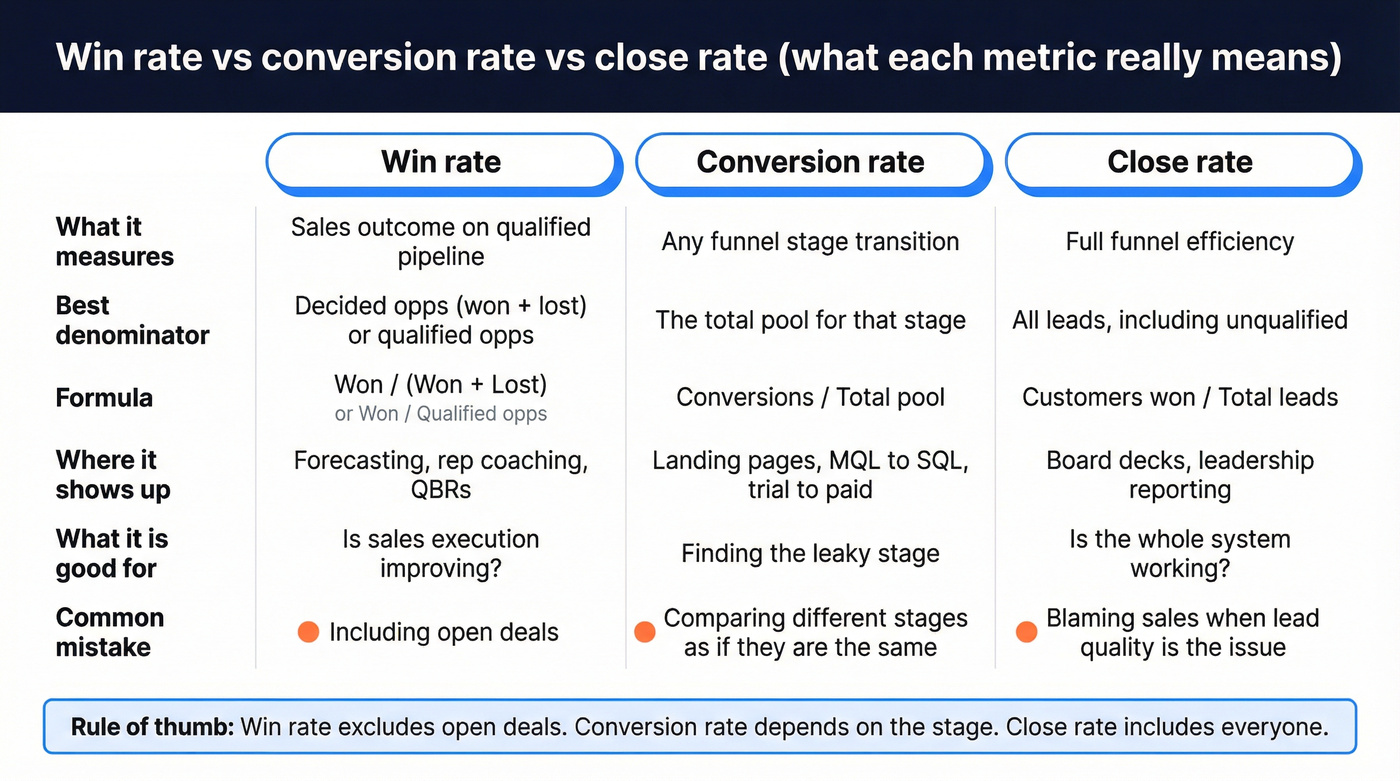
Most of the confusion comes from people using these terms loosely. Here's the precise breakdown, including close rate, which gets thrown into the mix constantly.
| Win Rate | Conversion Rate | Close Rate | |
|---|---|---|---|
| Definition | % of qualified pipeline that becomes Closed Won | % completing any desired action | % of total leads that become customers |
| Formula | Won ÷ (Won + Lost) x 100 or Won ÷ Qualified Opps x 100 | Conversions ÷ Total Pool x 100 | Customers Won ÷ Total Leads x 100 |
| Denominator | Decided opportunities (won+lost) or qualified opportunities | Visitors, leads, MQLs, SQLs, trials, etc. | All leads, including unqualified |
| Measures | Sales execution on qualified pipeline | Funnel stage efficiency | Full-funnel efficiency |
| Who uses it | Sales leaders, RevOps | Marketing, growth teams | Leadership, board reporting |
| When to use | Forecasting, rep coaching | Optimizing specific funnel stages | Evaluating full-funnel health |
The critical distinction: win rate is a sales outcome metric, and the standard rule is to exclude open or in-progress deals. Many teams calculate it on decided opportunities only (won ÷ (won + lost)). Others use a "qualified opportunities" denominator for coaching and forecasting. Either way, open deals don't belong in the calculation.
Conversion rate is broader. It can apply to any stage transition - visitor to lead, MQL to SQL, trial to paid.
Close rate sits between the two. It uses all leads as the denominator, which means it reflects lead quality as much as sales skill. A 5% close rate might mean your reps are struggling, or it might mean marketing is sending unqualified traffic. Win rate isolates sales performance by narrowing the denominator to qualified pipeline.
One more variation worth knowing: some teams calculate a value-based win rate - closed deal value divided by total opportunity value - rather than counting deals. This is useful when deal sizes vary wildly. A team that wins three $500K deals and loses ten $20K deals has a mediocre count-based win rate but an excellent value-based one.
The Denominator Debate
Here's the thing: your win rate is only as meaningful as your definition of "qualified opportunity." Outreach frames this as the "denominator debate," and it's the single biggest reason teams argue about metrics in pipeline reviews.
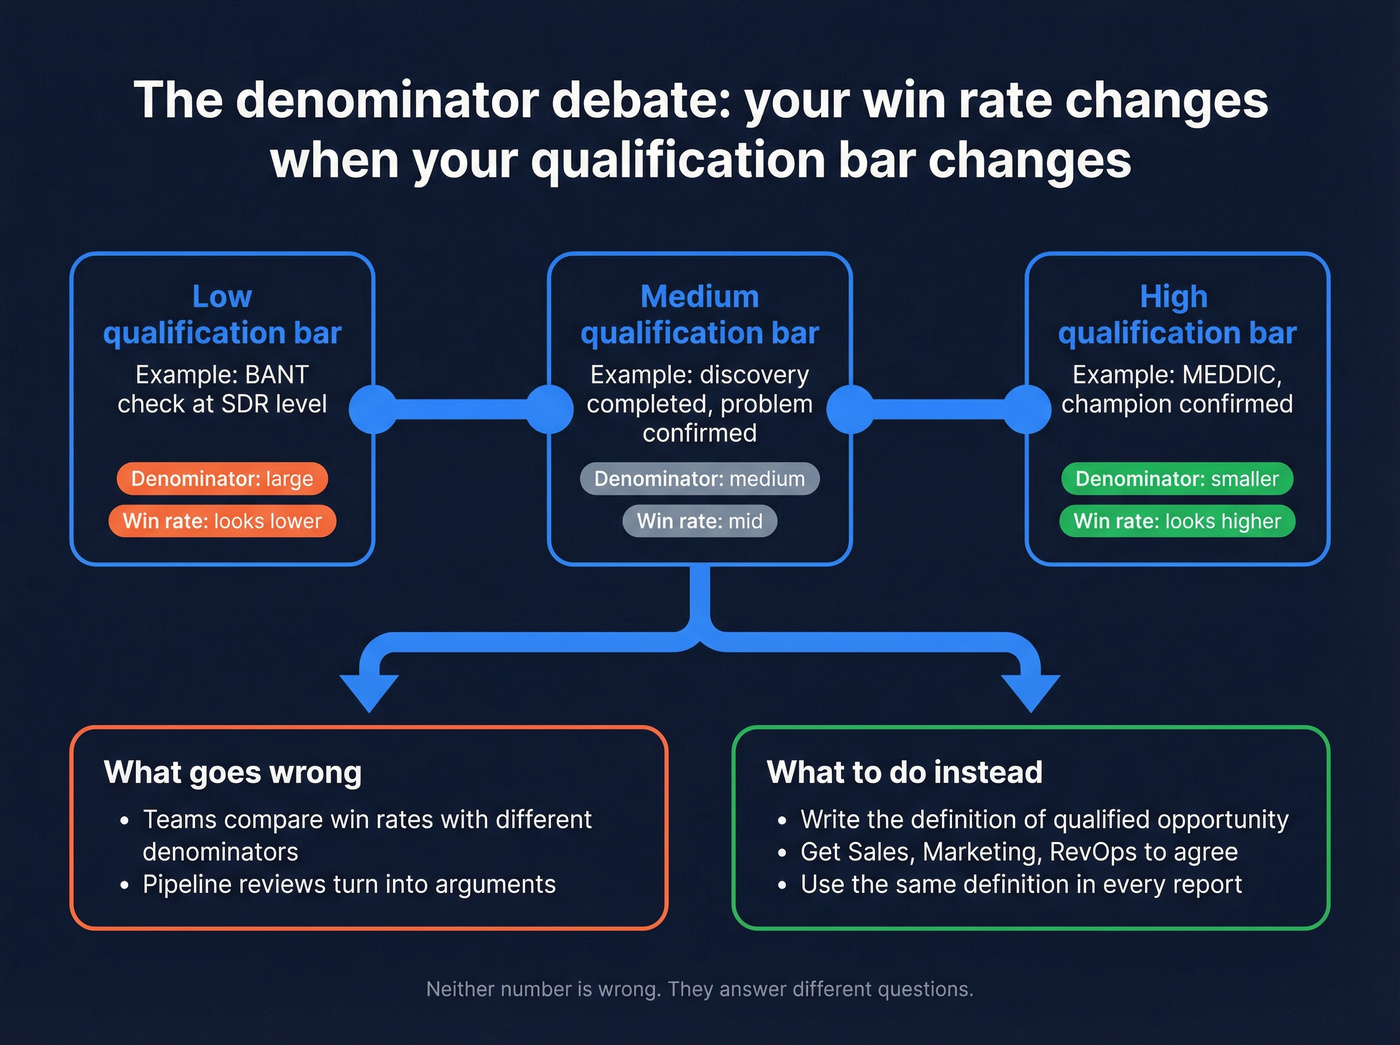
If your qualification bar is a BANT check at the SDR level, your denominator is large and your win rate looks lower. Run MEDDIC and only count opportunities that survive a discovery call with a confirmed champion? Your denominator shrinks and your win rate climbs. Neither number is wrong. They're measuring different things.
Stop obsessing over your win rate number. Start obsessing over your win rate definition. Document it. Make sure sales, marketing, and RevOps agree on what counts as a qualified opportunity before anyone runs a report.
Benchmarks That Actually Matter
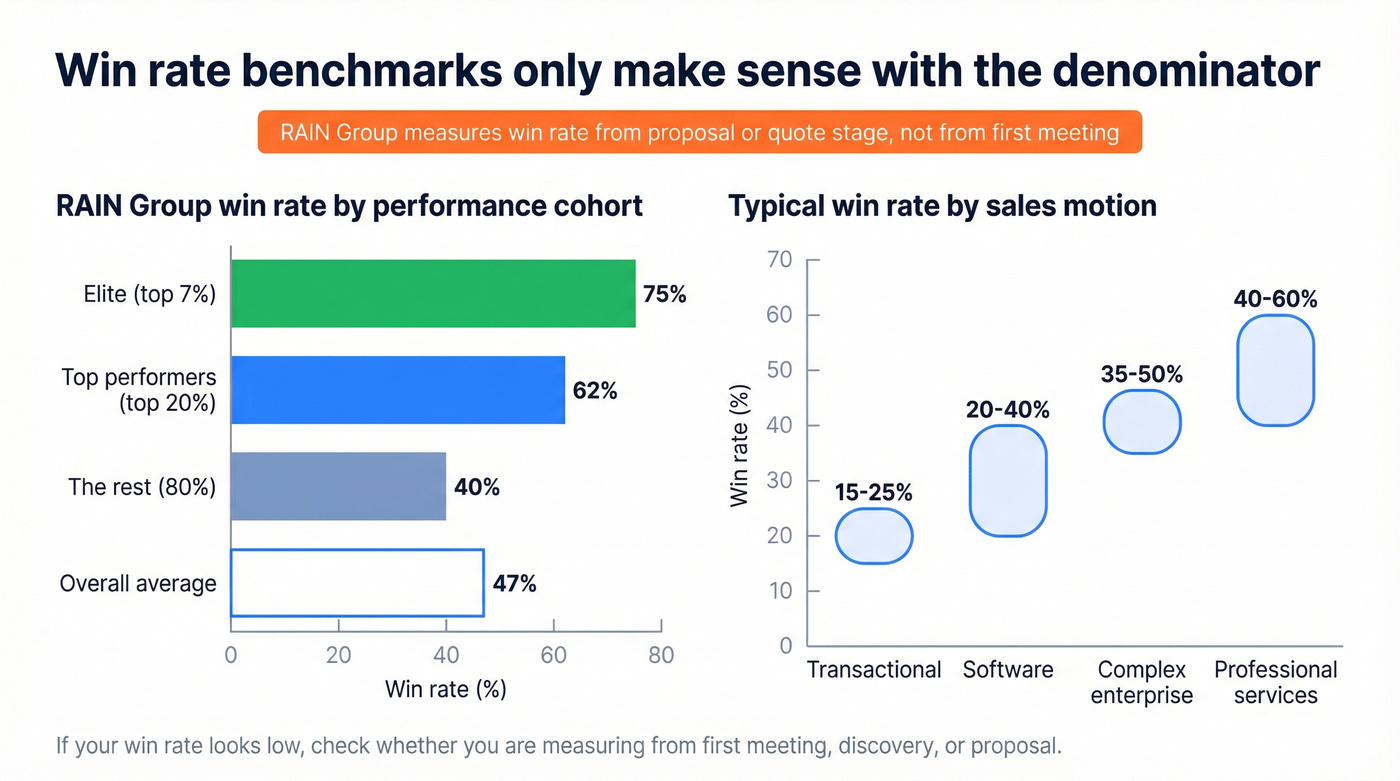
Raw benchmarks are useless without methodology. "Average win rate is 47%" means nothing until you know what's in the denominator.
The RAIN Group Study
The most cited B2B win rate benchmark comes from RAIN Group's research - a survey of 472 sellers and sales executives. Their definition: the percent of opportunities proposed or quoted that the organization won. That's a proposal-stage denominator, not all pipeline.
| Performance Cohort | Win Rate |
|---|---|
| Elite (top 7%) | ~75% |
| Top performers (top 20%) | 62% |
| The rest (80%) | 40% |
| Overall average | 47% |
If your team's win rate is 25% and you're comparing it to that 47% average, check your denominator first. RAIN measured from proposal stage. If you're measuring from first meeting, your number will naturally be lower.
By Sales Motion
| Sales Motion | Typical Win Rate |
|---|---|
| Transactional | 15-25% |
| Software | 20-40% |
| Complex enterprise | 35-50% |
| Professional services | 40-60% |
Conversion Rates by Funnel Stage
Win rate measures the end of your funnel. Conversion rate can measure any stage. First Page Sage's B2B SaaS benchmarks show how dramatically rates shift depending on where and how you measure:
| Stage | SEO | PPC | Webinar | ||
|---|---|---|---|---|---|
| Visitor to Lead | 2.1% | 0.7% | 2.2% | 1.3% | 0.9% |
| MQL to SQL | 51% | 26% | 30% | 46% | 39% |
| Opportunity to Close | 36% | 35% | 39% | 32% | 40% |
This is why a CMO reporting a 2% conversion rate and a VP Sales reporting a 36% win rate can both be right. They're measuring different stages of the same funnel.
Win rate problems often start before the first call. If 20% of your emails bounce, you're inflating your denominator with prospects who never saw your pitch. Prospeo delivers 98% email accuracy with 7-day data refresh - so every opportunity in your pipeline is real.
Stop losing deals to bad contact data before they even start.
How to Calculate Each Metric
Win Rate (decided-opps method):
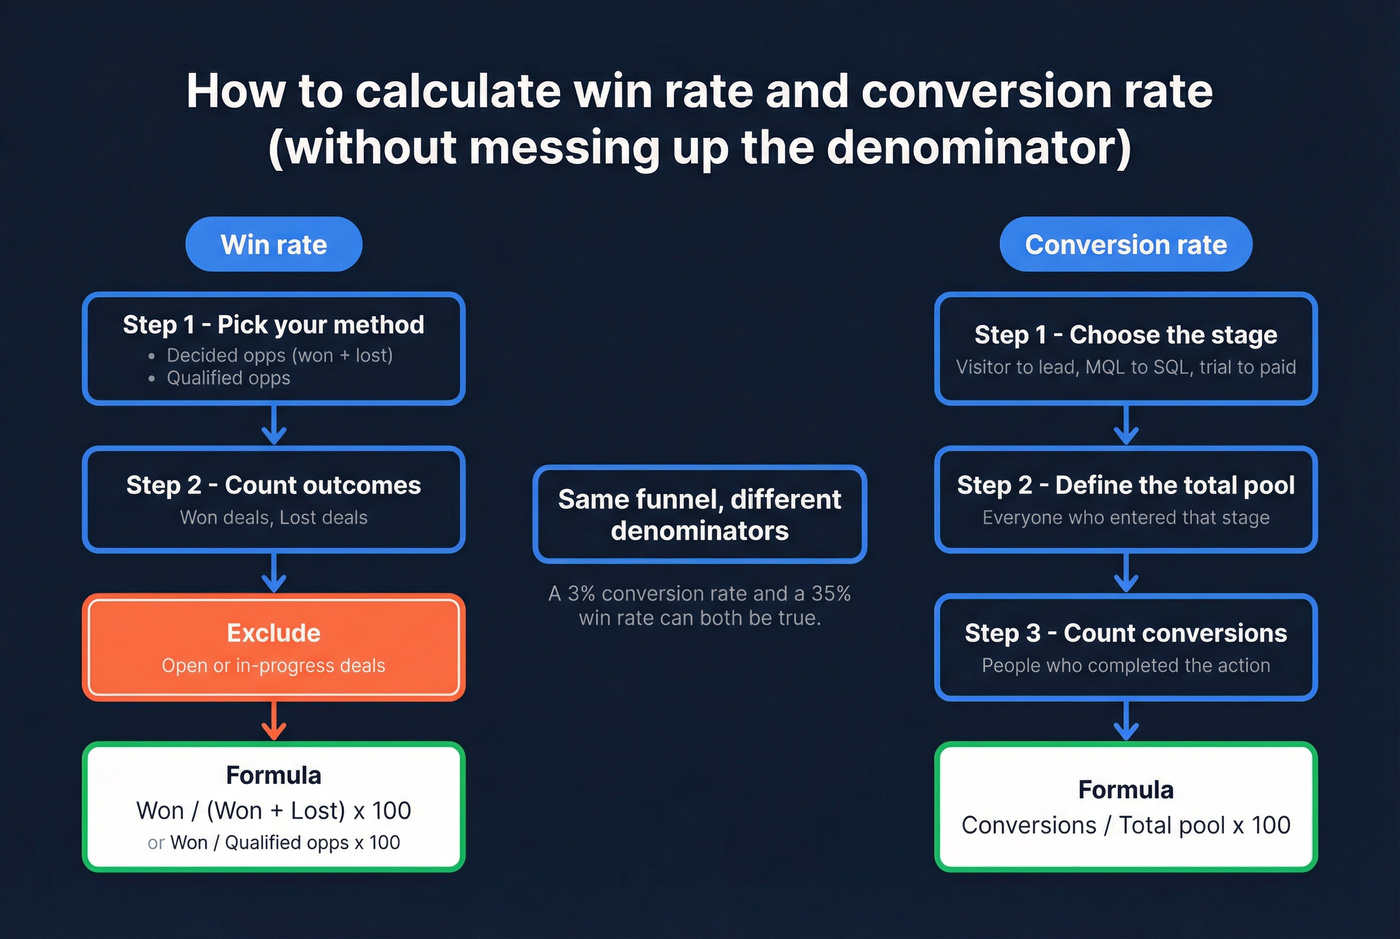
Won Deals ÷ (Won Deals + Lost Deals) x 100
This is the cleanest "did we win or lose?" view because it only counts opportunities that reached a final decision.
Win Rate (qualified-opps method):
Won Deals ÷ Qualified Opportunities x 100
Commonly used for forecasting and rep coaching, as long as your team has a consistent definition of "qualified opportunity."
Example: You won 50 deals from 200 qualified opportunities. 50 ÷ 200 x 100 = 25%. Exclude anything still open.
Conversion Rate:
Conversions ÷ Total Pool x 100
If 1,000 visitors hit your landing page and 30 booked a demo: 30 ÷ 1,000 x 100 = 3%. The "total pool" changes depending on which stage you're measuring.
The key rule: never include open or in-progress opportunities in your win rate calculation. Including them creates a number that fluctuates with pipeline volume rather than reflecting actual sales performance.
Common Measurement Mistakes
Including open opportunities in win rate. This is the most common error. Your win rate will look artificially low during high-growth periods when pipeline is expanding.
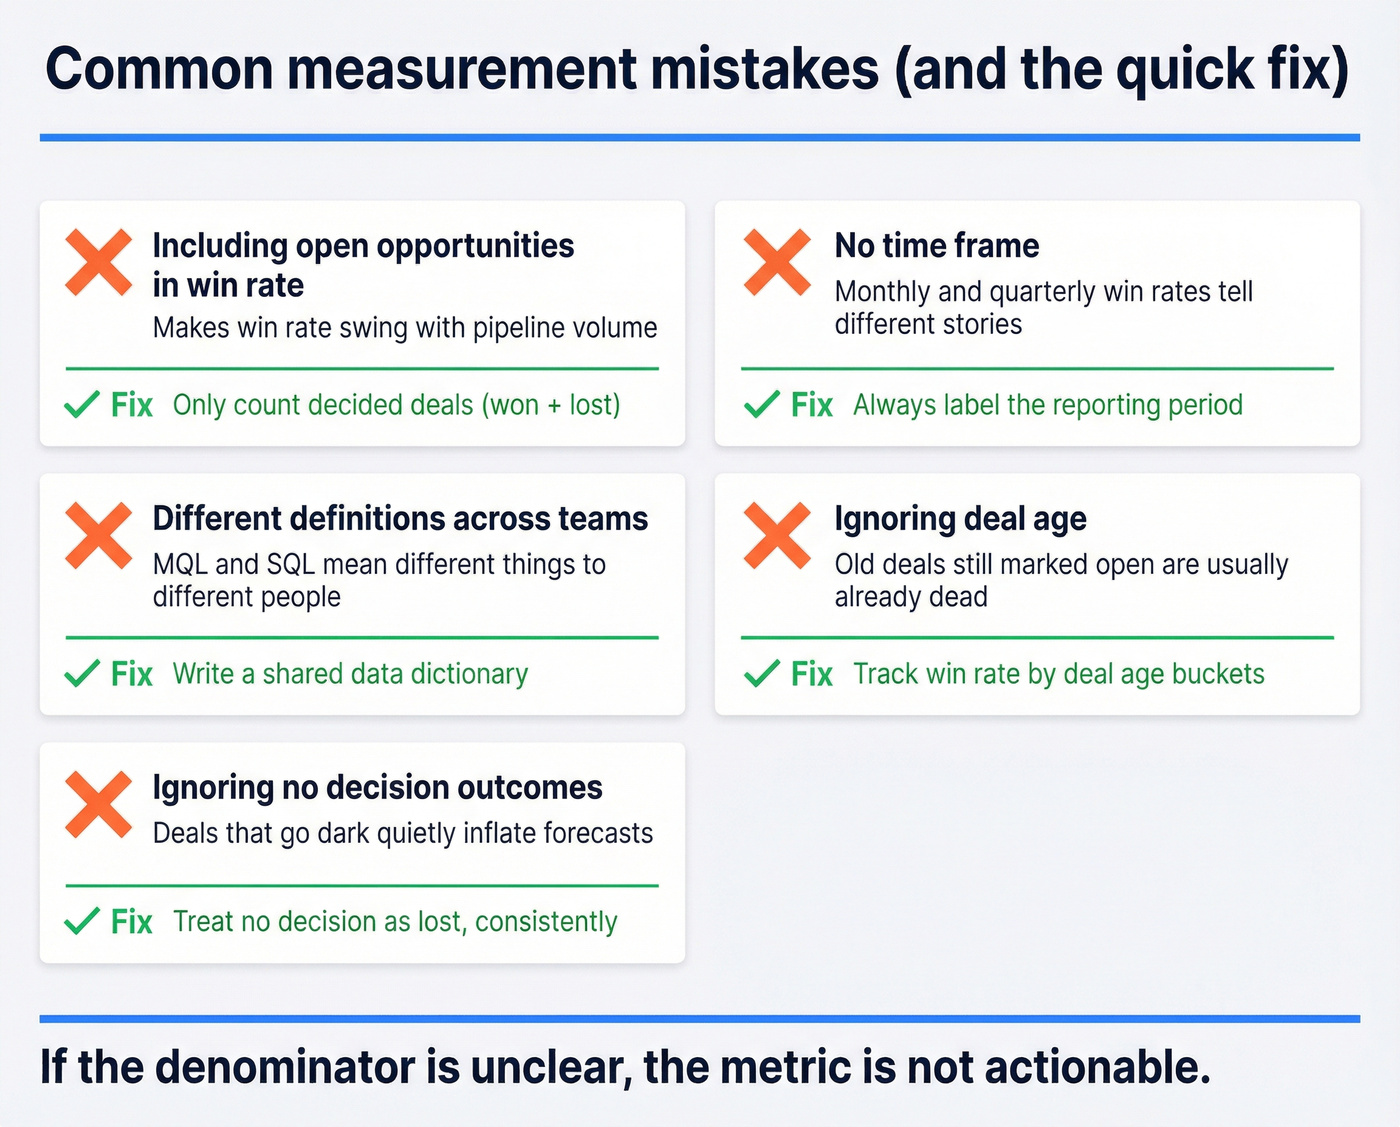
Inconsistent definitions across teams. If marketing counts MQLs differently than sales counts SQLs, your conversion rate is comparing apples to oranges.
Ignoring "no decision" outcomes. Some teams exclude deals where the prospect went dark. Others include them as losses. Our strong recommendation: count them as losses. A deal that stalls is a deal you didn't win, and pretending otherwise inflates your forecast.
Not specifying a time frame. Monthly, quarterly, and annual win rates tell different stories. HubSpot's guidance is clear: always specify the period.
Ignoring deal age. Win rates tend to drop the longer a deal sits in pipeline. If your average cycle is 60 days and a deal has been sitting for 120, your CRM still shows it as "open," but the buyer has almost certainly moved on.
Before you panic about an 8-point drop in win rate, check whether someone changed the CRM stage definitions last quarter. We've seen that exact scenario derail an entire QBR. HubSpot Community threads are full of teams struggling to get accurate win/loss reports because their funnel stages allow skipping - if intermediate stages aren't enforced, deals can drop out of the funnel and your numbers become meaningless.
How to Improve Both Metrics
Fix your definitions first. Create a data dictionary that documents exactly what counts as a qualified opportunity, what stage transitions mean, and how "no decision" is handled. Share it across sales, marketing, and RevOps.
Tighten qualification. BANT and MEDDIC exist for a reason. The stricter your qualification criteria, the more meaningful your win rate becomes and the more actionable your coaching conversations get.
Cohort your win rates. For longer sales cycles, group opportunities by the period they were created and track outcomes over time. If your average sales cycle is 90 days, comparing Q1 wins against Q1-created opportunities is misleading - most of those deals haven't closed yet. Cohorted tracking prevents this distortion and gives you a true read on whether your team is improving.
Clean your pipeline data. This is the upstream problem nobody talks about, and in our experience it's the single highest-ROI activity for RevOps teams. Bad contact data - bounced emails, wrong phone numbers, outdated titles - creates phantom opportunities that were never actually reachable. Those phantom records inflate your denominator and drag down your win rate. Tools like Prospeo, with its 98% email accuracy and 7-day data refresh cycle, keep pipeline contacts current so your denominator reflects real opportunities, not ghosts.
Look, if your win rate is below 20%, your problem probably isn't sales execution. It's qualification and data quality. Fix those two things before you spend another dollar on sales training.
Conversion rates collapse when reps waste hours chasing outdated contacts. Prospeo's 300M+ verified profiles and 30+ filters - including buyer intent and job change signals - put qualified buyers in front of your team, not dead leads that drag down every metric in this article.
Teams using Prospeo book 35% more meetings than Apollo users.
FAQ
What's a good win rate in B2B sales?
RAIN Group's benchmark across 472 respondents is 47%, measured at the proposal stage. "Good" depends on your sales motion: transactional sales typically run 15-25%, while professional services hit 40-60%. Always compare against your own denominator definition, not someone else's headline number.
Can win rate and conversion rate be the same number?
Only if your denominator is identical - meaning you're measuring conversions from the exact same pool of qualified opportunities. In practice, win rate uses qualified or decided opps while conversion rate typically uses total visitors or leads, so the numbers differ significantly. A 3% conversion rate and a 35% win rate can describe the same funnel.
What's the difference between win rate and close rate?
Win rate measures how often your team converts qualified or decided opportunities into closed deals. Close rate uses all leads - including unqualified ones - as the denominator. That means close rate reflects both lead quality and sales execution, whereas win rate isolates rep performance on real pipeline. If your close rate is low but your win rate is healthy, the issue is upstream lead quality, not your sales team.
How does bad data affect win rate?
Outdated emails and wrong phone numbers create pipeline contacts that were never reachable, inflating your opportunity count and dragging down your win rate. Real-time verification catches bounced addresses before they enter your pipeline, keeping your denominator honest so metrics reflect actual sales performance rather than data decay.