How to Accelerate Pipeline: Benchmarks, Formula, and Tactics That Work
Your VP of Sales pulls up the pipeline report. Half the opportunities haven't had activity in 45 days. The board wants 40% growth, and the instinct is to crank up outbound volume. That instinct is wrong - and it's costing you quarters.
Here's the distinction most teams miss: pipeline generation fills the top of the funnel, while pipeline acceleration moves what's already there faster and more efficiently. They're different problems requiring different solutions. With enterprise buying groups now averaging 13 people per deal according to Forrester, brute-force volume doesn't just fail - it creates drag. More contacts to chase, more threads to manage, more deals stalling in Stage 2 while your coverage ratio looks deceptively healthy.
Sales pipeline acceleration is a math problem with four levers: opportunity count, deal size, win rate, and sales cycle length. In the benchmark model below, sales cycle days is the biggest lever at 28% impact. What follows is the formula to measure velocity, benchmarks to diagnose where you stand, the anti-patterns that silently stall deals, and the tactics that actually move revenue per day.
The Pipeline Velocity Formula
(Opportunities x Average Deal Size x Win Rate) / Sales Cycle Length = Revenue per Day (Pipeline Velocity Formula)
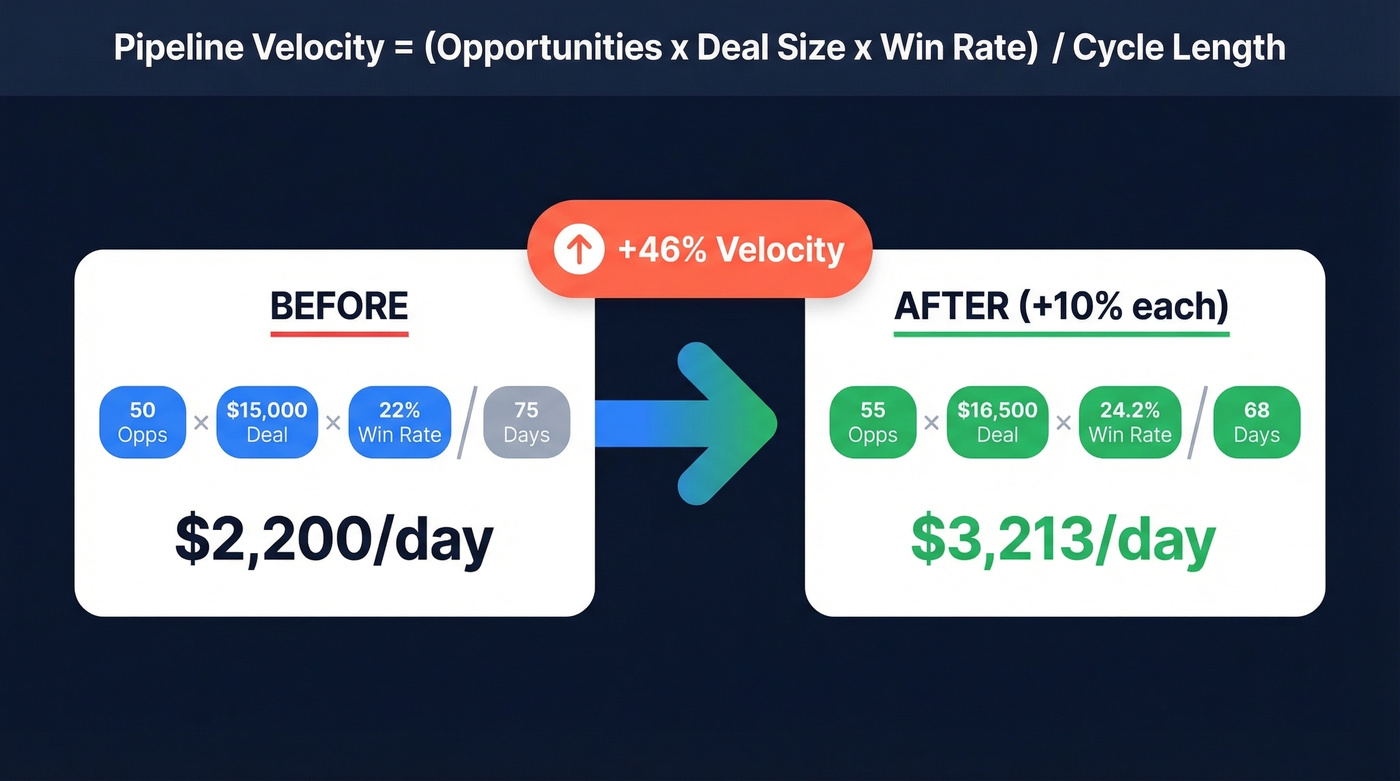
Each variable compounds. A 10% improvement in all four components yields roughly a 46% increase in total velocity. That's not linear - it's multiplicative, which is why small gains across the board beat a heroic push on any single lever.
Let's run the numbers. Say you've got 50 qualified opportunities, $15,000 average deal size, a 22% win rate, and a 75-day cycle. That's (50 x $15,000 x 0.22) / 75 = $2,200/day. Now improve each variable by just 10%: 55 opps, $16,500 deal size, 24.2% win rate, 68-day cycle. New velocity: $3,213/day. Same team, same quarter - 46% more revenue flowing through the pipe.
Pipeline Velocity Benchmarks
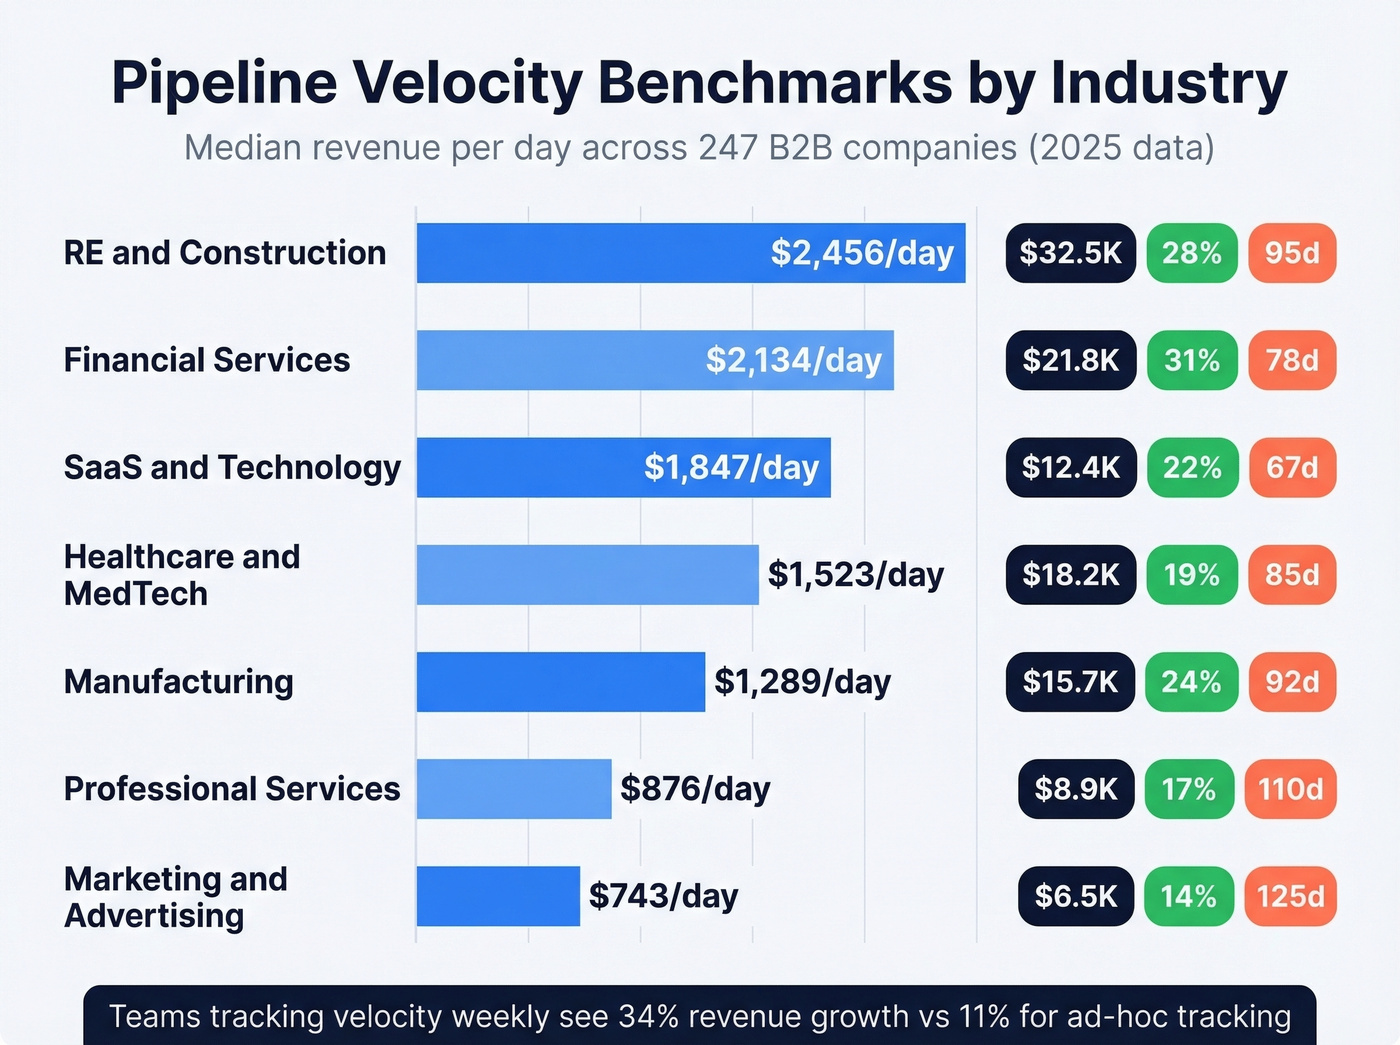
Numbers without context are useless. Here's where B2B companies actually land, based on a study of 247 North American organizations with data collected in early 2025.
By Industry
| Industry | Median Deal | Win Rate | Cycle (Days) | Velocity ($/day) |
|---|---|---|---|---|
| SaaS & Technology | $12,400 | 22% | 67 | $1,847 |
| Financial Services | $31,200 | 18% | 89 | $2,134 |
| Healthcare & MedTech | $18,700 | 25% | 72 | $1,523 |
| Manufacturing | $47,800 | 19% | 124 | $1,289 |
| Professional Services | $8,900 | 28% | 51 | $876 |
| RE & Construction | $89,300 | 16% | 147 | $2,456 |
| Marketing & Advertising | $15,200 | 24% | 58 | $743 |
By Company Size
| Revenue Tier | Avg Deal | Win Rate | Cycle | Velocity |
|---|---|---|---|---|
| $1M-$5M | $6,200 | 26% | 43 days | $687/day |
| $5M-$25M | $12,800 | 23% | 61 days | $1,303/day |
| $25M-$100M | $22,700 | 21% | 78 days | $3,484/day |
| $100M-$500M | $35,300 | 19% | 95 days | $6,919/day |
| $500M+ | $57,600 | 17% | 118 days | $12,945/day |
One stat jumps out: teams tracking velocity weekly see 34% revenue growth versus 11% for teams tracking ad-hoc. The measurement cadence alone is a competitive advantage. Teams with 30-45 day cycles show +38% higher velocity compared to a 76-90 day baseline - further proof that cycle time is the lever worth obsessing over.
How Long Should Your Sales Cycle Be?
Cycles are getting longer, not shorter. 58% of B2B professionals report their sales cycles have increased year-over-year, driven partly by buying committee bloat - the average purchase now involves 6.3 stakeholders.
Deal size is the strongest predictor of cycle length. Deals under $1K close in roughly 25 days. Deals above $500K stretch to 270 days. Company size follows a similar curve: a 1-10 person company closes in about 38 days, while a 10,001+ employee enterprise takes 185 days. Referral-sourced deals close in around 20 days versus 60 days for cold outbound - a 3x speed advantage that should inform how you weight your channel mix.
If you're selling into mid-market and your cycle exceeds 90 days, something structural is off. It's probably not your reps.
Where Pipelines Actually Stall
The biggest bottleneck in most B2B funnels is the MQL-to-SQL conversion stage, where overall conversion runs 15-21% across segments. That's where marketing's definition of "qualified" meets sales reality, and the gap is often brutal.
The SMB vs. enterprise split tells the story clearly. Visitor-to-lead conversion runs 1.4% for SMBs versus 0.7% for enterprise. Opportunity-to-close runs 39% versus 31%. Enterprise deals leak at every stage because more stakeholders means more friction, more internal politics, and more chances for a deal to die quietly in someone's inbox.
A 5-point lift in any mid-funnel stage can increase total closed revenue by 12-18%. So when your SDR team books 40 meetings and only 6 convert to qualified opportunities, the instinct is to book more meetings. The correct move is figuring out why 34 didn't convert. That diagnostic work is where velocity actually lives.
You just saw that a 10% improvement across all four velocity levers yields 46% more revenue per day. The fastest lever? Cycle length. Prospeo's 98% email accuracy and 125M+ verified mobiles mean your reps reach real decision-makers on the first attempt - not managers who create motion without momentum.
Stop losing deals to stale data and wrong contacts.
Why Your Pipeline Is Slow
The Volume Trap
The consensus on r/salesdevelopment is blunt: if your pipeline isn't converting, adding more leads amplifies the problem. As one practitioner put it, "the issue is not reach, it is resonance." The people already in your pipeline know you exist. Why aren't they buying?
Role Misalignment
An analysis of 18,000+ sales conversations revealed something counterintuitive. Teams measured engagement by activity volume - calls scheduled, demos requested, follow-ups completed. Manager-level contacts scored highest on those metrics. But managers create motion without momentum. They schedule calls, request demos, and loop in colleagues because they're gathering information, not making decisions. Senior buyers engage less frequently but move dramatically faster when they do. If your pipeline is full of active-but-stalled deals, check who you're actually talking to. The fix isn't more activity - it's activity with the right people.
The Research Tax
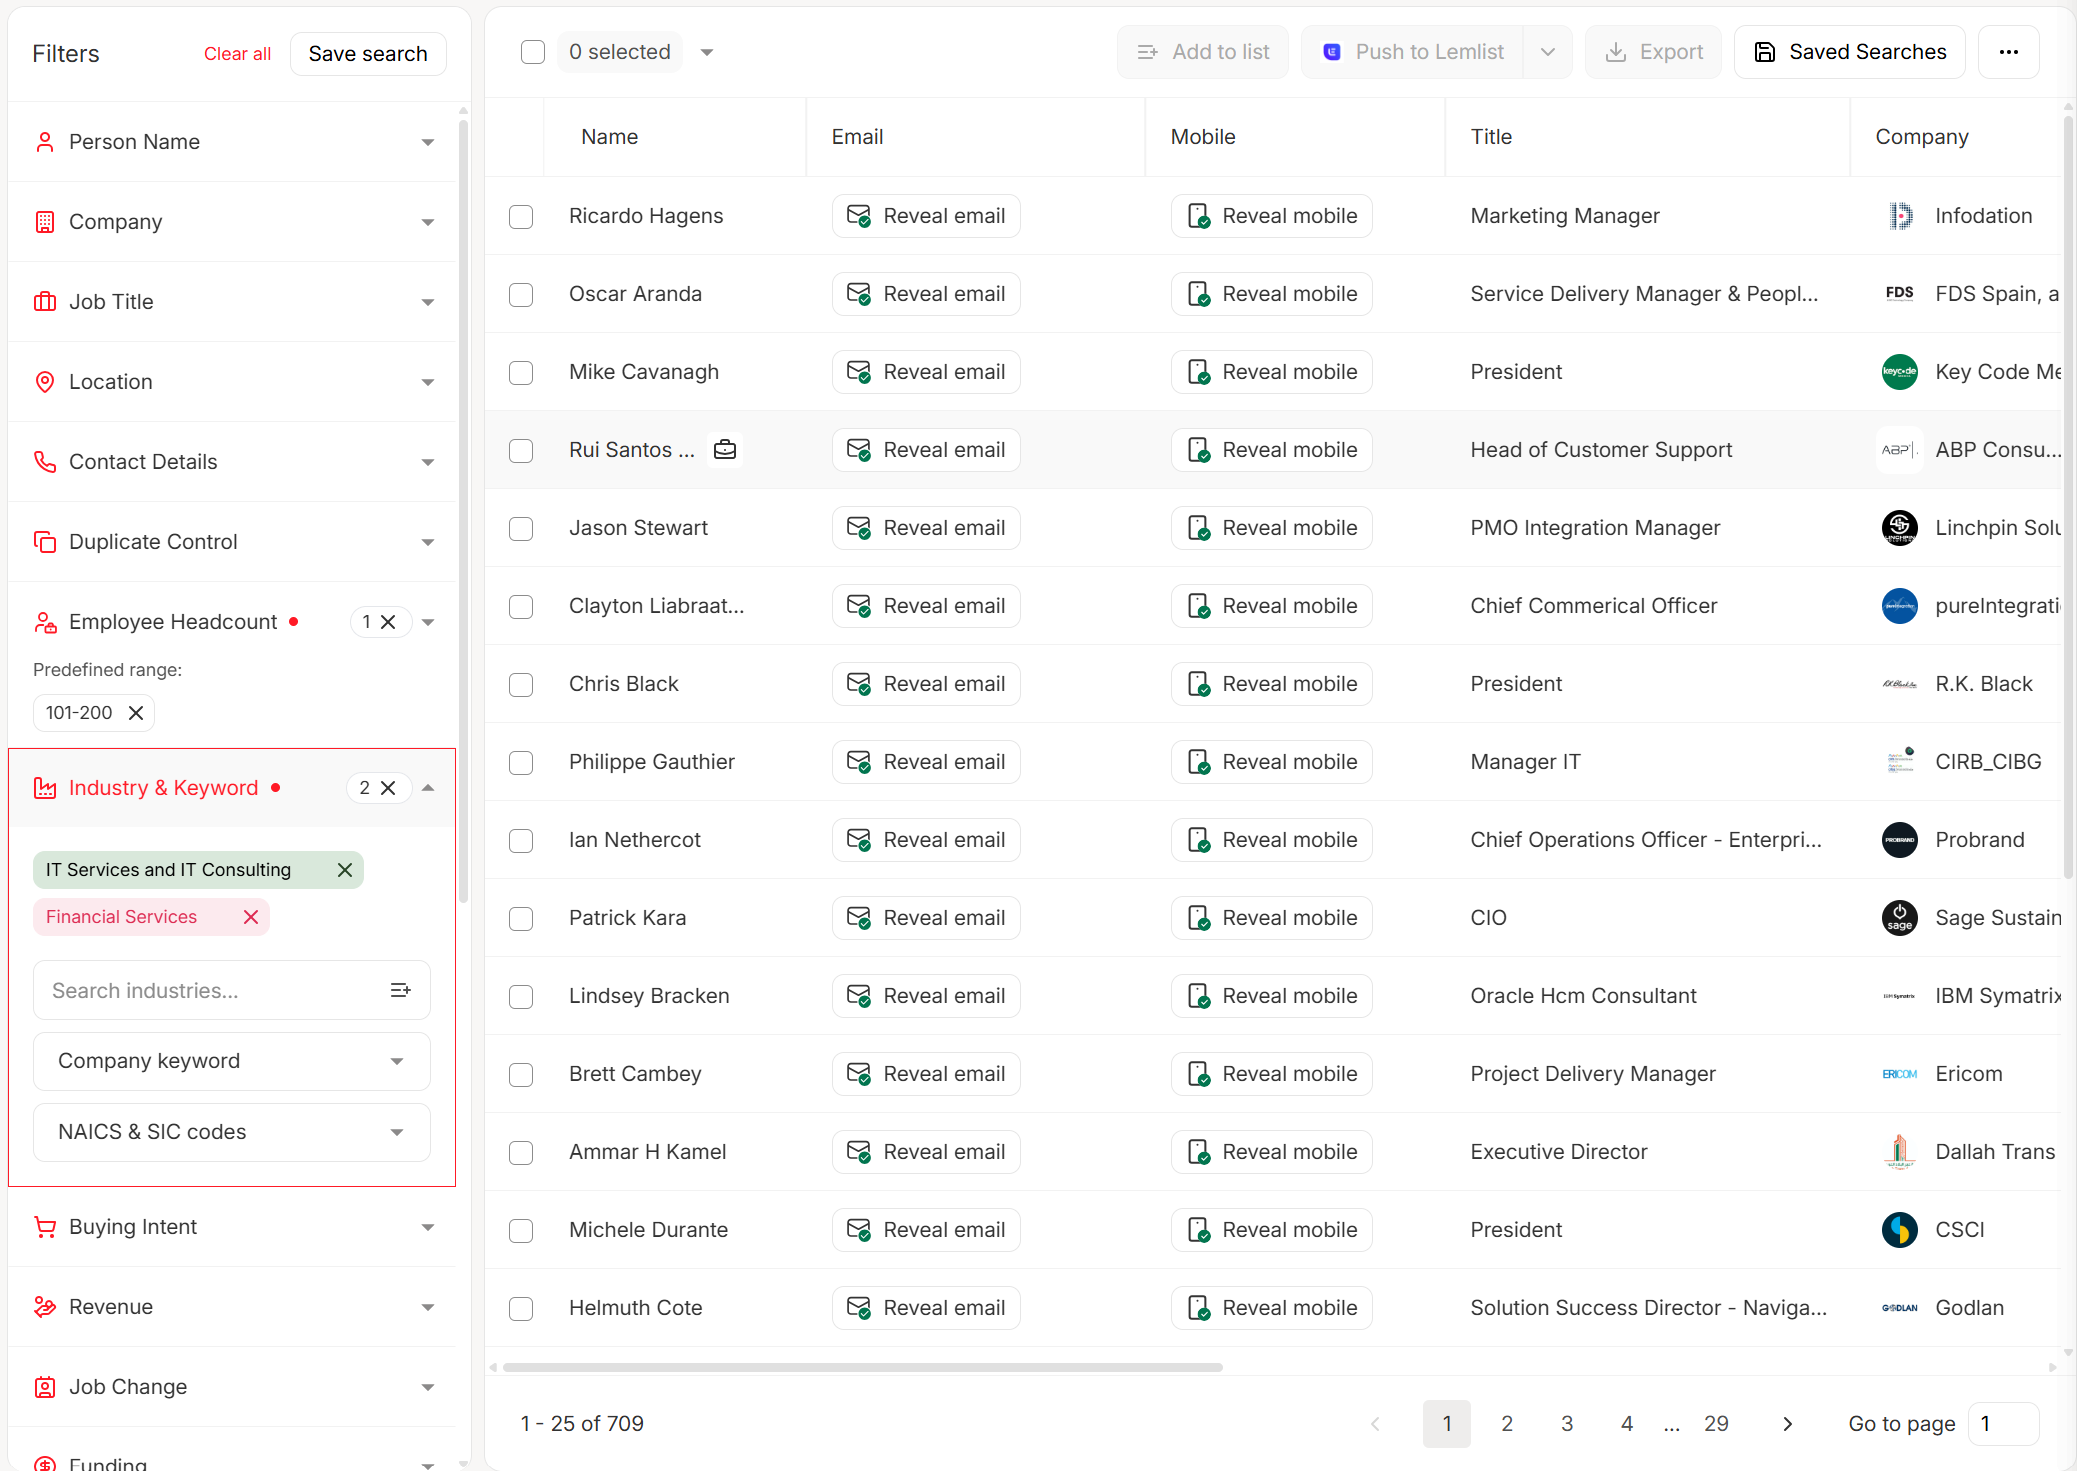
Here's the thing: sales reps can lose up to 70% of their time to non-revenue tasks - hunting for contact info, doing manual research, and cleaning CRM records. A 50-person sales org losing 70% of prospecting time to data work is effectively a 15-person sales org. The problem isn't rep productivity. It's that reps are doing data janitor work instead of selling.
This gets worse when the data they do find is stale. Reps work a pipeline inflated with phantom opportunities built on disconnected phone numbers and bounced emails. The prospect left the company six months ago, but the deal sits in Stage 2 making your coverage ratio look healthy. We've seen this firsthand - Snyk's 50-person AE team had bounce rates running 35-40% before switching to Prospeo, which refreshes data on a 7-day cycle versus the 6-week industry average. Bounce rates dropped under 5%, and AE-sourced pipeline jumped 180% once reps stopped chasing ghosts.
Automation Without Context
Skip this section if your sequences are already segmented by role, seniority, and deal stage. For everyone else: over-reliance on automation at the wrong stage kills deals. When follow-up sequences aren't adjusted by where the deal actually sits, you get generic touches that signal "you're in a drip campaign" instead of "we understand your problem." Teams move deals through the funnel more effectively by optimizing conversation quality and next-step ownership than by optimizing open rates.
Which Lever Drives the Most Impact?
Not all levers are equal. Here's how they rank by impact:
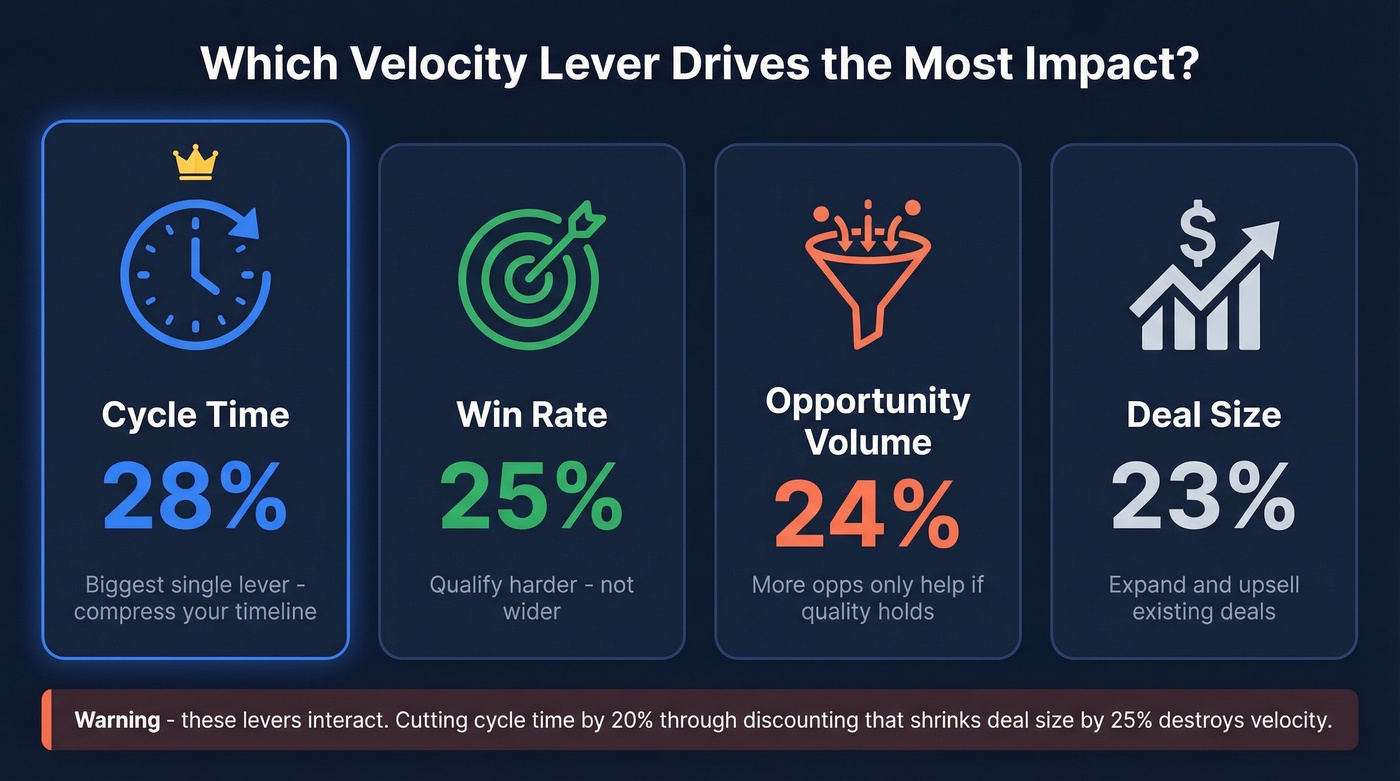
- Cycle time: 28% - the single biggest lever
- Win rate: 25% - quality of qualification and selling
- Opportunity volume: 24% - top-of-funnel generation
- Deal size: 23% - expansion and value selling
Most teams obsess over opportunity volume because it's the easiest to measure and the most satisfying to grow. But the modeling shows traps: increasing opportunities while win rate drops from poor qualification can be net negative. Cutting your cycle by 20% through aggressive discounting that shrinks deal size by 25% also destroys velocity. The levers interact. You can't pull one without watching the others.
If your average contract value sits below $10K, you probably don't need a $40K/year data platform or a six-figure intent data subscription. You need accurate contact data, a tight ICP definition, and reps who can qualify fast. The complexity of your stack should match the complexity of your deal.
Tactics to Accelerate Pipeline in 2026
Shorten the Cycle
Multi-thread across the buying committee from day one. If you're single-threaded to one champion in a 13-person buying group, you're building on sand. Mutual action plans with clear milestones and deadlines compress timelines by creating shared accountability. And remove stalled deals ruthlessly - in the TechVantage case study, 72% of pipeline was never going to close. That's not a pipeline. It's a graveyard consuming rep hours.
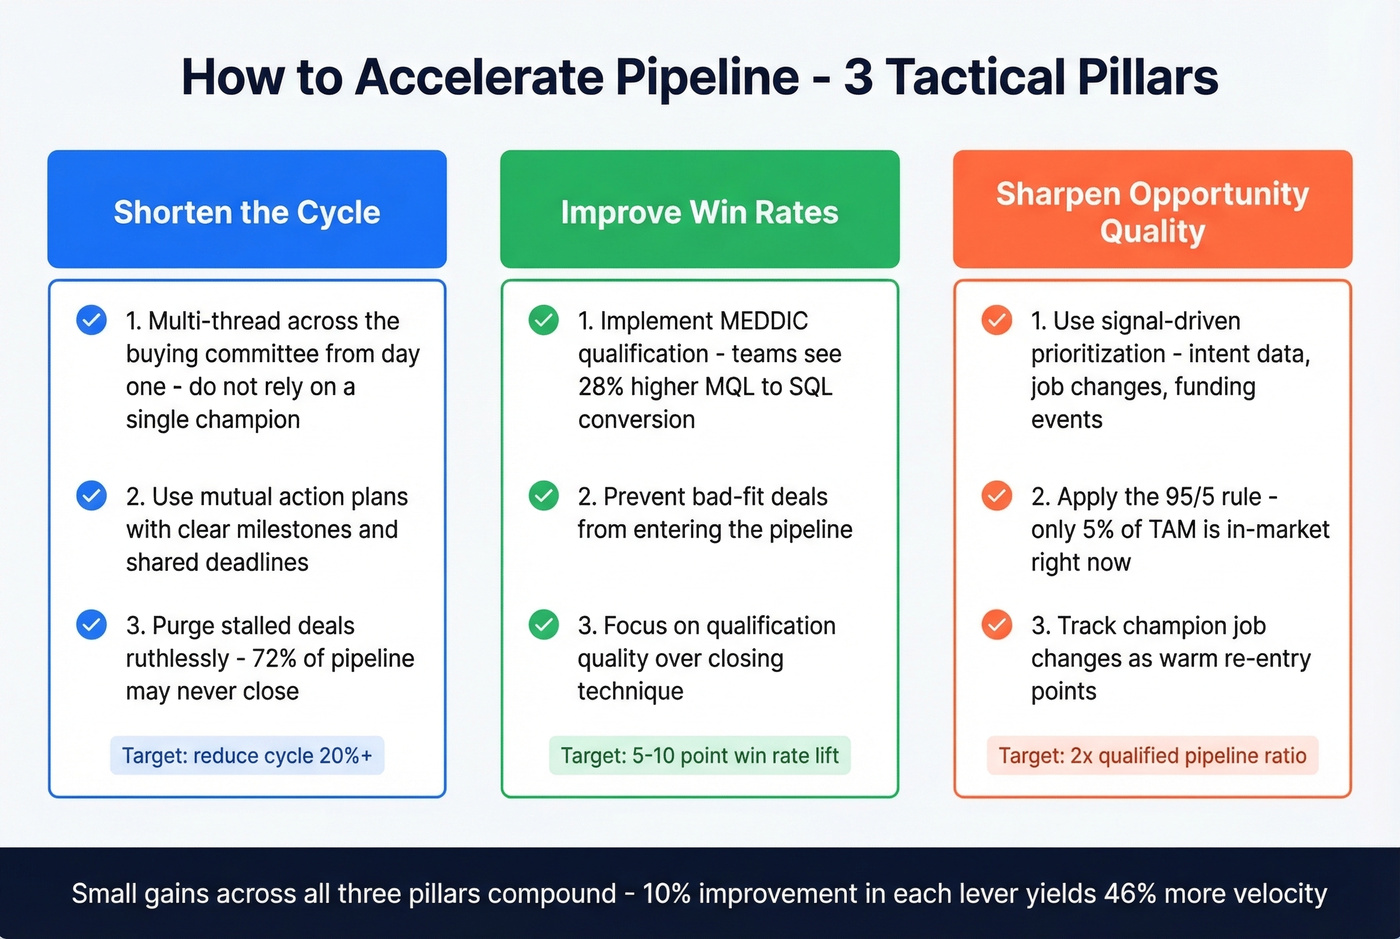
Improve Win Rates
Qualification frameworks like MEDDIC aren't bureaucracy - they're velocity tools. Companies implementing MEDDIC report 28% higher MQL-to-SQL conversion. TechVantage doubled their win rate from 18% to 36% by preventing bad-fit opportunities from entering the pipeline, cut their cycle from 60 to 47 days, and added $3.2M in incremental ARR over six months. The fix wasn't better closing - it was better qualifying. Qualify harder, not wider.
Sharpen Opportunity Quality
The 95/5 rule is real: only about 5% of your TAM is actively in-market at any given time. Signal-driven prioritization - intent data, job changes, funding events, technographic shifts - lets you focus reps on accounts that are actually ready to buy instead of spraying across the other 95%. Job-change signals are particularly powerful. When a champion who bought your product at Company A moves to Company B, that's a warm lead hiding in plain sight. We've seen teams cut prospecting waste in half just by layering intent and job-change signals on top of their firmographic filters.
Protect Deal Size
Multi-threading isn't just a cycle-time play - it's a deal-size play. When you're connected to executive sponsors, you're selling business outcomes, not features. That means less discounting pressure and larger initial contracts. TechVantage's deal sizes held steady even as they tightened qualification, because the deals that made it through were better-fit accounts with real budget authority. Value-based selling requires knowing the economic buyer's priorities, which circles back to data quality: if you can't identify and reach the right stakeholders, you default to whoever answers.
Run Pipeline Acceleration Campaigns
Dedicated pipeline acceleration campaigns target deals already in-flight rather than net-new prospects. These campaigns coordinate marketing air cover - executive-level content, case studies, ROI calculators - with sales outreach timed to specific deal stages. The goal is to arm your champion with the ammunition they need to sell internally, especially when deals stall at the committee review stage. Teams running these campaigns alongside their standard sequences consistently see mid-funnel conversion rates climb.
Tools Mapped to Pipeline Stages
The sales acceleration market hit $124.4B in 2024 and it's still growing. But most teams don't need more tools - they need the right tools at the right stages.
| Category | Tools | Pricing Range |
|---|---|---|
| B2B Data & Prospecting | Prospeo, ZoomInfo, Apollo | Prospeo: free tier + ~$0.01/email. ZoomInfo: $15-40K/yr. Apollo: free, $49-$99/user/mo |
| Sales Engagement | Outreach, Salesloft | ~$100-150/user/mo |
| Intent Data | Bombora, 6sense, Demandbase | $30-100K+/yr enterprise |
| Conversation Intelligence | Gong, Chorus | ~$100-150/user/mo |
| Revenue Intelligence | Clari, BoostUp | $50-150K/yr enterprise |
| Sales Enablement | Highspot, Seismic | ~$30-80/user/mo |
4 out of 5 deals are won by the vendor the buyer already favors before the first sales conversation - per 6sense research. That means the data and prospecting layer, reaching the right person with verified contact info while they're in-market, is the foundation everything else sits on. Most pipeline acceleration stacks cost $50K+ before you've made a single call. You don't need to spend that much to get enterprise-grade data.
If you're evaluating your stack, start with your sales prospecting motion and the SDR tools that support it.
If your reps spend 70% of their time on data work, you're running a 15-person team with a 50-person budget. Prospeo returns 50+ data points per contact at a 92% match rate, with data refreshed every 7 days - not the 6-week industry average. That's how you turn data janitors back into closers.
Give your reps their selling time back for $0.01 per email.
Metrics That Keep Pipeline Moving
Track these weekly - not monthly, not quarterly. The discipline of measurement is itself a velocity lever, and the 34% vs. 11% revenue growth gap between weekly and ad-hoc trackers proves it.
Your north star is pipeline velocity in dollars per day - it captures all four levers in a single number. Pair it with your pipeline coverage ratio, which should sit at 3-4x your revenue target. Below 3x and you're relying on heroics. Above 5x usually means qualification is too loose.
Lead Velocity Rate - month-over-month growth in qualified leads - tells you whether your top-of-funnel is healthy or decaying. Stage conversion rates, especially MQL-to-SQL, reveal where your funnel leaks. And forecast accuracy deserves more attention than it gets: only 20% of sales orgs land within 5% of their forecast, while 43% miss by 10% or more. If you can't predict your number, you can't accelerate toward it.
To tighten forecasting, align your pipeline review with pipeline health metrics and consider lightweight sales forecasting solutions before you buy an enterprise suite.
FAQ
What is pipeline velocity?
Pipeline velocity measures revenue moving through your pipeline per day. The formula: (Opportunities x Deal Size x Win Rate) / Sales Cycle Length. It's the single best diagnostic for pipeline health because it captures all four levers in one number.
What's a good pipeline coverage ratio?
Aim for 3-4x your revenue target. If your quarterly goal is $1M, you need $3-4M in qualified pipeline. Below 3x means you're relying on heroics; above 5x signals loose qualification that inflates forecasts.
Which pipeline lever has the biggest impact?
Cycle time, at 28% impact weight. Win rate follows at 25%, then opportunity volume at 24% and deal size at 23%. Most teams over-index on volume, but shortening cycles through multi-threading and tighter qualification compounds faster.
How can I accelerate pipeline without adding headcount?
Focus on the three non-volume levers: shorten cycles through multi-threading and mutual action plans, improve win rates via MEDDIC qualification, and protect deal size by selling to economic buyers. A 10% improvement across all four levers yields 46% more velocity - no new hires required.
What tools help accelerate pipeline on a budget?
Prospeo offers 300M+ profiles with 98% email accuracy starting free at 75 credits/month - roughly 90% cheaper per lead than ZoomInfo. Pair it with a free CRM tier and a basic sequencing tool, and you've got a functional acceleration stack for under $100/month.