Average Email Open Rate by Industry: 2026 Benchmarks, Explained
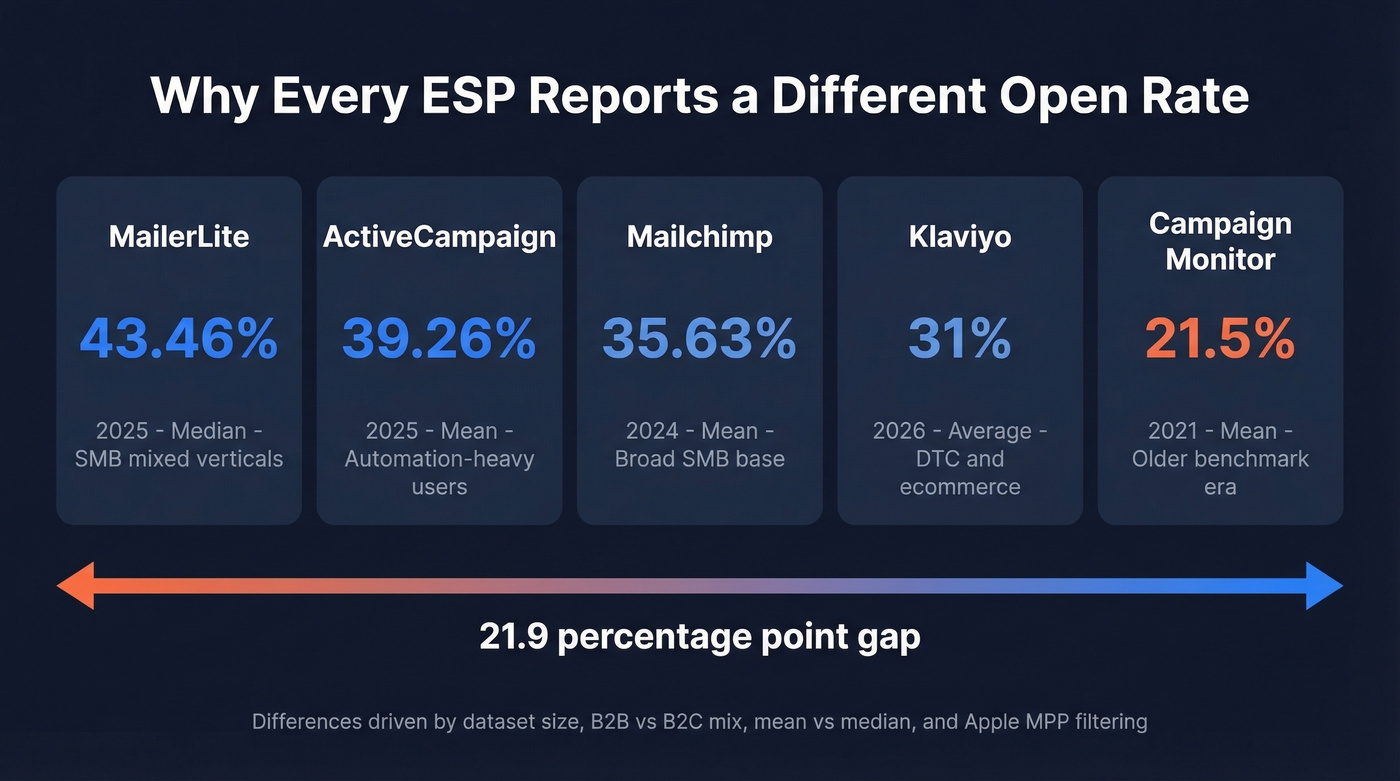
You pulled up three benchmark reports this morning and got three different numbers. MailerLite says 43.46%. Campaign Monitor says 21.5%. ActiveCampaign lands at 39.26%. They can't all be right - and honestly, none of them are wrong. The problem isn't the data. It's that the average email open rate by industry is a fundamentally broken metric, and every source measures it differently.
Here's the short version. The real overall average sits around 39-43% depending on the dataset, but Apple Mail Privacy Protection inflates this by 15-20+ points. Your actual open rate is probably much lower than your dashboard suggests. Your industry matters less than your list hygiene, inbox placement, and whether you're blending campaign and automation metrics. And if you're benchmarking open rate alone, you're watching the wrong scoreboard - CTOR and CTR are far more reliable post-privacy metrics.
Why Open Rate Benchmarks Vary So Much
Every ESP publishes benchmarks from its own customer base. MailerLite's numbers reflect 181,000 approved accounts. ActiveCampaign's reflect their automation-heavy users. Klaviyo's skew heavily toward ecommerce. Different audiences, different sending patterns, different results.
The disagreement is significant:
| Source | Overall Open Rate | Year | Method | Audience Skew |
|---|---|---|---|---|
| MailerLite | 43.46% | 2025 | Median, 3.6M campaigns | SMB, mixed verticals |
| ActiveCampaign | 39.26% | 2025 | Mean, customer base | Automation-heavy |
| Mailchimp | 35.63% | 2024 | Mean, billions of emails | Broad SMB |
| Klaviyo | 31% | 2026 | Average campaign open rate | DTC / ecommerce |
| Campaign Monitor | 21.5% | 2021 | Mean, all industries | Older benchmark era |
That gap between 21.5% and 43.46% comes down to four things: dataset composition, B2B vs B2C mix, mean vs median calculation, and how aggressively each platform filters Apple MPP opens. MailerLite uses medians (less skewed by outliers) from a recent 12-month window, while Campaign Monitor's 21.5% figure dates back to 2021 - a completely different era in email privacy. Neither is lying. They're measuring different things.
Any single industry benchmark should be treated as a directional signal, not a target.
Email Open Rates by Industry: 2026 Numbers
MailerLite's dataset is the most transparent anchor we've found: 3.6 million campaigns across 46 industries, reported as medians from December 2024 through November 2025. Where MailerLite's industry categories don't align directly, ActiveCampaign data fills the gap - those rows are marked with an asterisk.
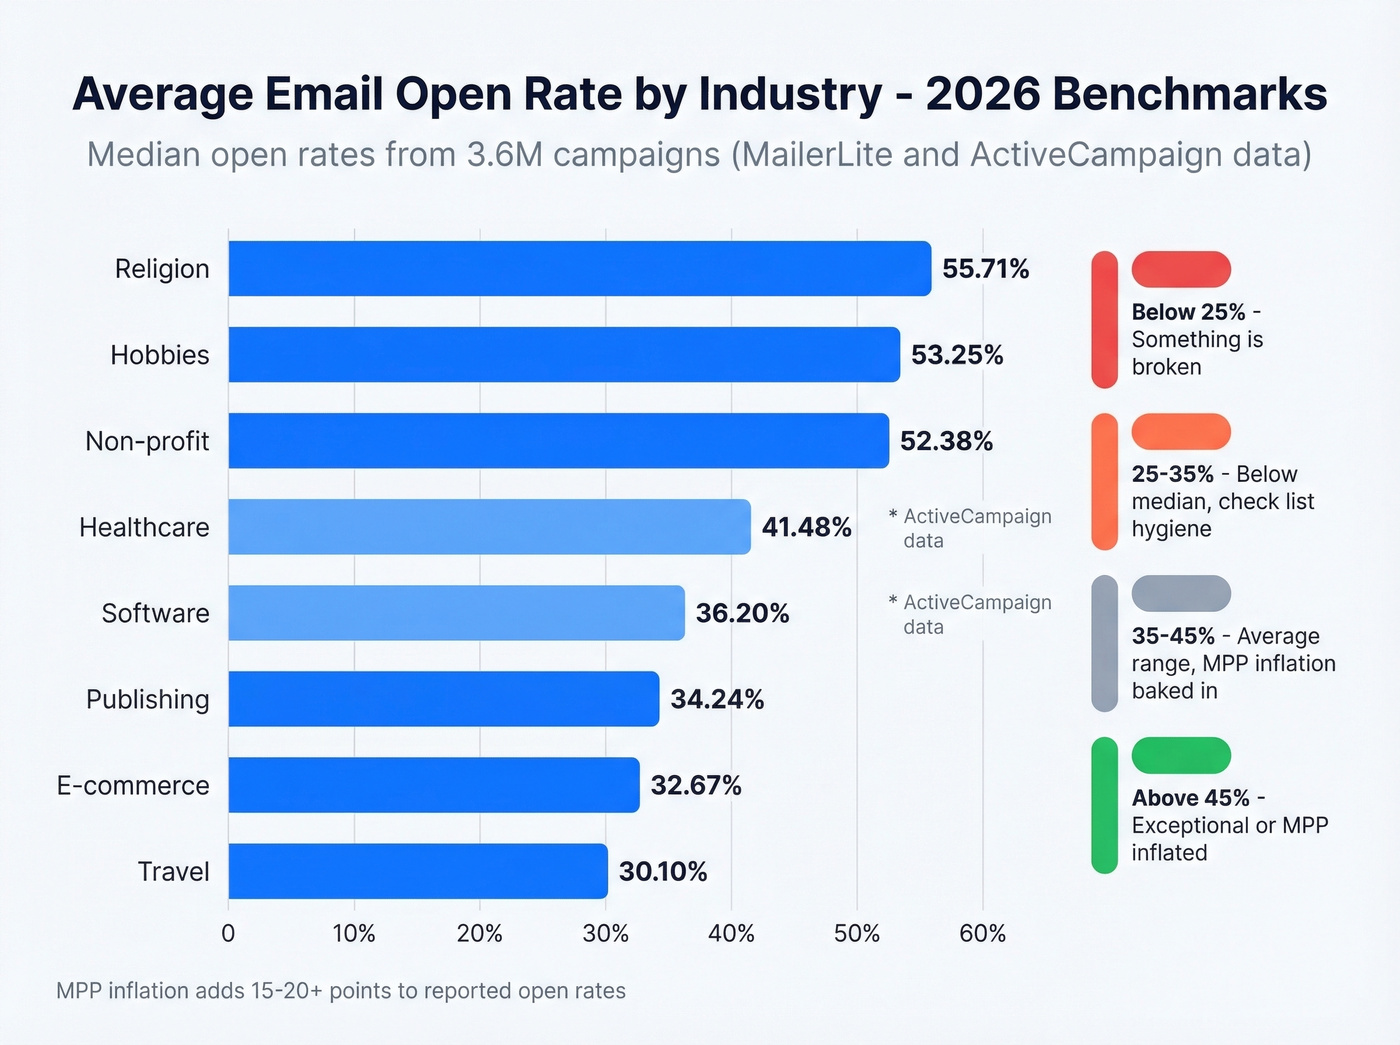
| Industry | Open Rate | CTR | CTOR | Unsub Rate | Source |
|---|---|---|---|---|---|
| Religion | 55.71% | 3.12% | 7.89% | 0.14% | MailerLite |
| Hobbies | 53.25% | 4.21% | 9.41% | 0.18% | MailerLite |
| Non-profit | 52.38% | 3.48% | 8.12% | 0.15% | MailerLite |
| Healthcare | 41.48% | - | - | - | ActiveCampaign* |
| Software | 36.20% | 6.67% | - | - | ActiveCampaign* |
| Publishing | 34.24% | 1.76% | 5.14% | 0.31% | MailerLite |
| E-commerce | 32.67% | 1.89% | 5.78% | 0.28% | MailerLite |
| Travel | 30.10% | 1.52% | 5.05% | 0.26% | MailerLite |
The year-over-year trend is slightly up: 43.46% in 2025 vs 42.35% in 2024. Don't celebrate. That increase is almost certainly driven by expanding MPP inflation, not better engagement.
Here's how to interpret your own numbers against these tiers:
- Below 25%: Something's broken. Investigate deliverability immediately.
- 25-35%: Below the median for most verticals. Check list hygiene and inbox placement.
- 35-45%: Average range, with MPP inflation baked in.
- Above 45%: Either an exceptionally engaged list, or Apple MPP doing the heavy lifting.
One dimension most benchmark reports ignore: email type matters. Transactional emails (order confirmations, password resets) usually outperform marketing emails on opens. If your ESP blends transactional and marketing sends in one report, your marketing-only number is lower than the dashboard suggests.
Regional Variation
Open rates shift by geography, largely driven by Apple device penetration and cultural channel preferences. MailerLite reports benchmarks across multiple regions, and the takeaway is simple: if your audience skews Apple Mail-heavy, your reported open rate will look higher even when real engagement hasn't changed.
Running global campaigns and benchmarking against a single number? You're missing the picture. North American figures tend to run higher than European ones partly because of differences in Apple Mail adoption.
B2B Email Benchmarks
B2B email operates in a structurally different environment. Based on aggregated B2B campaign data, the baseline numbers run lower across the board: 20.8% open rate, 3.2% CTR, 2% bounce rate, and 0.24% unsubscribe rate.
The gap exists because of corporate email infrastructure. Microsoft Outlook handles a huge share of B2B inboxes, and Microsoft's inbox placement rate sits at 75.6% compared to Gmail's 87.2%. That's a 12-point gap before anyone even decides whether to open your email. Corporate security filters also strip tracking pixels more aggressively, which means B2B open rates are both lower and more accurate than B2C numbers inflated by Apple MPP.
Let's be honest: if you're selling to enterprises and comparing your 22% open rate against MailerLite's 43% overall average, you're comparing apples to corporate firewalls. Your 22% might actually represent stronger engagement than a B2C brand's 45%. You just can't see it through the MPP fog.
Why Your Open Rate Is Wrong
Apple Mail Privacy Protection accounts for 49.29% of all email opens as of January 2025. That's not a rounding error. That's nearly half of your "opens" being generated by Apple's proxy servers preloading tracking pixels - regardless of whether the subscriber actually read your email.
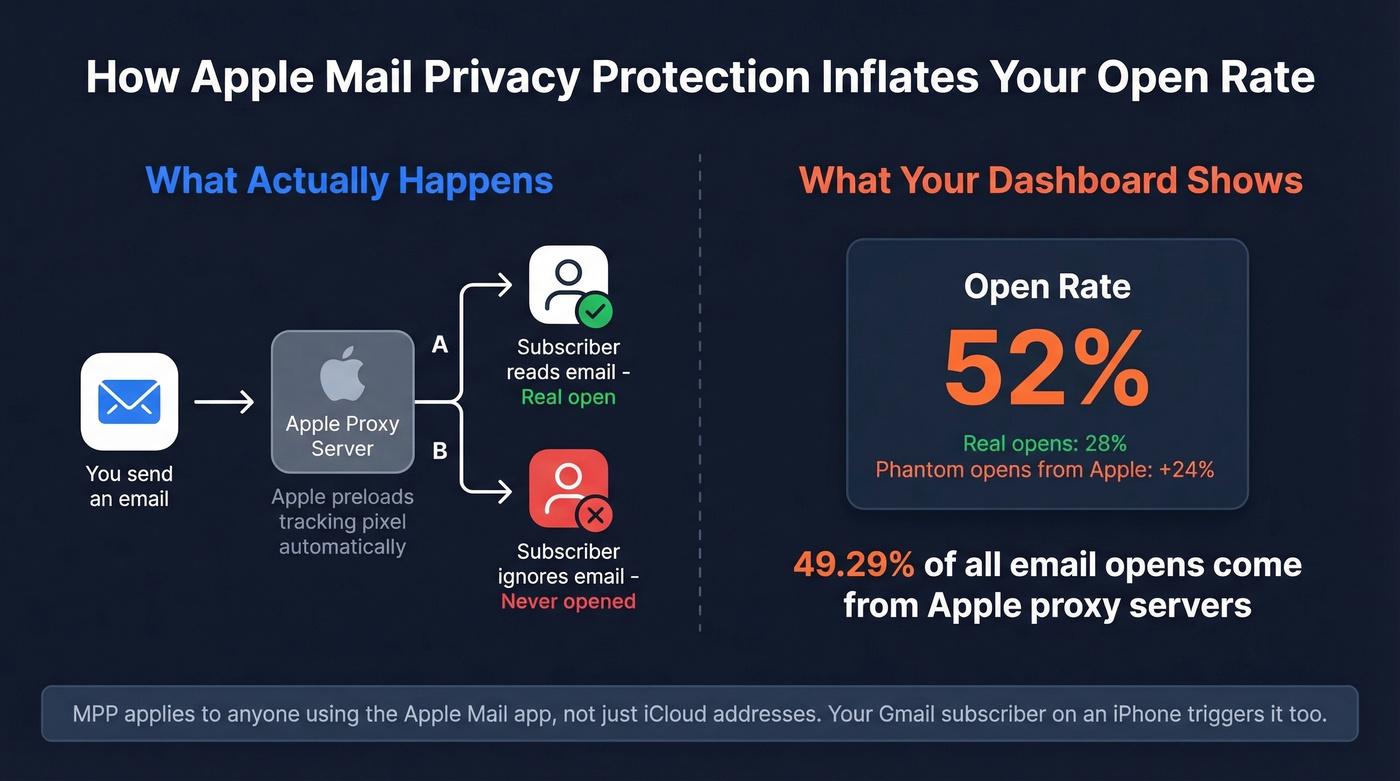
The inflation is substantial: 15-20+ percentage points in most cases. A list with a true 28% open rate can show up as 52% in your dashboard with zero change in actual engagement.
Here's what most marketers miss: MPP applies to anyone using the Apple Mail app, not just people with @icloud.com addresses. Your subscriber with a Gmail address who reads email on their iPhone? MPP is inflating that open too.
This explains the sudden drops practitioners reported in mid-2024. One newsletter operator on r/Emailmarketing saw open rates fall from ~35% to ~18% overnight after July 2024. The sender blamed Gmail security updates, but the timing aligns with Validity's documented MPP outage from July 25-28, when Apple adjusted pre-fetching behavior and a temporary disruption caused a sharp drop in phantom opens. It wasn't an engagement problem. It was a measurement shift.
Open rates are unreliable. Bounce rates aren't. Prospeo's 98% email accuracy and 5-step verification keep your bounce rate under 4% - so the emails that land actually get read by real people, not Apple's proxy servers.
Fix the metric that actually matters: deliverability.
Campaigns vs Automated Flows
If you're blending campaign and automation metrics into one "average open rate," that number is meaningless.
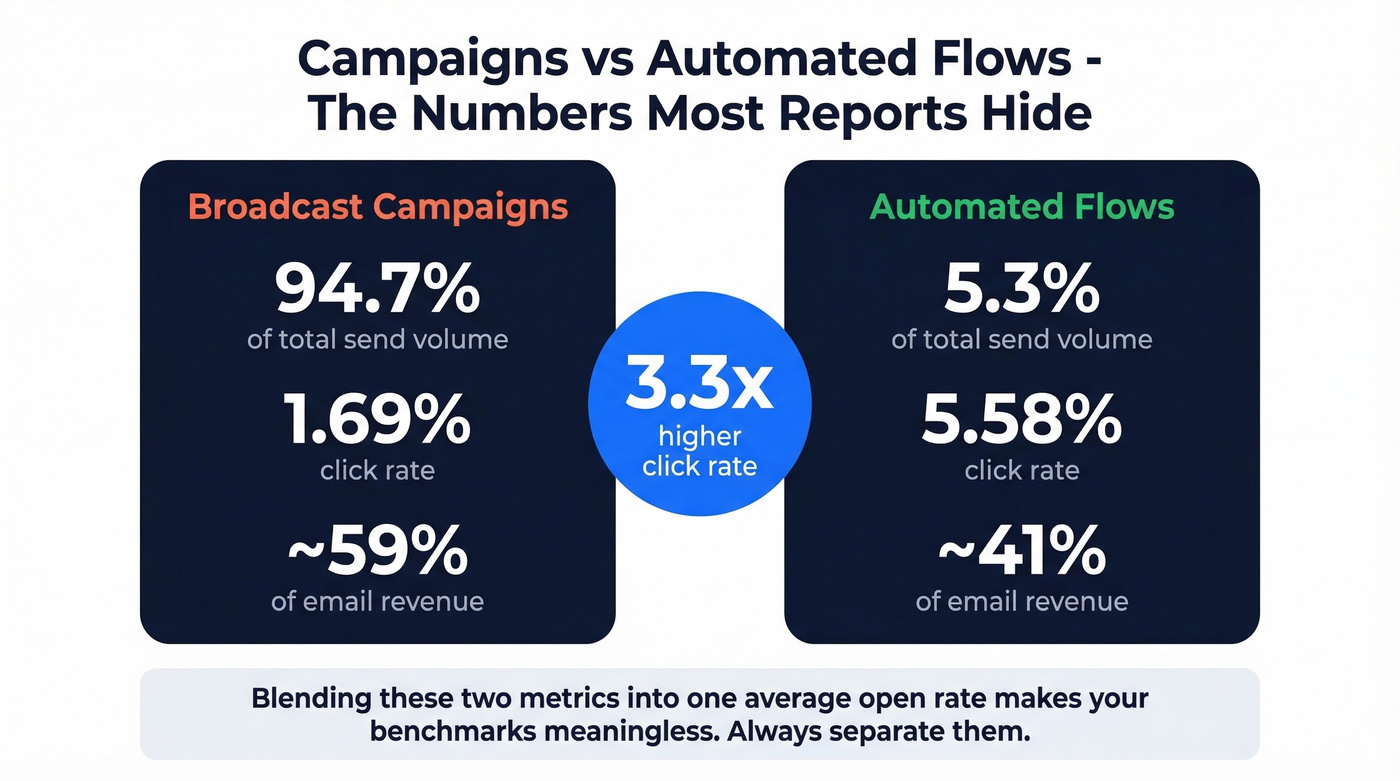
Klaviyo's data makes this crystal clear: automated flows represent just 5.3% of total send volume but generate ~41% of email revenue. The engagement gap is massive - flow click rates hit 5.58% compared to 1.69% for campaigns, more than 3x higher. The top 10% of flows exceed 10% click rates. This makes sense: a welcome sequence or abandoned cart email hits someone at a moment of intent. A Tuesday newsletter hits everyone regardless of where they are in the buying cycle.
When you see a benchmark report showing a 43% open rate, ask: does that include automated flows? If yes, the broadcast campaign number is probably much lower. This is one reason email marketing benchmarks can be so misleading - they rarely distinguish between flow and campaign performance.
What to Track Instead of Open Rate
Open rate isn't dead, but it's been demoted. Here's the hierarchy we recommend, based on what we've seen work across hundreds of campaigns:
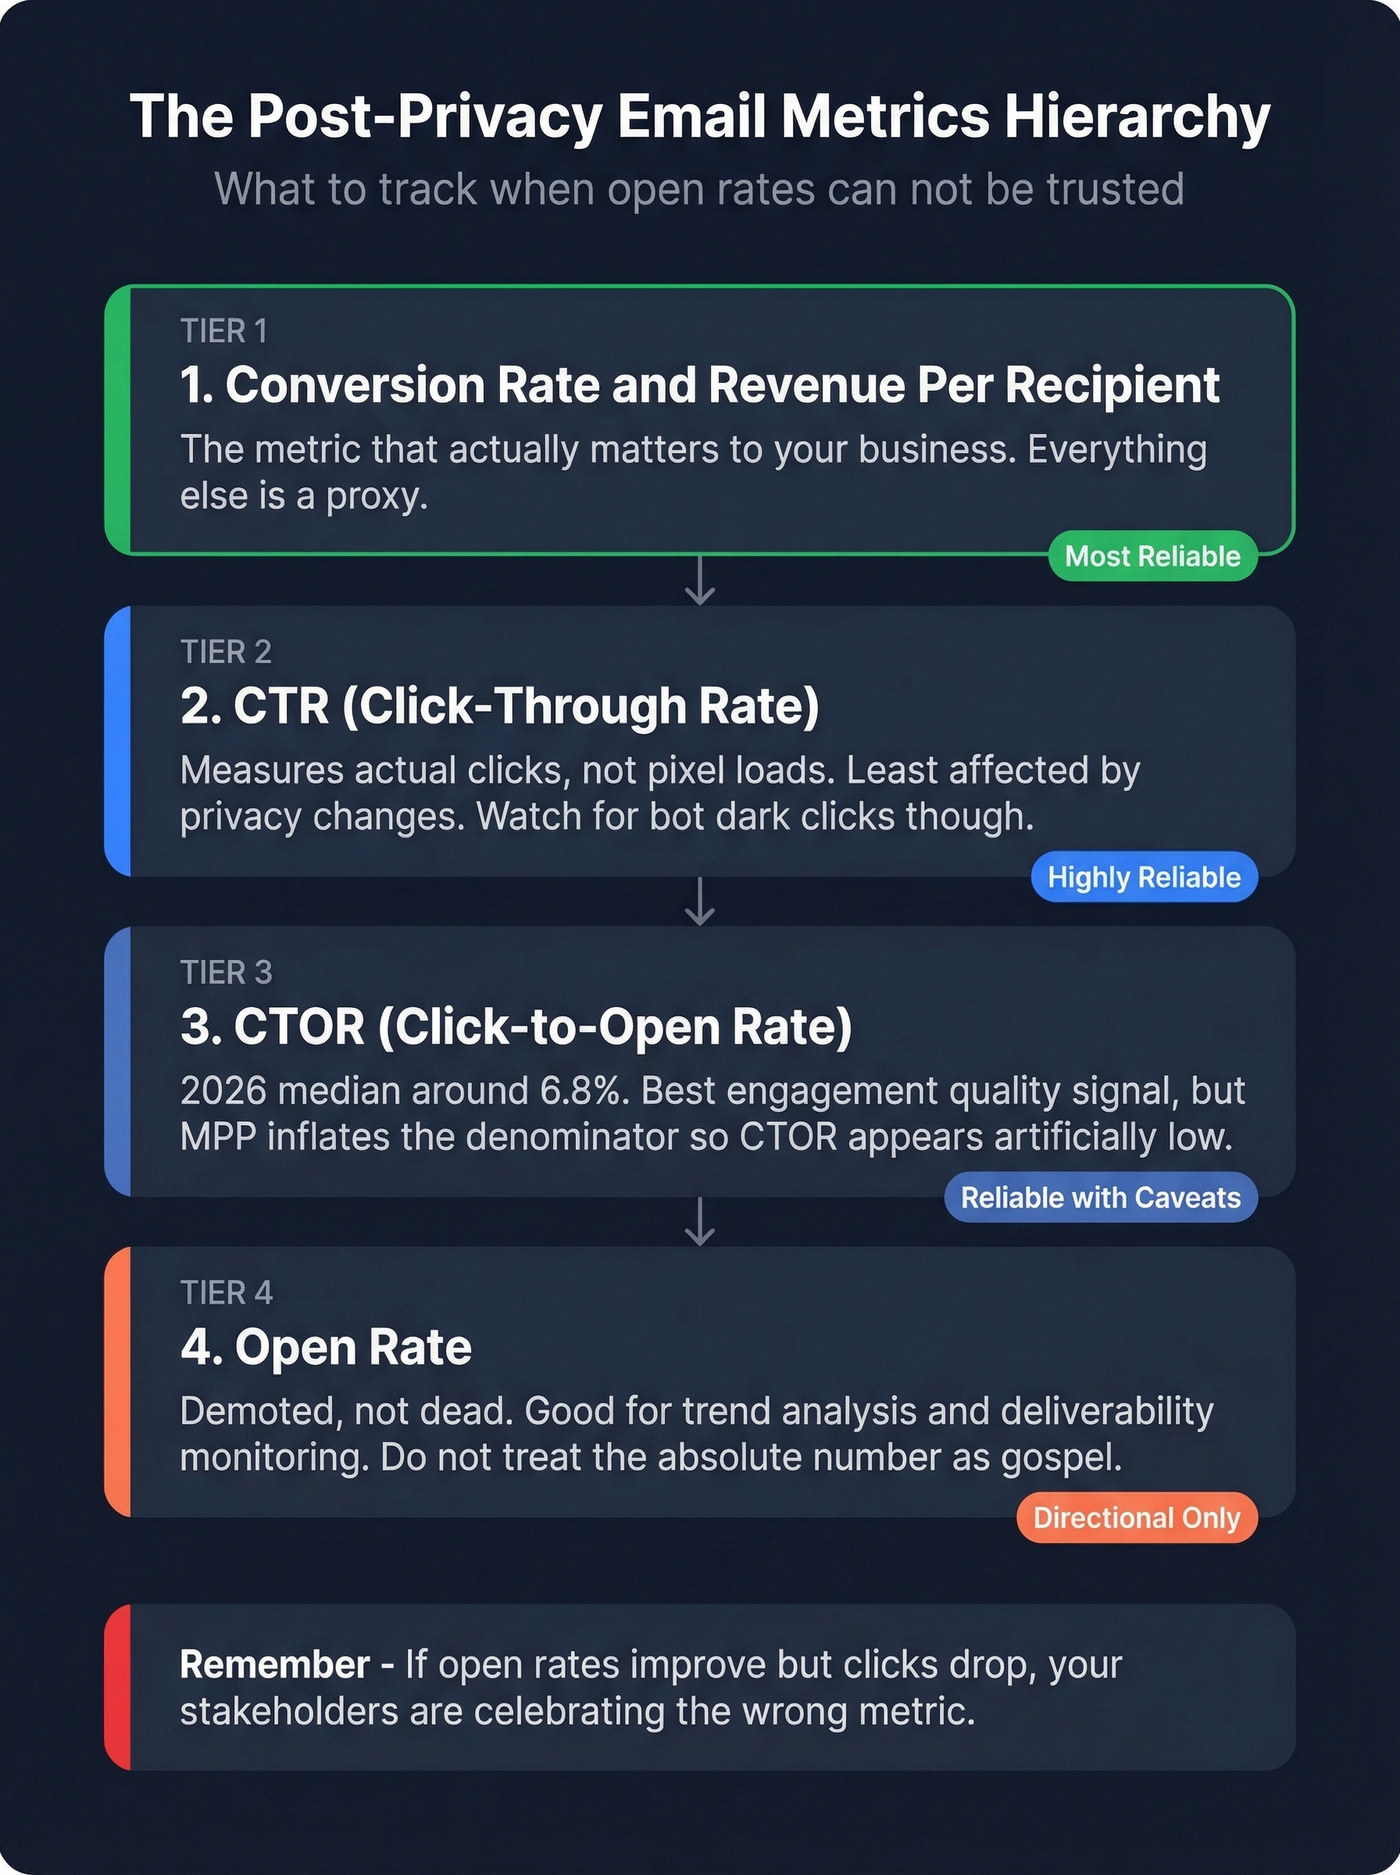
CTOR (click-to-open rate) is your best engagement quality signal. The 2026 median sits around 6.8%, up from 5.63% in 2024. One caveat: because MPP inflates the denominator (opens), CTOR actually appears artificially low in Apple-heavy audiences. Your real CTOR is higher than reported.
CTR (click-through rate) is less affected by privacy changes since it measures actual clicks, not pixel loads. This is your most reliable engagement signal right now. One wrinkle worth knowing: corporate security filters and AI bots can generate "dark clicks" that inflate CTR too, with bot clicks peaking at 3+ million per day in early 2025. The effect is smaller than MPP's impact on opens, but don't assume CTR is perfectly clean either.
Conversion rate and revenue per recipient - the metric that actually matters to your business. Everything else is a proxy.
Open rate still works for trend analysis and deliverability monitoring. If your open rate drops 10 points in a week, something's wrong. Just don't treat the absolute number as gospel.
A B2B events marketer on r/Emailmarketing captured this perfectly: their open rates improved through better targeting, but clicks dropped. Stakeholders celebrated the opens. The clicks told the real story.
Before You Benchmark: A Diagnostic Checklist
Before you compare your numbers against any industry benchmark table, run through these five checks. Skip this step and you're benchmarking noise against noise.
Deliverability. Above 95% is excellent. Above 89% is acceptable. Below 80% is a serious problem. Nearly 1 in 6 marketing emails never reaches the inbox. EmailTooltester found deliverability rates ranging from 94% (ActiveCampaign) to as low as 47% (Benchmark Email) - your ESP choice alone can swing results by 40+ points.
Bounce rate. Under 1% is ideal. Under 2% is acceptable. Anything higher signals list quality issues actively damaging your sender reputation. (If you need a deeper breakdown, start with bounce rate benchmarks and fixes.)
List hygiene. When did you last verify your email list? Lists decay fast - people change jobs, companies shut down, inboxes get abandoned. Stale data triggers a cascade: bounces spike, sender reputation drops, inbox placement falls, and open rates crater. Running addresses through Prospeo's real-time email verification before sending catches invalid contacts at 98% accuracy, breaking that chain before it starts.
Apple Mail share. What percentage of your list uses Apple Mail? That's your MPP inflation factor. The more Apple Mail in the mix, the less your open-rate comparison reflects reality.
Campaign vs flow mix. Are you blending automated and broadcast metrics? One HubSpot user on Reddit asked which metric to benchmark against - "excluding bots," "adjusted open rate," or raw "open rate" - because they were "wildly different." If your own dashboard can't agree on a number, segment before you benchmark.
How to Improve Your Open Rate
Fix deliverability first. Authenticate with DMARC, DKIM, and SPF. If you haven't complied with Gmail and Yahoo's 2024 sender requirements, you're already behind. No subject line trick will overcome poor inbox placement. (If you want a step-by-step, use this sender reputation guide.)
Clean your list. Verify emails before sending and keep bounce rates under 1%. We've seen teams go from 35% bounce rates to under 4% just by running verification before every campaign - and their open rates climbed as a direct result because sender reputation recovered.
Segment aggressively. The B2B events marketer who improved opens did it through better targeting, not better copy. Send fewer, more relevant emails to smaller, more engaged segments. (For a practical framework, see targeted email campaigns.)
Test subject lines - but only after deliverability is solid. A/B testing on a list with 15% inbox placement is rearranging deck chairs. Optimize send timing for marginal gains, and keep unsubscribe easy. One-click unsubscribe options remove disengaged subscribers before they hurt your reputation. MailerLite's data shows unsubscribe rates jumped from 0.08% to 0.22% year-over-year, and overall engagement improved. If you need ideas, pull from these email subject line examples.
B2B open rates are lower and harder to benchmark - but only if your emails reach the inbox. Prospeo's 143M+ verified emails are refreshed every 7 days, not every 6 weeks. That's how teams like Snyk cut bounce rates from 35% to under 5%.
Stop benchmarking phantom opens. Start sending to verified contacts.
FAQ
What is a good email open rate for my industry?
Above your industry median is "good." For most verticals in 2026, 35-45% is the average range, though Apple MPP inflates these numbers by 15-20+ points. Religion and hobbies sit above 50%; ecommerce and travel hover around 30-33%. Below 25% signals a deliverability or list-hygiene problem, not a subject-line problem.
Are email open rates still reliable in 2026?
Directionally, yes - for spotting trends and deliverability issues. As an absolute metric, no. Apple MPP generates phantom opens for nearly half of all tracked opens. Use open rate for week-over-week trend analysis, not as a standalone KPI. CTOR and CTR are more trustworthy engagement signals.
What's the difference between open rate and CTOR?
Open rate equals opens divided by emails delivered. CTOR (click-to-open rate) equals clicks divided by opens - measuring content relevance among people who actually opened. The 2026 median CTOR is ~6.8%. MPP still distorts CTOR by inflating the denominator, so your real CTOR is likely higher than reported.
How can I reduce my email bounce rate quickly?
Verify addresses before sending using a real-time verification tool, remove hard bounces immediately after every send, and re-verify your full list every 3-6 months. Target under 1% bounce rate - anything above 2% is actively damaging your sender reputation and dragging down every other metric in your dashboard.