Average Newsletter Open Rate in 2022: Definitive Benchmarks
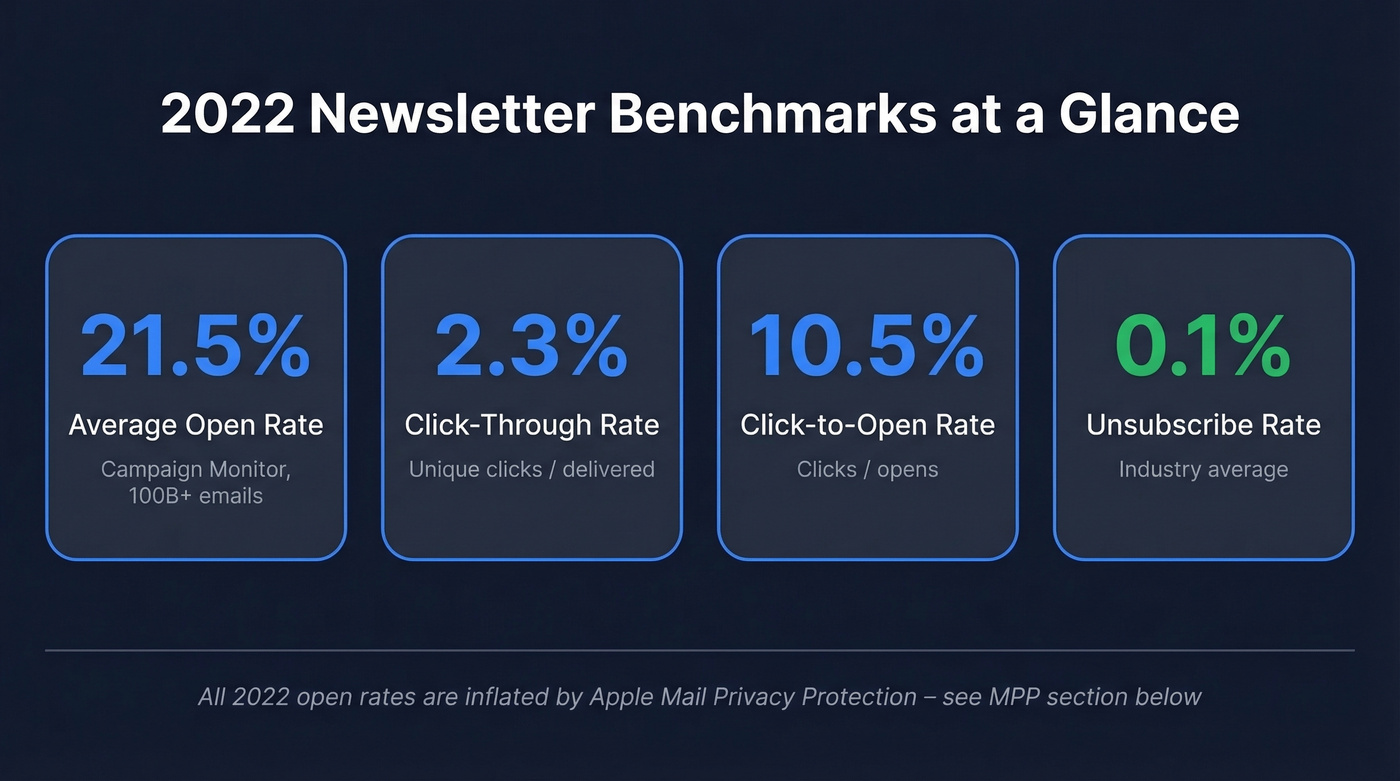
Your CMO needs three-year email benchmarks for a board deck. Every benchmark page has been updated to show 2026 figures, burying the 2022 data you actually need. Here's the number: the average newsletter open rate in 2022 was 21.5%, based on Campaign Monitor's analysis of 100+ billion emails. But that number comes with a massive asterisk - and if you don't understand it, you'll draw the wrong conclusions from your historical data.
The Quick Numbers
| Metric | 2022 Average | Source |
|---|---|---|
| Open Rate | 21.5% | Campaign Monitor |
| CTR | 2.3% | Campaign Monitor |
| CTOR | 10.5% | Campaign Monitor |
| Unsubscribe Rate | 0.1% | Campaign Monitor |
| Open Rate | 21.33% | Mailchimp benchmark table (2022) |
A widely circulated Mailchimp 2022 benchmark table puts the overall average at 21.33% - close enough to treat as consensus.
Both numbers are inflated by Apple Mail Privacy Protection, which affected 51% of email clients by mid-2022. We cross-referenced both major 2022 datasets to confirm the 21-21.5% range, and that convergence gives us high confidence in the figure.
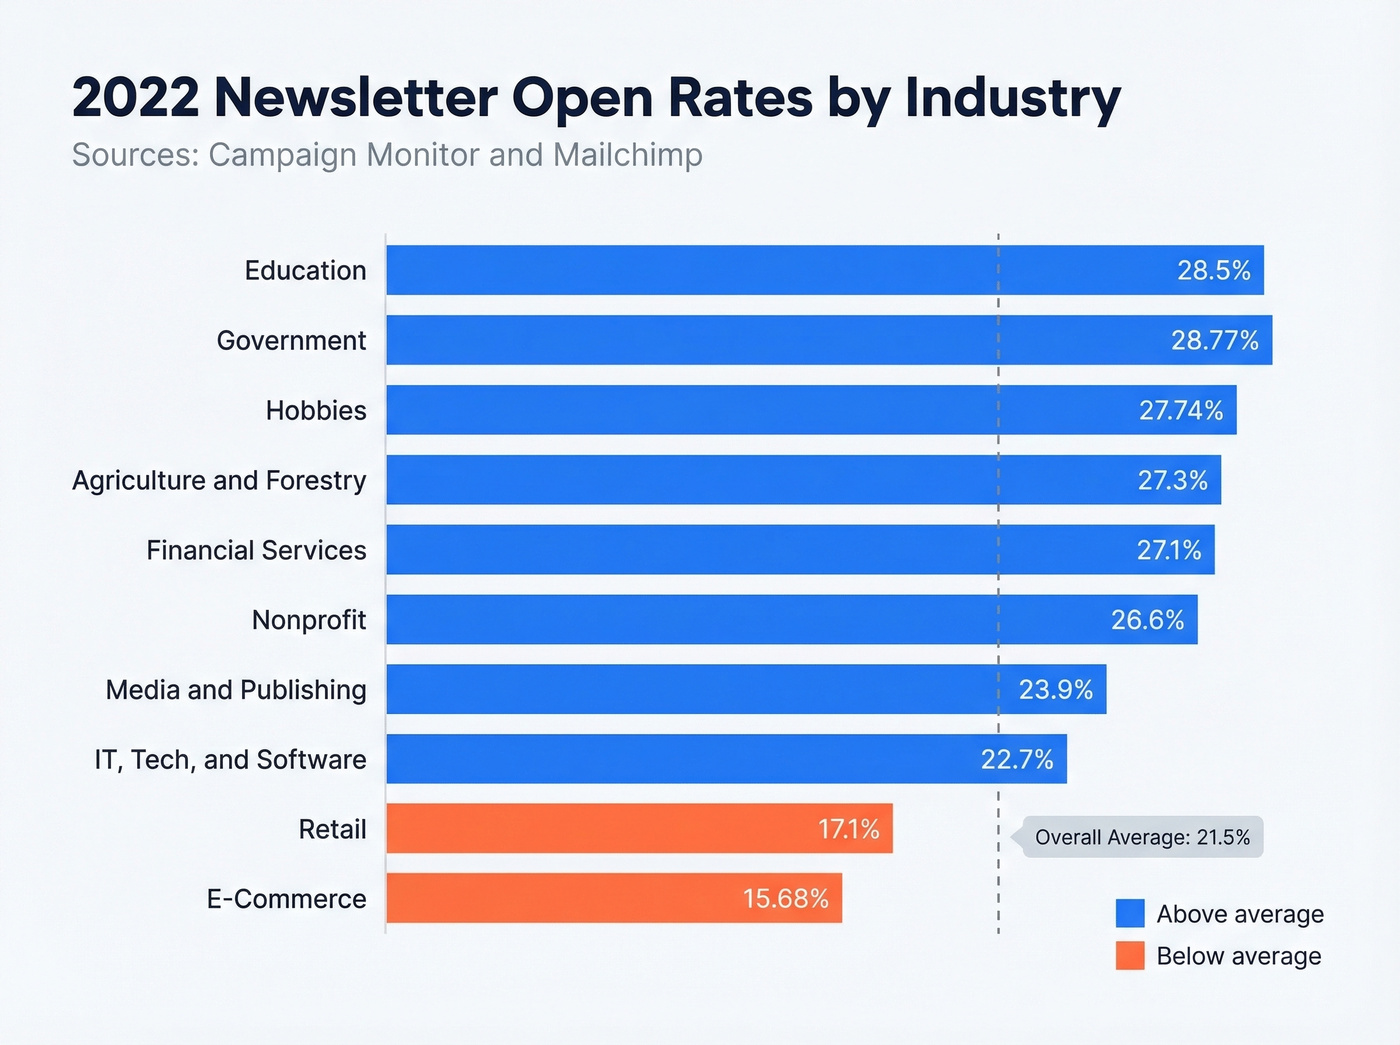
2022 Open Rates by Industry
Industry benchmarks varied wildly. Education crushed it at 28.5%, while Retail and E-Commerce sat near the bottom. Here's how the two major datasets compare:
| Industry | Campaign Monitor | Mailchimp (2022) |
|---|---|---|
| Education | 28.5% | - |
| Government | - | 28.77% |
| Hobbies | - | 27.74% |
| Agriculture & Forestry | 27.3% | - |
| Financial Services | 27.1% | - |
| Nonprofit | 26.6% | - |
| Media/Publishing | 23.9% | 22.15% |
| IT/Tech/Software | 22.7% | - |
| Retail | 17.1% | - |
| E-Commerce | - | 15.68% |
| All Industries | 21.5% | 21.33% |
One important note on methodology: Campaign Monitor's "2022" report is explicitly based on emails sent throughout 2021, while the Mailchimp figures come from a 2022-labeled table republished by a third party. Despite different approaches, both converge around 21-21.5%.
The takeaway: compare against your industry, not the overall average. If you're in E-Commerce and hitting 18%, you're outperforming your vertical. If you're in Education and hitting 22%, you're underperforming badly. Retail saw the biggest year-over-year jump at +4.5%, likely inflated by MPP adoption among consumer-facing audiences who skew heavily toward Apple devices.
For context, a September 2022 r/marketing thread frames a 32% open rate as "fairly average" - which tracks with MPP inflation pushing reported rates well above the 21.5% benchmark. A separate r/copywriting discussion asks whether 26% is good in education; compared to the 28.5% education benchmark, it's actually below the vertical average.
Why 2022 Open Rates Are Inflated
Here's the thing: 2022 was the year open rates stopped meaning what they used to.
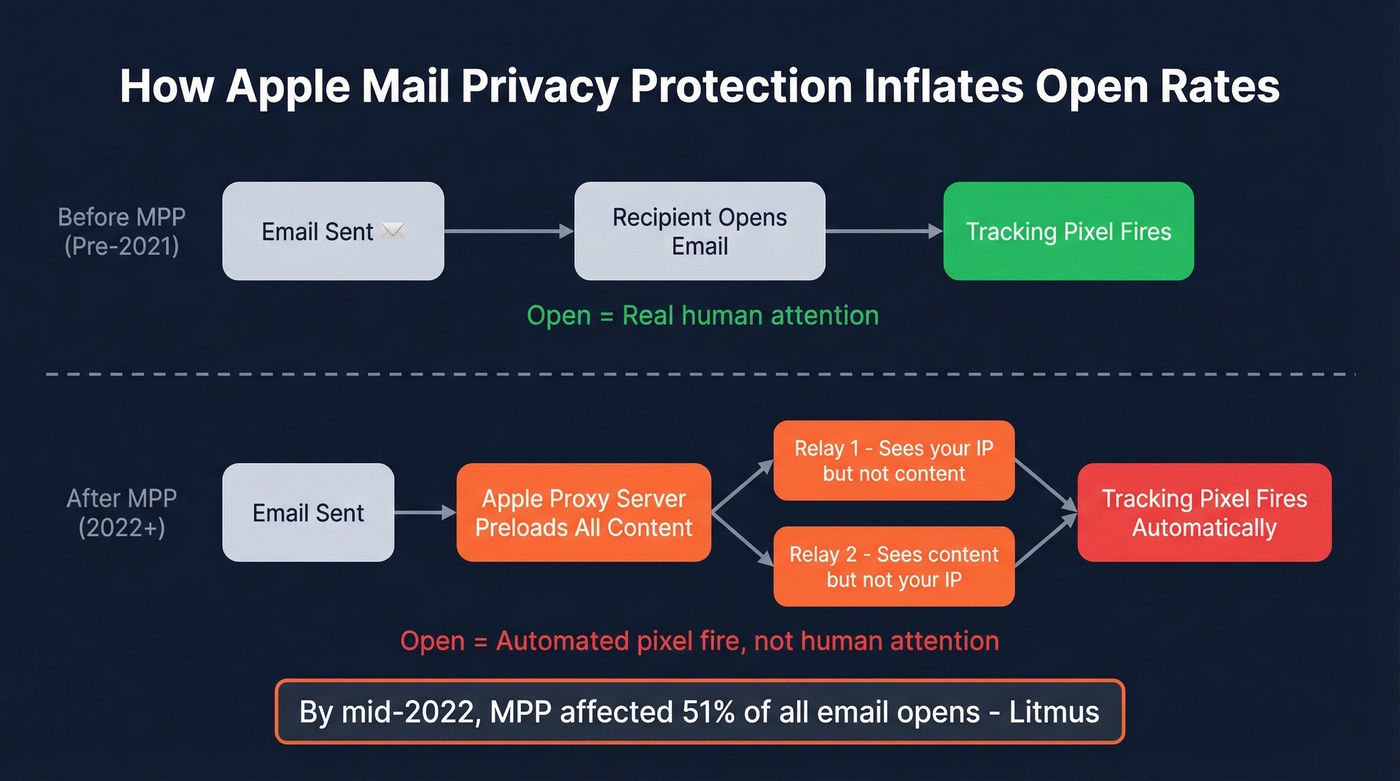
Apple Mail Privacy Protection, released in September 2021, preloads remote content through proxy servers. Tracking pixels fire whether or not a human actually opens the email. Apple routes content through two separate relays - one sees your IP but not the content, the other sees content but not your IP - making it impossible to correlate opens with individual recipients. By mid-2022, MPP-protected clients accounted for 51% of all email opens.
The fingerprint is obvious in the year-over-year numbers: open rates jumped +3.5% while click-through rates dropped -0.3%. Opens went up, but engagement went down. That's not a healthier audience - that's automated pixel fires masquerading as human attention. Some industry estimates put MPP-driven inflation at 35%+ for lists with heavy Apple Mail usage.
If you're still reporting open rates to your board without an MPP disclaimer, you're lying with accurate data. We've seen teams celebrate "record open rates" in 2022 that were entirely explained by Apple's privacy changes. Stop it.
When your list skews heavily toward Apple Mail users, your true human open rate in 2022 was dramatically lower than what your ESP reported. Keep that in mind when comparing to pre-2021 benchmarks.
MPP inflated every open rate in 2022 - but bounced emails deflated them. If 10% of your list is invalid, your benchmarks are meaningless. Prospeo's 5-step email verification catches bad addresses with 98% accuracy on a 7-day refresh cycle, so your open rates reflect real engagement, not delivery failures.
Stop benchmarking against broken data. Clean your list first.
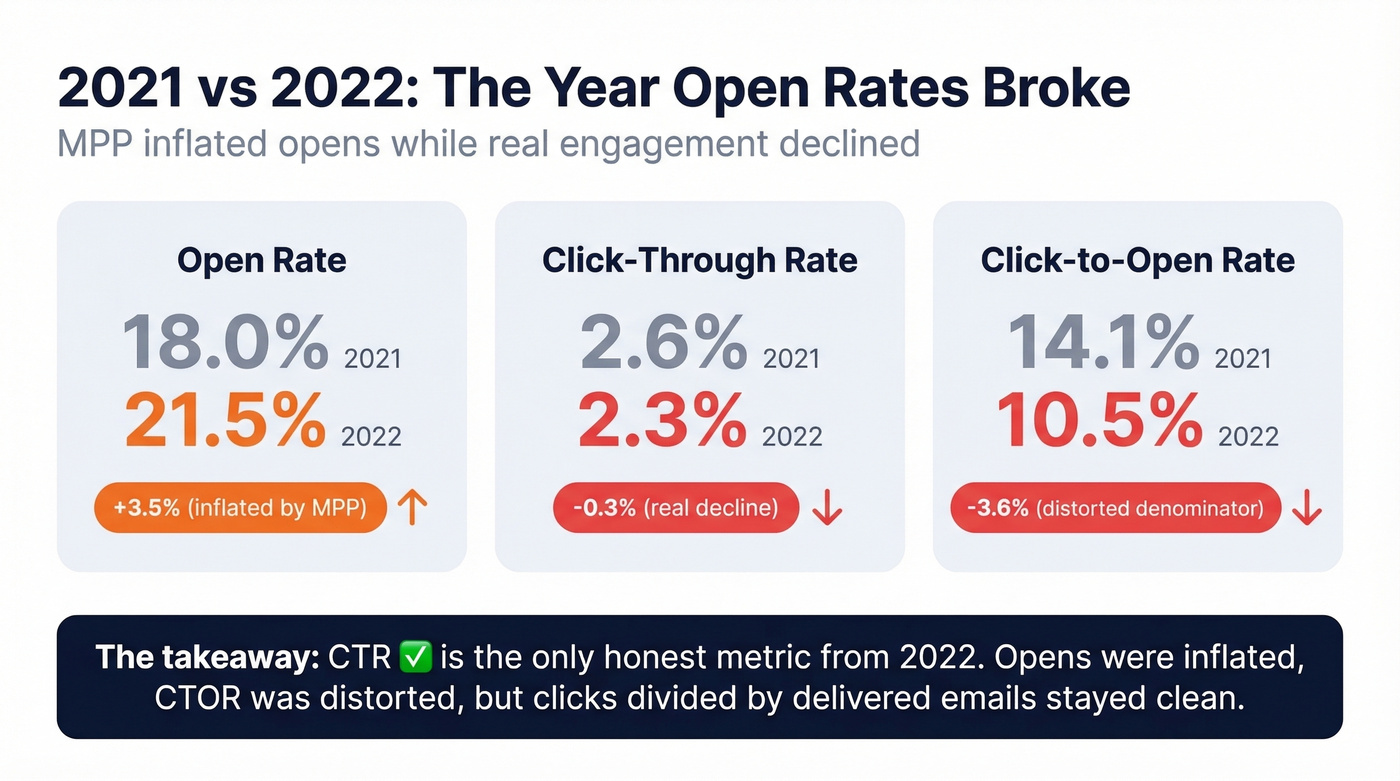
Year-Over-Year: 2021 to 2022
| Metric | 2021 | 2022 | Delta |
|---|---|---|---|
| Open Rate | 18.0% | 21.5% | +3.5% |
| CTR | 2.6% | 2.3% | -0.3% |
| CTOR | 14.1% | 10.5% | -3.6% |
2021 figures derived from reported YoY deltas.
Click-through rate was the only honest metric in 2022. Opens were inflated by MPP. CTOR was distorted because its denominator - opens - was artificially high. CTR, unique clicks divided by delivered emails, remained untouched by Apple's privacy changes.
Let's be blunt: if you're doing historical comparisons, CTR is your most reliable anchor. Everything else is contaminated. If you need a refresher on how click metrics are calculated, use the CTR formula as your baseline.
Benchmarks by Region and Day
By Region:
| Region | Open Rate |
|---|---|
| UK | 22.9% |
| APAC | 22.4% |
| EU | 22.1% |
| Americas | 21.0% |
By Day of Week:
| Day | Open Rate | CTR |
|---|---|---|
| Monday | 22.0% (highest) | 2.3% |
| Tuesday | 21.8% | 2.4% (highest) |
| Sunday | 20.3% (lowest) | 2.1% |
Monday won on opens, Tuesday won on clicks. The gap between best and worst day was less than 2 percentage points - meaningful at scale, but don't restructure your entire send calendar over it. If you're optimizing send strategy beyond newsletters, the best time to send data is a useful cross-check.
Using 2022 Benchmarks in 2026
Three rules for using these numbers without misleading yourself or your stakeholders.
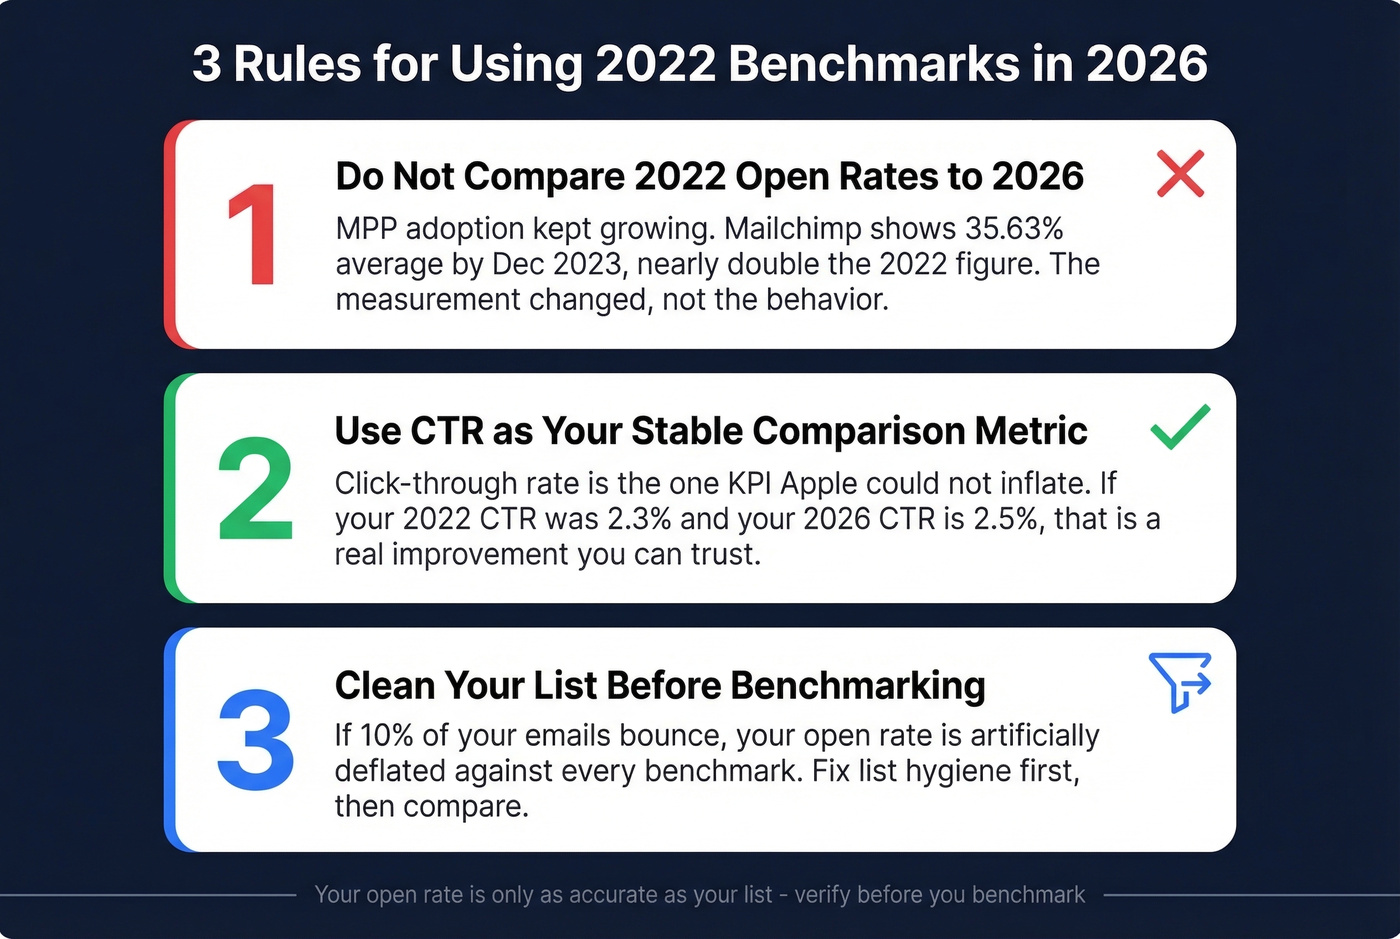
Don't compare 2022 open rates to 2026 figures. MPP adoption has only grown. Mailchimp's December 2023 data already shows 35.63% as the overall average, nearly double the 2022 figure. The measurement changed, not the behavior. If you need a current baseline, compare against a standard email open rate for 2026.
Use CTR as your stable comparison metric. It's the one KPI that Apple couldn't inflate. If your 2022 CTR was 2.3% and your 2026 CTR is 2.5%, that's a real improvement you can trust. When evaluating performance against any newsletter benchmark, clicks tell the truth that open rates no longer can. For a broader view of what “good” looks like now, see what is a good email open rate.
Clean your list before benchmarking. Your open rate is only as accurate as your list. If 10% of your emails bounce, your reported open rate is artificially deflated against every benchmark in this article. We've watched teams agonize over "low" open rates that turned out to be a list hygiene problem, not a content problem. Prospeo's email verification catches invalid addresses with 98% accuracy on a 7-day refresh cycle, so your benchmarks reflect actual engagement rather than delivery failures. If you’re diagnosing deliverability, start with email bounce rate benchmarks and fixes, then work through an email deliverability guide to isolate root causes.
CTR is the only honest metric from 2022 - but it still requires emails that actually land in inboxes. Every bounced email is a click you'll never get. Prospeo verifies emails at 98% accuracy for ~$0.01 each, with spam-trap removal and catch-all handling built in.
Get 75 free verified emails and see what your real benchmarks look like.
FAQ
What's a good newsletter open rate?
Anything above 21.5% beat the 2022 cross-industry average, but industry context matters far more than the headline number. Education averaged 28.5%, E-Commerce sat at 15.68%. Always benchmark against your vertical.
Why are 2026 open rate benchmarks so much higher than 2022?
Apple MPP adoption kept growing after 2022, inflating reported opens further each year. Mailchimp's December 2023 data already shows 35.63%. The jump is largely artificial pixel fires, not genuine engagement improvement.
How do I keep email metrics accurate?
Start with list hygiene - verify every address before sending. Remove non-engagers quarterly to prevent silent list decay. And for any historical comparison, anchor on CTR rather than open rates. It's the only metric that survived MPP intact.