Standard Email Open Rate in 2026: Real Benchmarks
A marketer on r/Emailmarketing ran a weekly newsletter to 60,000 subscribers for six years. Open rate: a steady 45%. Then April 2024 hit, and it cratered to 25% - with no changes to content, format, or sending schedule. SPF, DKIM, DMARC all passed. The ESP blamed "content quality." Sound familiar?
Here's the thing about the standard email open rate as a benchmark: you'll find numbers ranging from 21.5% to 42.35%, and every source acts like theirs is the definitive answer. They're all technically correct and practically useless without context. Email still returns $36-$42 for every $1 spent, so it's worth getting the measurement right.
The Short Version
- The honest benchmark range: 21.5%-42.35% depending on the source, industry, and how much Apple Mail Privacy Protection inflates the number. Across major benchmarks, averages cluster in the low-30s to low-40s.
- Your dashboard is probably lying: In Jan 2025 data, Apple MPP accounted for 49.29% of all email opens and inflated reported rates by 15-20+ points. That 52% open rate? It's likely closer to 28%.
- The metric that actually matters: Click-to-open rate (CTOR). A 20-30% CTOR tells you whether people who opened your email found it worth clicking. Revenue per recipient is even better if your ESP tracks it.
How Open Rate Is Calculated
Two formulas float around, and which one your ESP uses explains some of the benchmark discrepancy.
Basic formula: Open Rate = (Unique Opens / Total Recipients) x 100
Bounce-adjusted formula (more accurate): Open Rate = (Unique Opens / (Total Recipients - Bounced Emails)) x 100
The difference matters more than you'd think. If you send to 10,000 contacts and 800 bounce, the denominator shifts from 10,000 to 9,200 - enough to swing your rate by a couple of points. Most modern ESPs use the bounce-adjusted version, but almost none make it obvious which formula they're running. When benchmarking, confirm you're comparing unique opens, not total opens, which count every open event per recipient.
2026 Email Open Rate Benchmarks
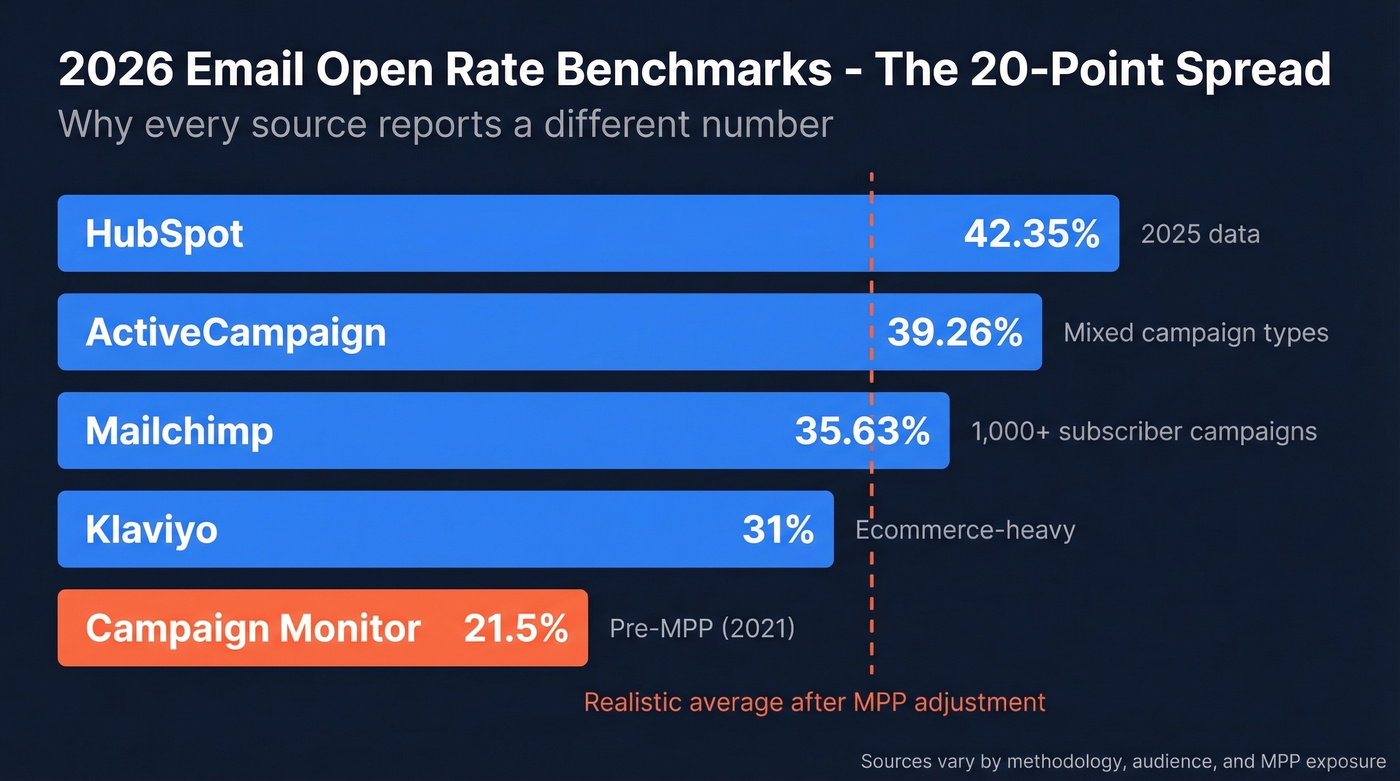
The spread across major sources is wild.
| Source | Avg. Open Rate | Click Rate | Data Period | Notes |
|---|---|---|---|---|
| Mailchimp | 35.63% | 2.62% | Dec 2023 | Billions of emails; campaigns sent to 1,000+ subscribers |
| ActiveCampaign | 39.26% | 6.21% | Jan 1-Dec 10, 2025 | Includes mixed campaign types |
| Klaviyo | ~31% | 1.69% | 2026 | Ecommerce-heavy dataset |
| Campaign Monitor | 21.5% | - | 2021 | Pre-MPP dataset |
| HubSpot | 42.35% | - | 2025 | Higher than many ESP benchmarks |
Why the 20-point spread? Methodology. Mailchimp only tracks campaigns that went to at least 1,000 subscribers. ActiveCampaign's click rate includes mixed campaign types, which lifts the average. Campaign Monitor's benchmark is from 2021, reflecting the industry standard before Apple MPP fully distorted the numbers. None of these are wrong - they're measuring different populations.
By Industry
| Industry | Open Rate | Click Rate | Source |
|---|---|---|---|
| Non-profit | 40.04%-42.68% | 3.27% | Mailchimp + ActiveCampaign |
| Media/Publishing | 43.16% | 6.84% | ActiveCampaign |
| Education | 35.64% | 3.02% | Mailchimp |
| Healthcare | 41.48% | 5.94% | ActiveCampaign |
| Software/Tech | 36.20% | 5.67% | ActiveCampaign |
| Business/Finance | 31.35% | 2.78% | Mailchimp |
| Ecommerce/Retail | 29.81%-35.66% | 1.69%-1.74% | Mailchimp + ActiveCampaign + Klaviyo |
| Government | 40.55% | - | Mailchimp |
| Real Estate | 32.21% | - | Mailchimp |
Non-profits and media consistently top the charts. Ecommerce sits at the bottom. If you're an ecommerce brand comparing yourself to a non-profit's open rate, you're going to feel terrible for no reason.
B2B vs. B2C
B2B email benchmarks run higher than most people expect. The median B2B open rate sits around 36.7%-42.35%, with click rates between 2.0%-4.0%. Top-quartile B2B programs hit 50%+ opens and 10%+ CTR - numbers that would look suspicious in B2C.
But there's a catch one B2B marketer captured on r/Emailmarketing: open rates can improve with tighter targeting while clicks actually soften. You send to fewer people, the open rate looks great, and stakeholders still complain because total engagement volume dropped. Opens alone don't tell the story. In B2B especially, the gap between "opened" and "took action" is where the real performance signal lives. Cold outreach reply rates have slid from 6.8% in 2023 to 5.8% in 2025, making warm-list engagement even more critical.
Campaigns vs. Automated Flows
This is where the data gets genuinely interesting - and where we've seen the biggest disconnect between effort and results.
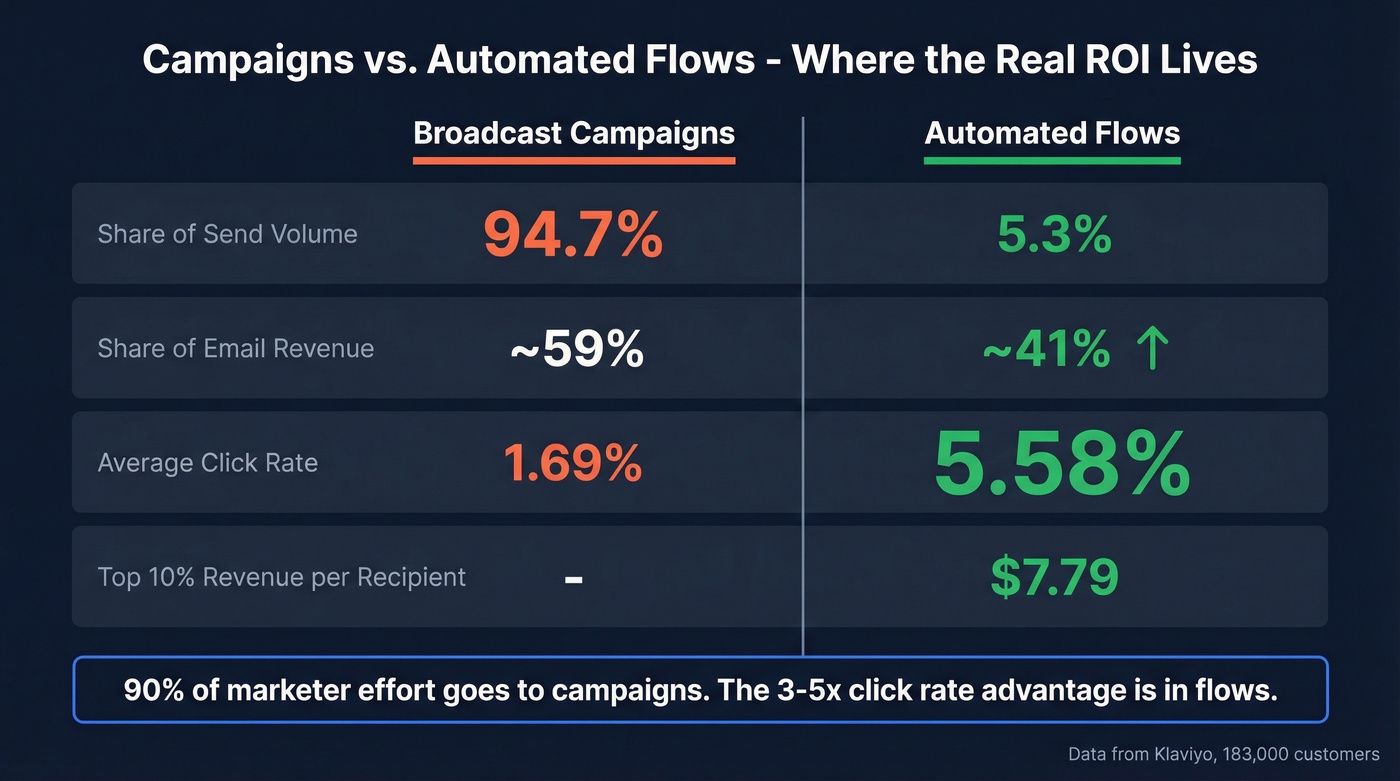
Klaviyo's dataset across 183,000 customers shows that campaigns account for 94.7% of send volume, but automated flows generate roughly 41% of total email revenue from just 5.3% of sends. The engagement gap is stark: flows average a 5.58% click rate versus 1.69% for campaigns. Top 10% flows hit revenue per recipient of $7.79 and click rates above 10%. Welcome sequences, abandoned cart flows, and post-purchase follow-ups consistently outperform broadcast campaigns by 3-5x on click rate.
Most marketers spend 90% of their time optimizing campaigns when the real upside is in flows. If you're obsessing over your campaign open rate, you're probably optimizing the wrong thing entirely.
Let's be honest: if your automated flows aren't generating at least 30% of your email revenue, stop tweaking subject lines on your next broadcast and go build a welcome sequence instead. The ROI gap is that large.
Inflated open rates mask a deeper problem: bad data. When 35% of your list bounces, ESPs throttle you and open rates crater - just like that marketer's overnight drop from 45% to 25%. Prospeo's 5-step email verification delivers 98% accuracy and under 4% bounce rates across 15,000+ companies.
Fix the data and the open rates fix themselves.
Why Your Open Rate Is Inflated
That number on your dashboard isn't what you think it is.
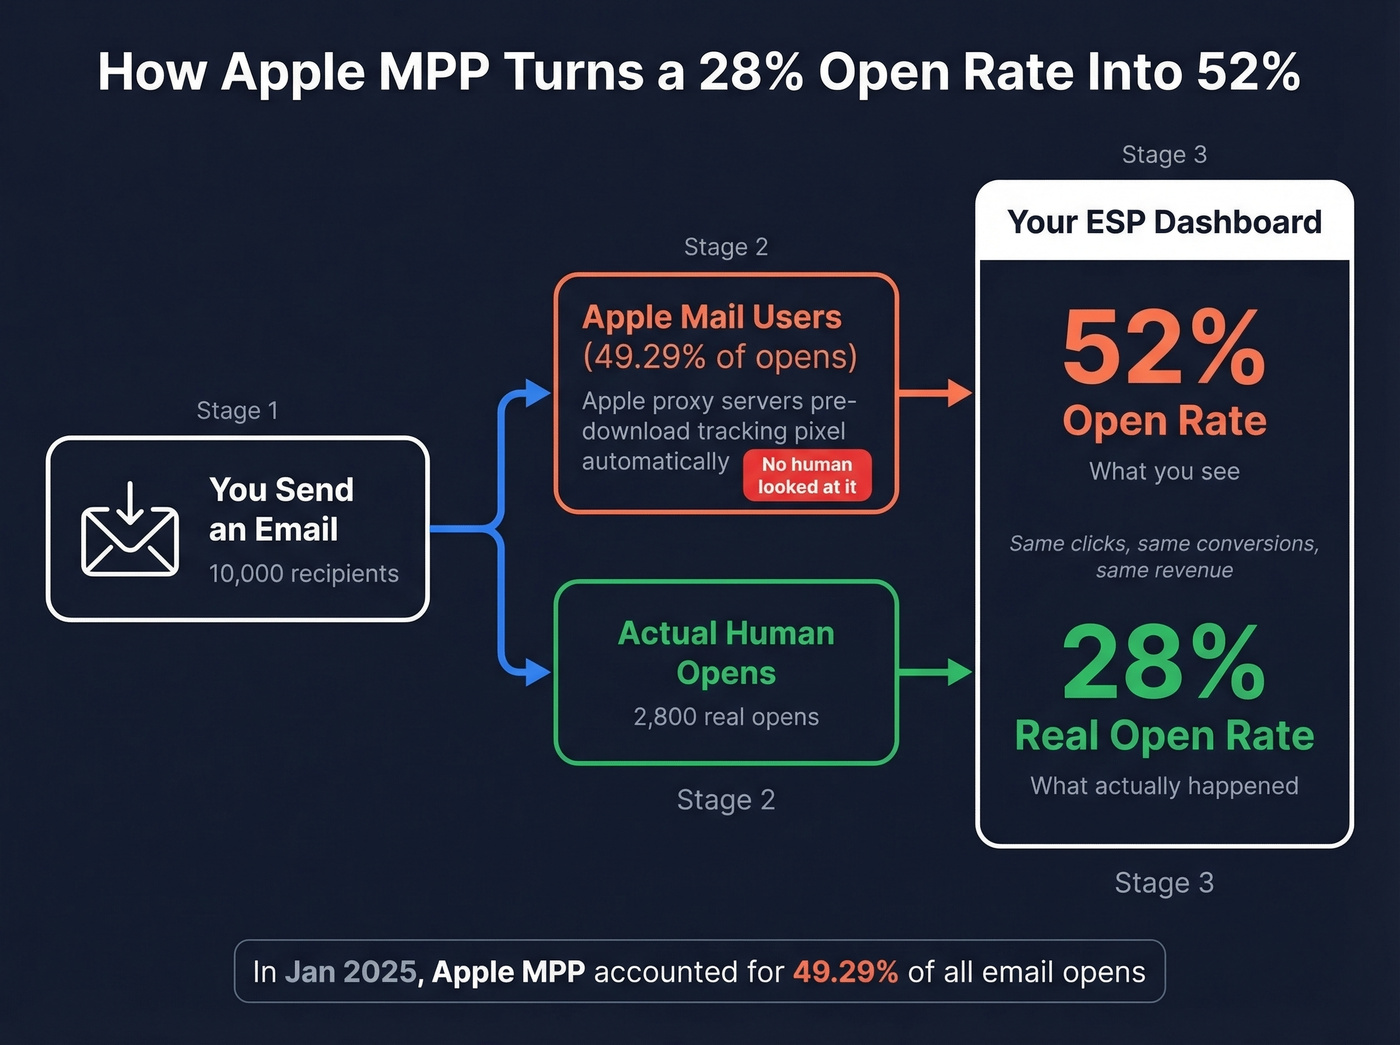
Apple MPP is the biggest culprit. In Jan 2025 data, MPP accounted for 49.29% of all email opens. The mechanism is straightforward: Apple's proxy servers pre-download tracking pixels for every email delivered to Apple Mail, regardless of whether the recipient ever looks at it. Your ESP sees a pixel fire and logs an "open." The human never scrolled past the subject line. A campaign that genuinely reaches 28% of recipients now shows 52% on your dashboard. Same clicks, same conversions, same revenue - just a vanity metric that doubled overnight.
If you've ever seen a dashboard reporting 80%+ opens, MPP inflation on a small, Apple-heavy list is almost certainly the explanation.
Bot clicks and dark clicks compound the problem. Security scanners pre-click links in emails to check for malware. These "dark clicks" inflate your CTR and can trigger automation workflows, sending a follow-up sequence to someone who never actually engaged. AI bot clicks peaked at 3+ million per day across monitored platforms in early 2025.
Gmail and Yahoo's 2024 enforcement hit hard. Starting in early 2024, bulk senders shipping 5,000+ messages per day must pass SPF, DKIM, and DMARC authentication. Spam complaint rates above 0.3% trigger filtering, and Gmail recommends staying below 0.10%. One-click unsubscribe headers became mandatory, with opt-outs processed within 2 days.
That Reddit marketer who saw a 45% to 25% drop? Their automated emails still reported ~45% opens while broadcasts cratered - a telling sign that inbox placement, not content, was the issue. Another on r/Emailmarketing running a beehiiv newsletter saw 35% to 18% after July 2024. Both had authentication in place. Both got told by their ESP it was a "content quality" issue. It wasn't.
iOS 18.2 and Gmail UI changes add more noise. Apple iOS 18.2 introduced new inbox tabs and AI-generated previews that can replace preheaders in some views. Gmail's "Manage subscriptions" feature centralizes subscriptions and makes unsubscribing easier, surfacing high-frequency senders first for the chopping block.
What to Measure Instead
Open rate isn't dead, but it's been demoted. Here's the priority order we'd recommend:
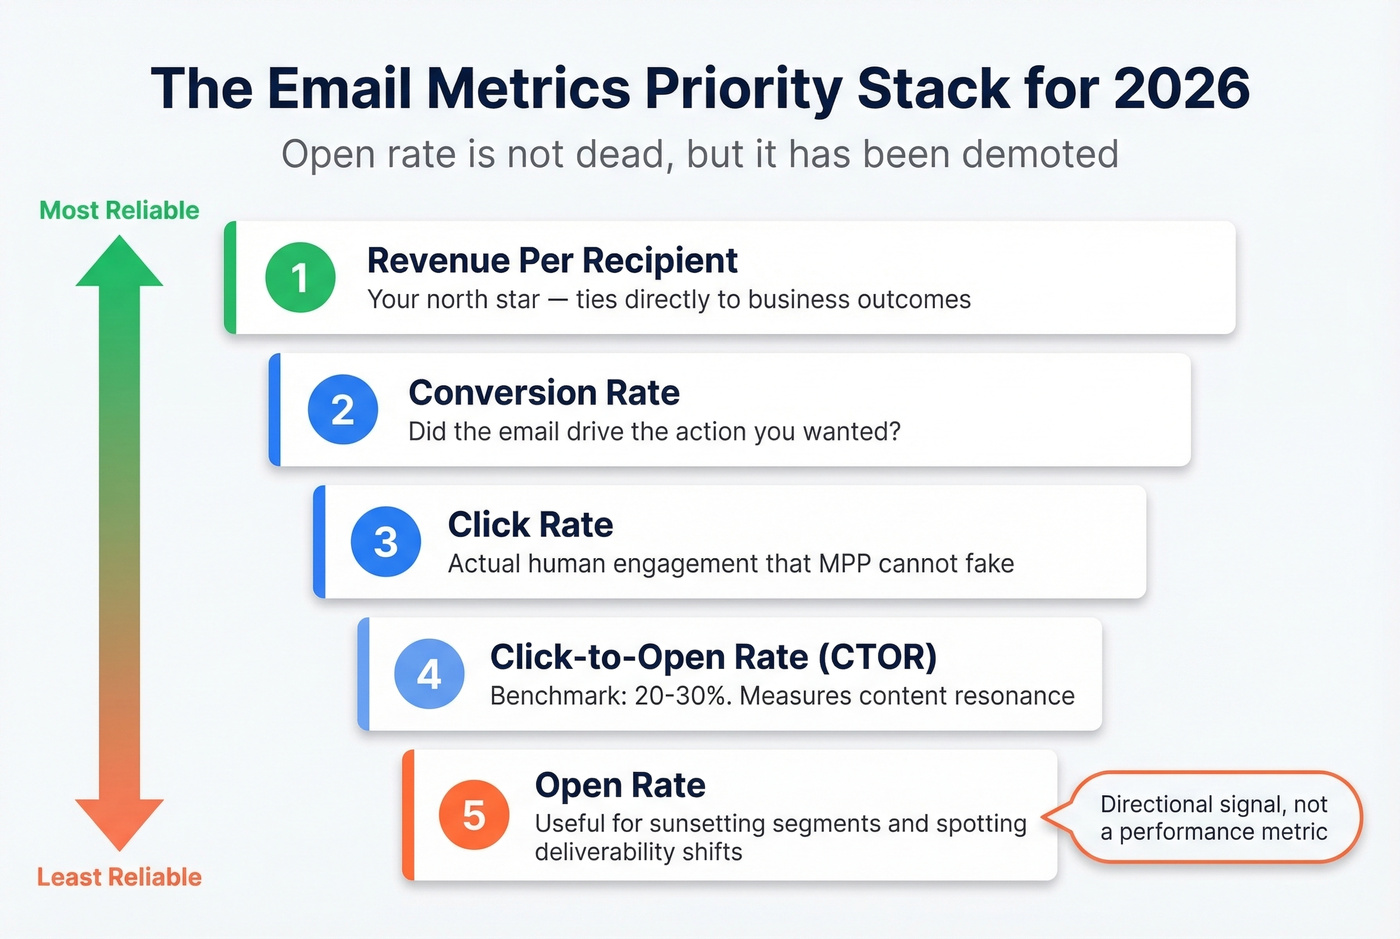
- Revenue per recipient - ties directly to business outcomes. Your north star if your ESP tracks it.
- Conversion rate - did the email drive the action you wanted? Purchase, sign-up, demo booking.
- Click rate - actual human engagement that MPP can't fake, though dark clicks still add noise.
- Click-to-open rate (CTOR) - clicks as a percentage of opens. Benchmark: 20-30%. Measures content resonance once someone's in the email. (If you want deeper CTOR benchmarks, see our average click-to-open rate breakdown.)
- Open rate - useful for sunsetting segments and monitoring deliverability trends, not for measuring performance.
The metric still earns its keep for building campaign exclusion segments with 30/60/90-day windows and spotting deliverability shifts over time. It's a directional signal, not a performance metric.
How to Improve Real Engagement
Even with all the measurement noise, concrete steps move the needle on actual inbox placement and genuine engagement.
Get authentication right. SPF, DKIM, and DMARC aren't optional anymore. If you're sending 5,000+ emails per day without all three, you're actively losing inbox placement. Global inbox placement sits around 84% - roughly one in six emails never reaches the inbox. Gmail performs best at 87.2%, while Microsoft lags at 75.6%. If you need a checklist, start with email authentication and a quick SPF DKIM & DMARC sanity check.
Keep spam complaints under 0.10%. Gmail's hard ceiling is 0.3%, but their recommendation is below 0.10%. Every complaint signals to inbox providers that your mail isn't wanted. (More on the mechanics in our email spam filters guide.)
Sunset unengaged contacts aggressively. If someone hasn't opened or clicked in six months, they're hurting your sender reputation more than they're helping your revenue. Remove them or move them to a re-engagement flow with a hard cutoff.
Segment by engagement tiers. Send your most engaged contacts more frequently, your least engaged contacts less. Most teams blast the same cadence to everyone and watch deliverability degrade in slow motion.
Fix your data quality upstream. In our experience, the biggest open-rate killer isn't subject lines - it's list hygiene. Bad email data leads to bounces, which damage sender reputation, which tanks inbox placement, which craters engagement. It's a chain reaction that starts before you ever hit send. Keep bounce rates under 2%, and verify your lists before importing them into your ESP. If you're troubleshooting bounce spikes, compare against average email bounce rate and the common types of email bounces.
Prospeo's 5-step email verification catches invalid addresses, spam traps, and honeypots before they reach your sending infrastructure, with 98% accuracy and a 7-day data refresh cycle. Snyk's team went from a 35-40% bounce rate to under 5% after switching to verified data from Prospeo, which directly protected their sender reputation and inbox placement.
You just read that automated flows outperform campaigns 3-5x on click rate - but only if those emails actually land. Prospeo refreshes 300M+ contacts every 7 days, so your welcome sequences and nurture flows hit real inboxes, not dead addresses. At $0.01 per email, cleaning your list costs less than one bounced send.
Stop sending flows to stale contacts that destroy your domain reputation.
FAQ
What's the standard email open rate in 2026?
Across major benchmarks, averages range from 21.5% to 42.35%, with most clustering in the low-30s to low-40s. Apple MPP inflates reported opens by 15-20+ points on many dashboards, so your "real" rate is likely lower than what you see. Compare against your own historical trend and industry vertical - your audience mix matters more than any universal number.
Why did my open rate suddenly drop in 2024?
Gmail and Yahoo enforced new authentication requirements and spam complaint thresholds starting in early 2024, causing 15-20 point drops for many senders overnight. If SPF, DKIM, and DMARC all pass and you're still down, check your spam complaint rate - anything above 0.10% degrades inbox placement over time.
What's a good click-to-open rate?
A 20-30% CTOR is the accepted benchmark across industries. Below 15% typically means your subject lines are generating opens but your email body isn't compelling enough to drive clicks. Test shorter copy, clearer CTAs, or more relevant offers.
How does list hygiene affect open rates?
Every bounced email damages sender reputation, pushing future messages to spam. Keeping bounce rates under 2% with pre-send verification directly protects inbox placement. Snyk cut their bounce rate from 35-40% to under 5% after implementing proper verification, and their AE-sourced pipeline jumped 180%.
Does Apple Mail Privacy Protection affect open rates?
Apple MPP pre-loads tracking pixels for all Apple Mail users, registering "opens" even when nobody reads the email. In Jan 2025 data, it accounted for 49.29% of all opens. If your list skews heavily toward Apple Mail users, your reported rate could be double the actual engagement.