Average Click-to-Open Rate: What the Numbers Actually Mean in 2026
Search for the average click-to-open rate and you'll find numbers ranging from 5% to 30%. That's not a benchmark - it's a methodology problem.
The all-industries median CTOR sits at 6.81%, based on MailerLite's analysis of 3.6 million campaigns across 181,000 approved accounts. If you've seen sources quoting 20-30%, that guidance is usually rooted in older benchmark framing and different measurement assumptions, not a clean apples-to-apples comparison for 2026.
Apple Mail Privacy Protection (MPP) is a big reason the numbers drift. MPP is active on roughly 49% of email opens, inflating the "opens" denominator and pushing reported CTOR down - sometimes dramatically - even when clicks and conversions haven't changed at all.
What Is CTOR?
Click-to-open rate measures how compelling your email content is to people who actually opened it:
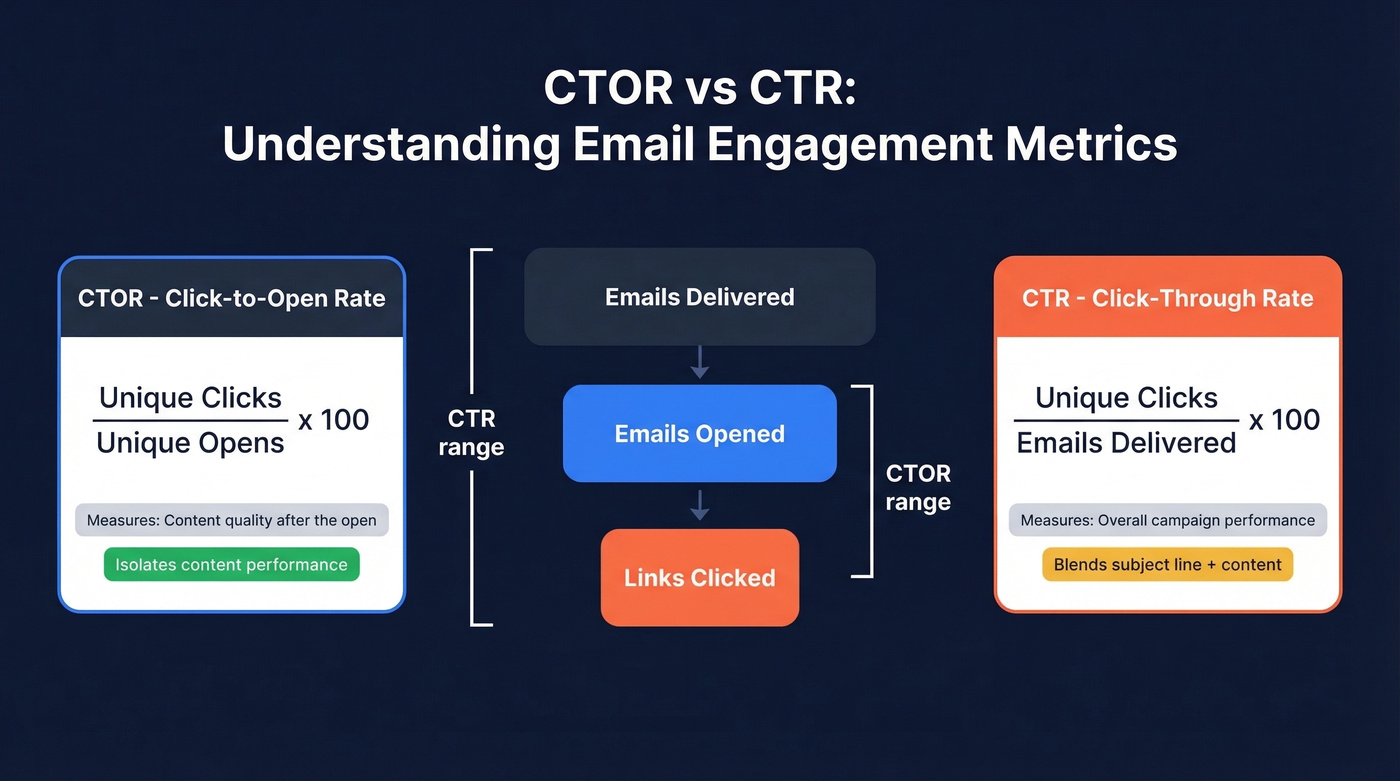
CTOR = (unique clicks / unique opens) x 100
If 1,000 people open your email and 68 click a link, your CTOR is 6.8%.
The key distinction from click-through rate (CTR): CTR divides clicks by total delivered emails, blending subject line performance with content performance into one number. CTOR isolates the content - though it still depends on opens, which are noisier than ever post-MPP. Understanding the relationship between open rate and click-through rate matters because they measure different stages of the same funnel, and conflating them leads to bad decisions.
CTOR Benchmarks by Industry
One of the most recent full-year datasets comes from MailerLite's benchmark study covering December 2024 through November 2025 (median values). HubSpot publishes an all-industries CTOR benchmark as well, and Designmodo publishes a higher-CTOR industry table with less transparent methodology.
| Benchmark | CTOR | Source |
|---|---|---|
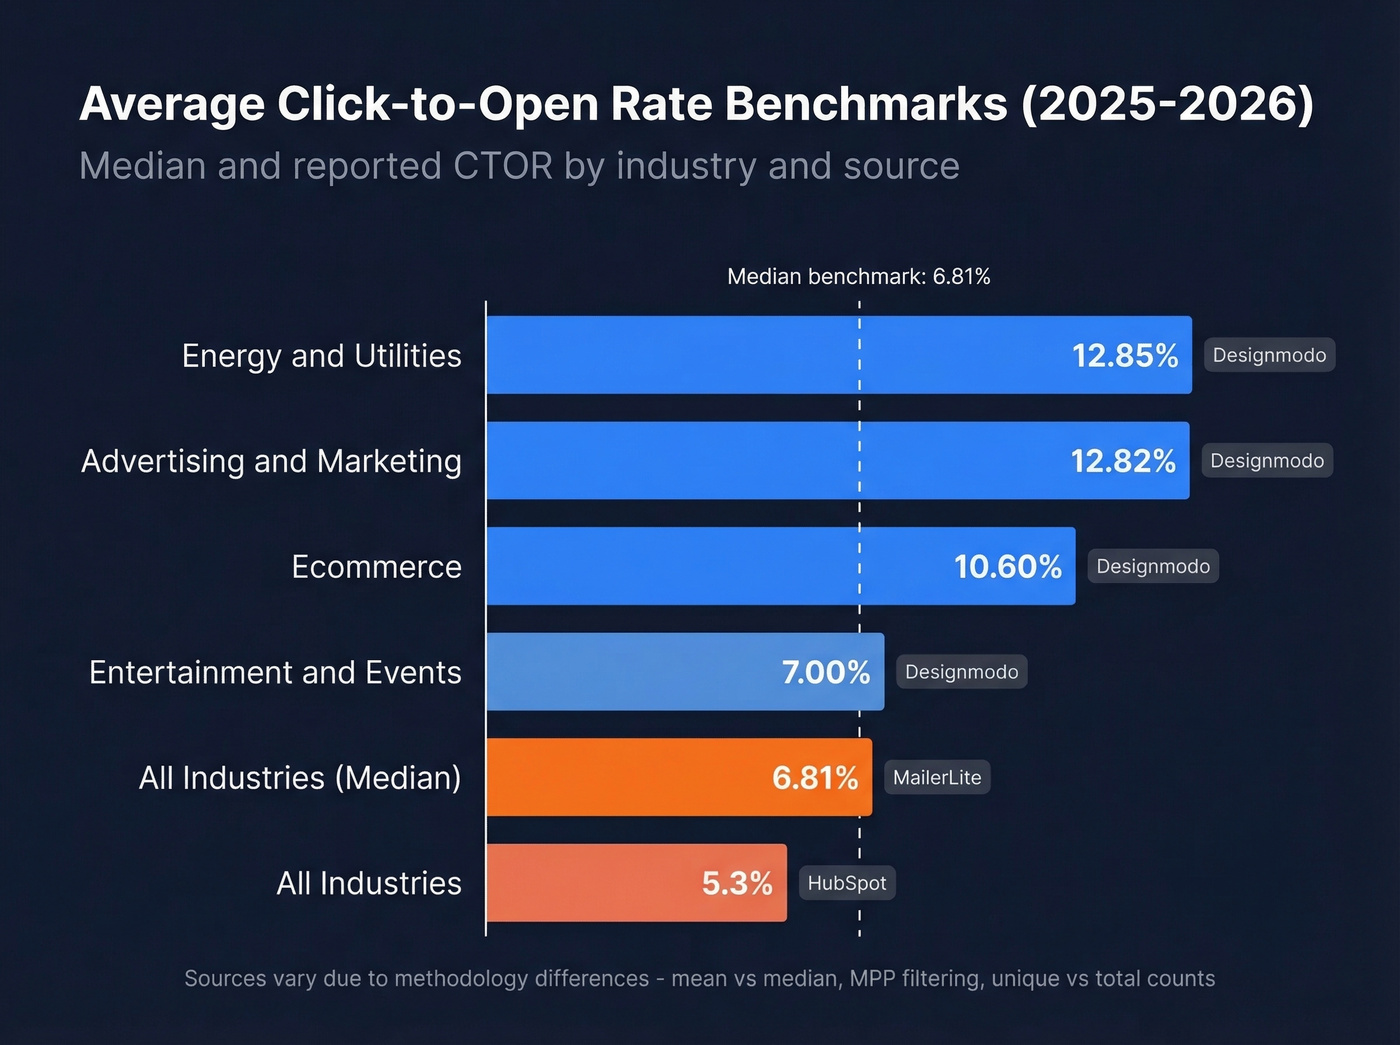
| All industries (median) | 6.81% | MailerLite (Dec 2024-Nov 2025) |
| All industries | 5.3% | HubSpot |
| Energy & Utilities | 12.85% | Designmodo |
| Advertising & Marketing | 12.82% | Designmodo |
| Ecommerce | 10.60% | Designmodo |
| Entertainment & Events | 7.00% | Designmodo |
The 6.81% median is up from 5.63% in 2024, which suggests benchmark math is shifting as platforms and marketers adapt to privacy-era measurement.
One more wrinkle: automated and triggered emails usually beat broadcast campaigns on CTOR. If your "benchmark" mixes both, your number won't mean much. (If you're running outbound sequences, sequence management matters as much as copy.)
Why Every Source Disagrees
Twilio's widely cited guidance says a good CTOR ranges between 20% and 30%. That guidance is commonly associated with older benchmark comparisons - including references to a 2018 global benchmark report - which is why it doesn't line up with median-based, post-MPP datasets.
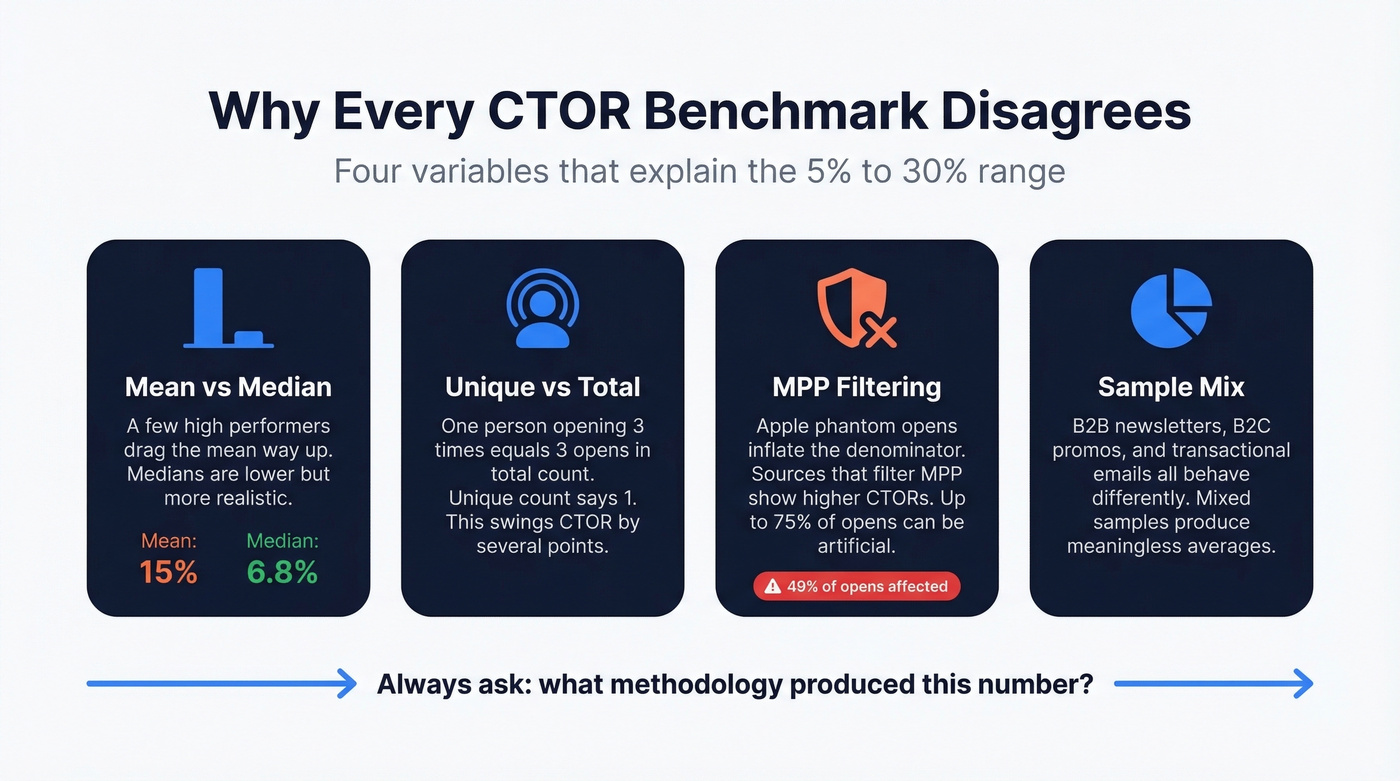
Four variables explain most of the divergence:
Mean vs. median. A handful of high-performing campaigns drag the mean up significantly. MailerLite reports medians, which run lower and are usually more realistic for planning purposes.
Unique vs. total. Some sources count total clicks and total opens - one person opening three times equals three opens. Others count unique. This alone can swing CTOR by several points.
MPP filtering. Sources that don't account for Apple's phantom opens report inflated denominators, pushing CTOR down. Sources that filter or segment by email client often show higher CTORs. In Apple-heavy segments, up to 75% of reported opens are artificial.
Sample composition. B2B newsletters, B2C promo blasts, and transactional emails all behave differently. Designmodo's 7-13% figures can reflect a different campaign mix than a median-based all-industries benchmark.
Here's the thing: a lot of search results still recycle older numbers without explaining the privacy-era measurement shift. That's not benchmarking. It's guesswork.
Bad benchmarks start with bad data. If 16.9% of your emails never reach the inbox, your CTOR is built on a broken denominator. Prospeo's 5-step email verification delivers 98% accuracy - under 4% bounce rates across 15,000+ teams. Stop optimizing content for emails that never arrive.
Clean data fixes every metric downstream. Start with the list.
How Apple MPP Distorts CTOR
Apple Mail Privacy Protection preloads tracking pixels via proxy servers, registering an "open" regardless of whether anyone reads the email.
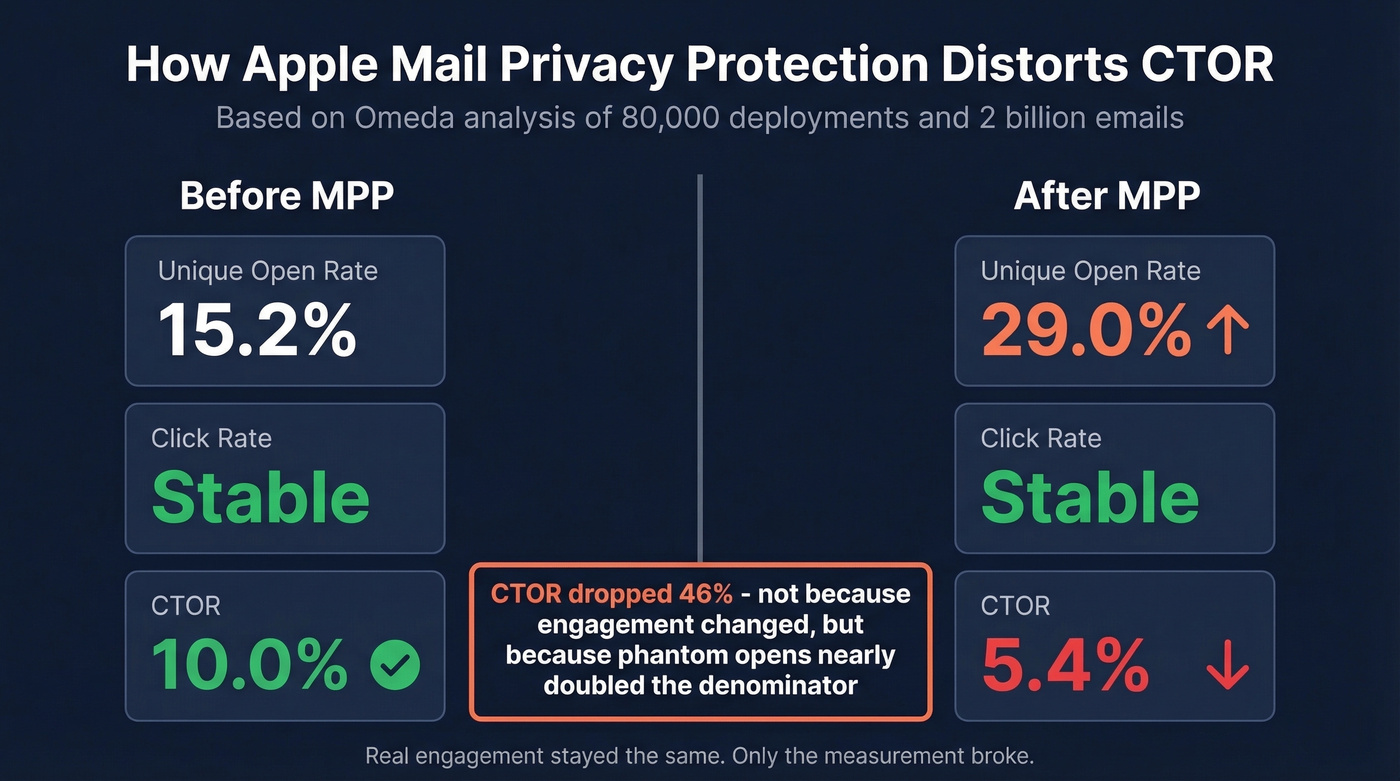
During MPP's rollout, Omeda analyzed roughly 80,000 deployments and 2 billion emails. Unique open rates jumped from 15.2% to 29.0%. Click rates stayed essentially stable. The open-based click metric - effectively CTOR - dropped from 10.0% to 5.4%, purely because the denominator nearly doubled.
It's not just opens. Outlook Safe Links and other security tools can generate automated "dark clicks" that inflate the numerator too. Both sides of the CTOR equation can be compromised, though opens get hit far harder. In many lists, your real content engagement is better than your dashboard suggests.
CTOR vs. CTR: Which Matters More?
| Metric | Formula | Best for | Weakness |
|---|---|---|---|
| CTR | Clicks / delivered | Overall campaign health | Blends subject + content |
| CTOR | Clicks / opens | Content quality | Opens are unreliable |
A common question we see in email marketing communities: opens look weak, but click rate looks strong - is that good? Yes. It usually means your subject line and targeting are filtering to an engaged audience, and your content converts the people who actually pay attention.
Let's be direct: CTOR tells you your content works. Click rate tells you your entire funnel works. In a world where opens are increasingly noisy, the funnel metric wins. If you track one metric in 2026, track click rate. If two, add CTOR. Open rate is optional. (For a broader view, track funnel metrics alongside email KPIs.)
How to Improve Your Email Engagement Rate
Segment Before You Send
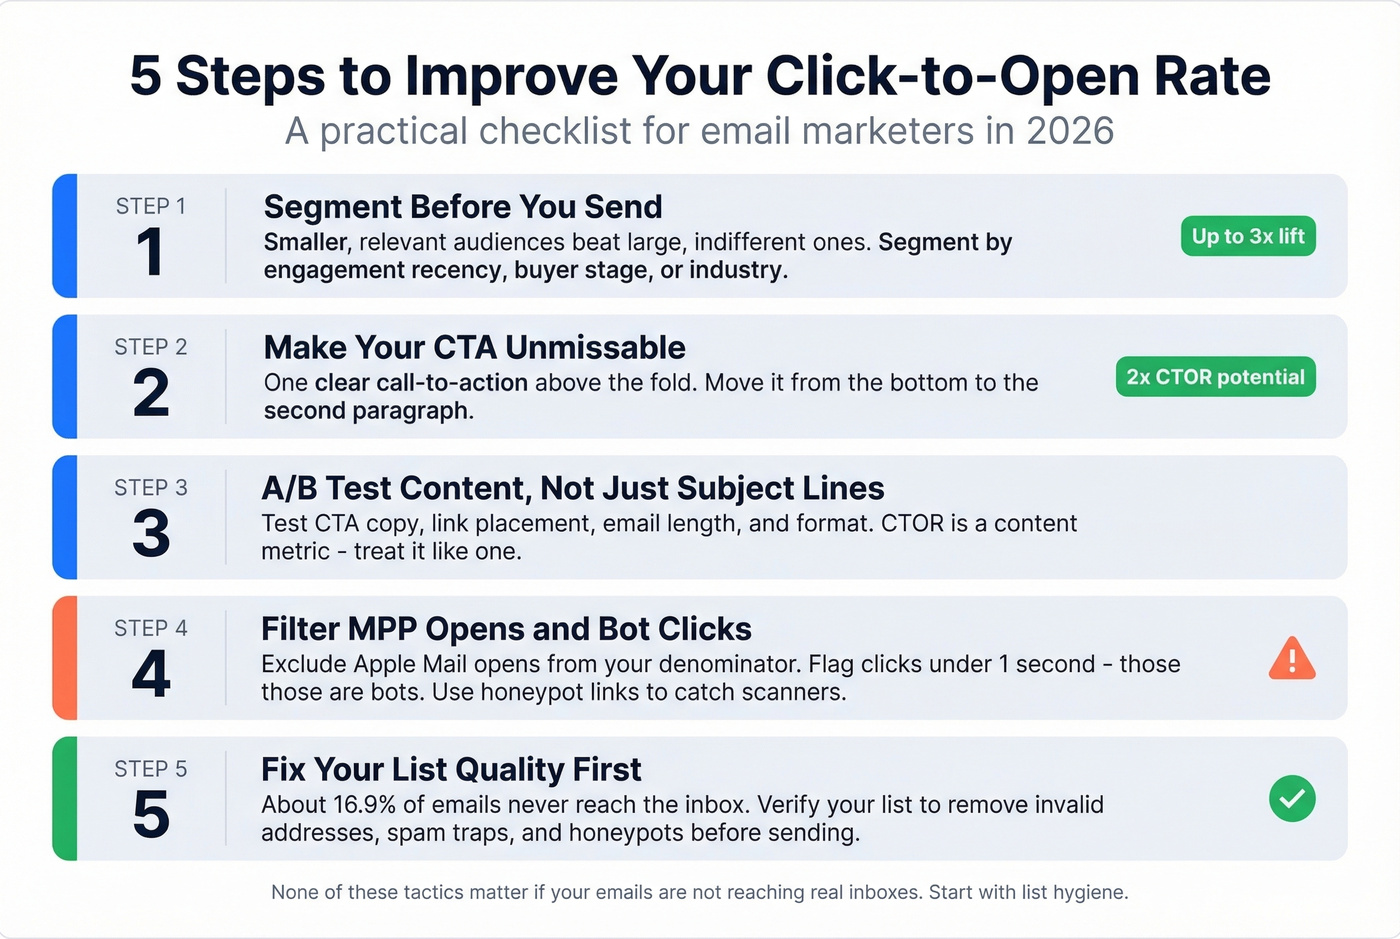
Blasting your entire list guarantees a mediocre CTOR. In our experience, segmented sends consistently outperform full-list blasts - sometimes by 2-3x. Segment by engagement recency, buyer stage, or industry. A smaller, relevant audience will always beat a large, indifferent one. If you need a framework, start with an ideal customer profile and build segments from there.
Make Your CTA Unmissable
One clear call-to-action above the fold. We've seen teams double their CTOR by moving the primary CTA from the bottom of a 500-word email to the second paragraph. Don't make people scroll for the point. (If you want examples, see email call to action.)
A/B Test Content, Not Just Subject Lines
Most teams obsess over subject line testing and ignore the body entirely. Test CTA copy, link placement, email length, and content format. CTOR is a content metric - treat it like one. You can also borrow patterns from proven email subject line examples to keep the test plan structured.
Filter MPP Opens and Bot Clicks
Exclude Apple Mail opens from your CTOR calculation if your ESP supports it. Segment by email client and calculate CTOR for non-Apple users only - that's your clean baseline.
Flag clicks that happen within one second of delivery; those are bots. Some teams use hidden honeypot links to identify automated scanners. Major ESPs have begun automatically filtering known bot clicks, but verify your platform's approach before trusting the numbers.
Fix Your List Quality First
None of these tactics matter if your emails aren't reaching real inboxes. About 16.9% of emails never reach the inbox, and 10.5% land in spam. Bad data creates bounces, bounces damage sender reputation, and damaged reputation tanks inbox placement - making your CTOR unreliable no matter how good your content is. If you're troubleshooting, start with email bounce rate and then work through an email deliverability guide.
Healthy engagement rates start with a clean, verified list. Prospeo's 5-step verification process with 98% email accuracy catches invalid addresses, spam traps, and honeypots before they wreck your deliverability. Skip this step, and you're optimizing content that half your list never sees. (If you're comparing tools, see Bouncer alternatives.)
You just read that MPP inflates opens and bots inflate clicks - both sides of your CTOR equation are compromised. The one variable you can control? Whether your emails reach real inboxes. Prospeo refreshes 300M+ profiles every 7 days and removes spam traps, honeypots, and dead addresses before you ever hit send.
Send to real people. Measure real engagement. Start free today.
FAQ
Is a 5% Click-to-Open Rate Good?
It's solid. 5% sits close to common all-industries benchmarks like 5.3% (HubSpot) and 6.81% (MailerLite median). If your Apple Mail audience share is high, your real CTOR is likely better than reported. Compare against your own month-over-month trend rather than industry averages alone.
Is CTOR Still Reliable After Apple MPP?
More reliable than open rate alone, but still compromised. MPP inflates the denominator on roughly 49% of opens. Filter MPP opens where your ESP supports it, or shift primary focus to click rate and conversions for cleaner signals.
How Do I Calculate a Clean CTOR?
Exclude Apple Mail opens from your denominator if your ESP allows it, or segment by email client and calculate CTOR for non-Apple users only. Pair this with verified contact data to ensure the emails you're measuring actually reached real inboxes - not spam traps or dead addresses dragging down your metrics.