B2B Conversion Rate Optimization: The Full-Funnel Playbook for 2026
Your CMO asks why the site converts at 1.2%. You spend three weeks redesigning the hero section, rewriting CTAs, and A/B testing button colors. Conversions tick up to 1.4%. Pipeline doesn't move.
That's because B2B conversion rate optimization isn't about button colors - it's about fixing the middle of your funnel, where MQLs stall, SQLs ghost, and opportunities die quietly. The winning vendor lands on the buyer's Day One shortlist 95% of the time. Forty-one percent of buyers already have a preferred vendor before they even start evaluating alternatives. If you're not already there, no landing page tweak will save you.
The Short Version
Your website conversion rate is probably fine. The real damage happens mid-funnel - MQL-to-SQL and SQL-to-Opportunity are where most B2B revenue evaporates. Start by benchmarking against your specific industry, not some generic "2-3%" number. Diagnose with heatmaps and form analytics. Fix messaging clarity before you run a single test. And if your converted leads aren't responding to follow-up, your data quality is the bottleneck - verify contact data before it hits your CRM.
What Is B2B CRO, Really?
B2B CRO is the practice of improving the percentage of visitors, leads, or prospects who take a desired action at each stage of your funnel. The formula is simple:
Conversion Rate = (Conversions / Total Visitors) x 100
What makes B2B different from B2C is everything around that formula. B2B buying cycles average 10.1 months. Decisions involve buying committees, not individuals. And per Forrester research, 92% of buyers start with at least one vendor already in mind. A "conversion" in B2B is usually a demo request, a content download, or a form fill - not a purchase.
That means CRO isn't about impulse optimization. It's about reducing friction across a long, multi-stakeholder journey, and any effective strategy must account for that complexity from the start.
| Factor | B2B | B2C |
|---|---|---|
| Avg. cycle | 10.1 months | Minutes to days |
| Decision-maker | Committee | Individual |
| Conversion event | Demo / form fill | Purchase |
| Traffic volume | Low-moderate | High |
| Optimization focus | Pipeline quality | Transaction volume |
B2B Conversion Benchmarks by Industry
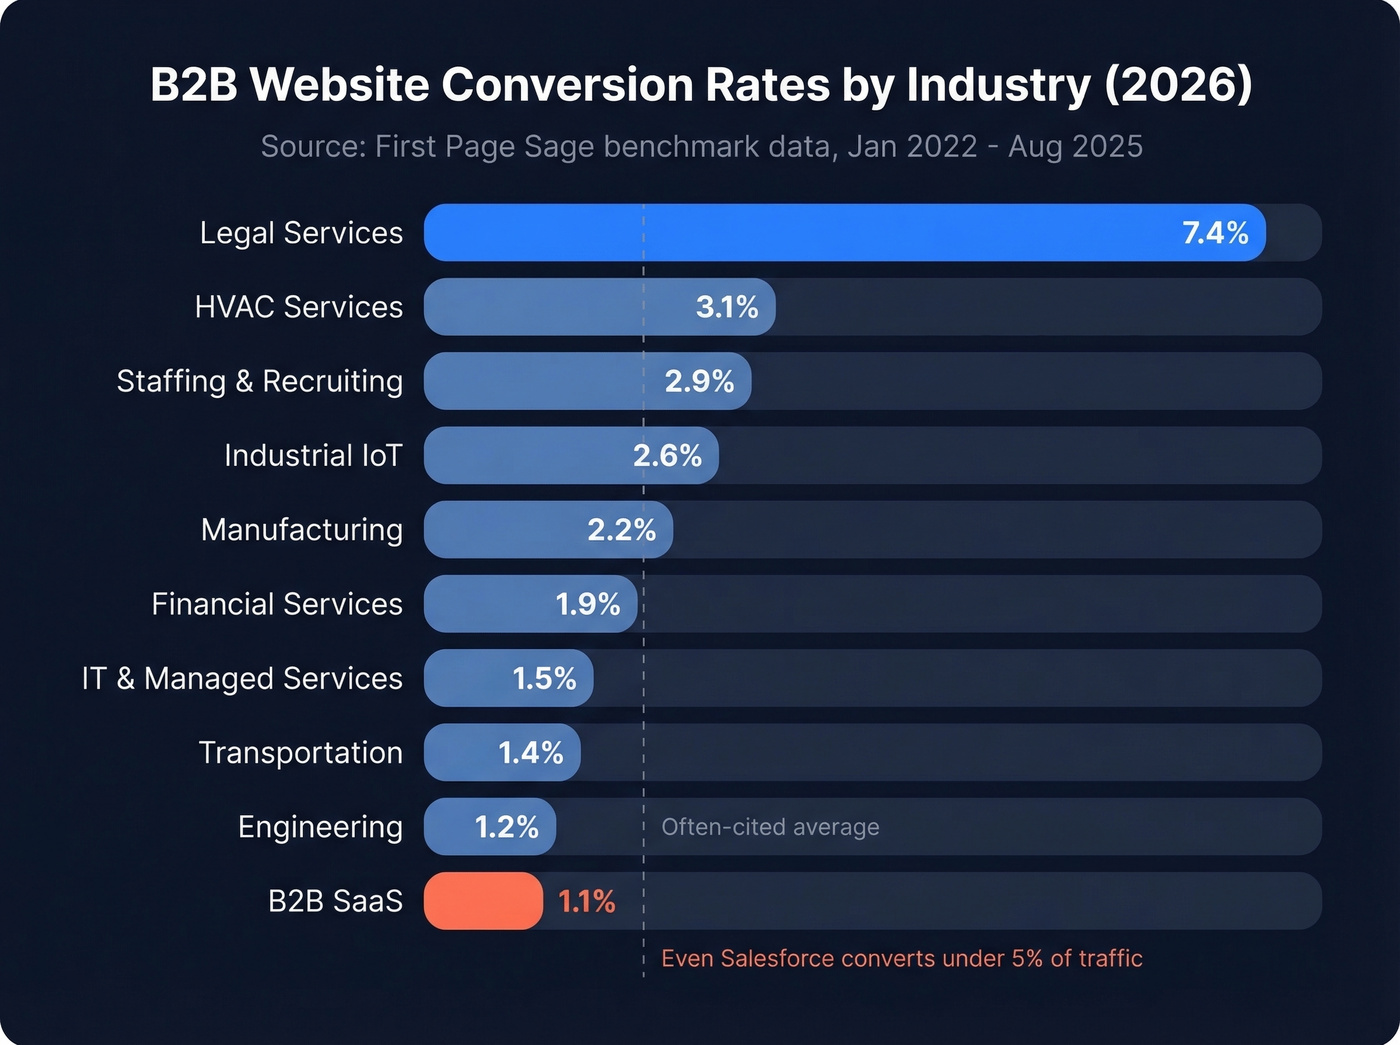
Generic benchmarks are useless. "The average B2B conversion rate is 2-3%" tells you nothing when legal services convert at 7.4% and B2B SaaS sits at 1.1%. Here's what the data actually shows, drawn from First Page Sage's 2026 benchmark report covering client data from Jan 2022 through Aug 2025:
| Industry | Website CVR |
|---|---|
| Legal Services | 7.4% |
| HVAC Services | 3.1% |
| Staffing & Recruiting | 2.9% |
| Industrial IoT | 2.6% |
| Manufacturing | 2.2% |
| Financial Services | 1.9% |
| IT & Managed Services | 1.5% |
| Transportation | 1.4% |
| Engineering | 1.2% |
| B2B SaaS | 1.1% |
Even Salesforce converts less than 5% of its traffic into qualified leads. If the biggest name in CRM can't crack that ceiling, stop beating yourself up over a 1.5% site-wide rate.
These are website-wide rates. Landing pages convert significantly higher - Unbounce's benchmark dataset of 41,000+ landing pages and 464M unique visitors shows a median conversion rate of 6.6% across industries. If your landing pages are converting below your website average, something's structurally wrong.
Channel matters too. Per consolidated benchmark data from The Digital Bloom, visitor-to-lead rates vary widely: SEO delivers 2.1%, webinars 2.2%, email 1.8%, events 1.0%, and PPC just 0.7%. But the downstream story is more telling - SEO leads convert to SQL at 51%, nearly double PPC's 26%. If you're pouring budget into paid search and wondering why pipeline is thin, that's the baseline you're working against.
Where Your Funnel Is Actually Leaking
Website conversion rate is the metric everyone obsesses over. The real revenue impact sits deeper.
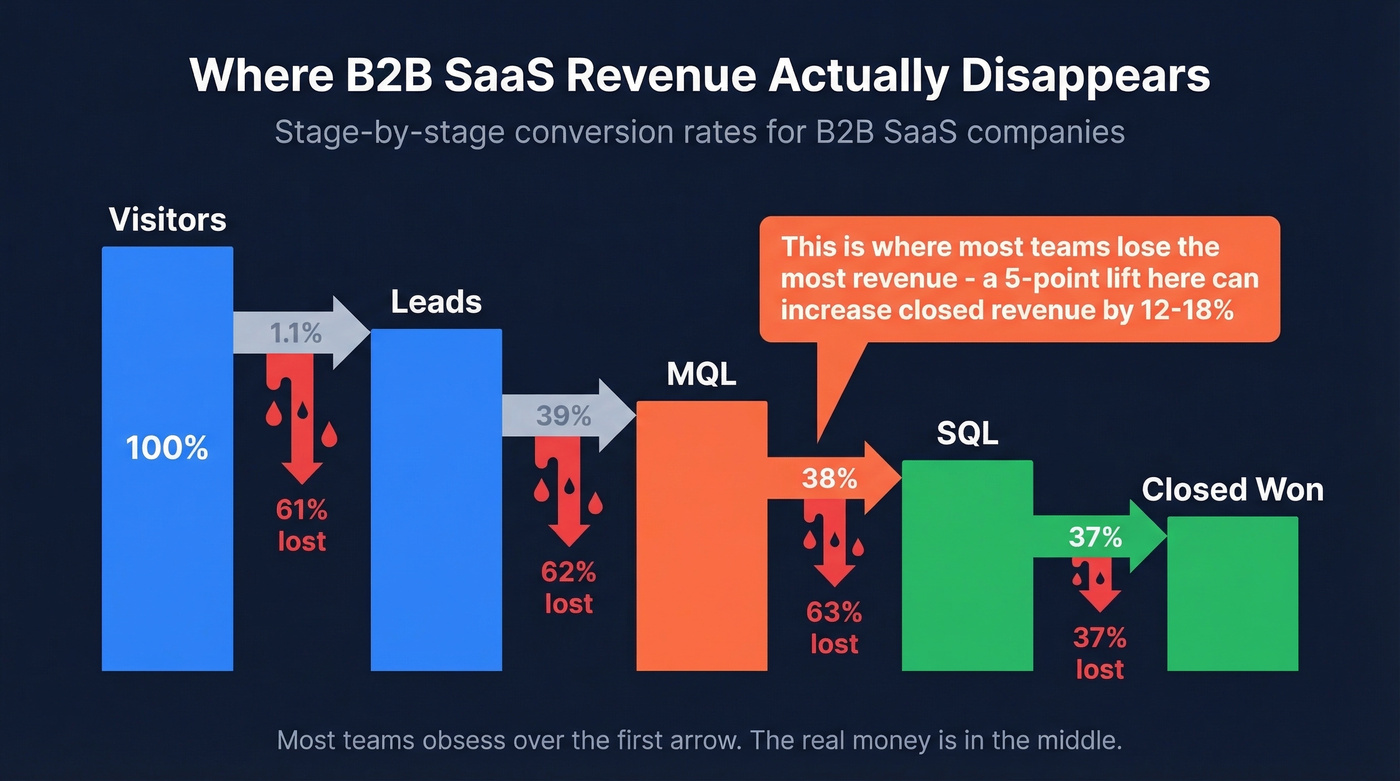
A thorough funnel conversion analysis often reveals that a 5-point lift in any mid-funnel stage can increase total closed revenue by 12-18%. Here's where the stage-by-stage numbers land:
| Stage | B2B SaaS | Manufacturing | Fintech | IT Services |
|---|---|---|---|---|
| Lead to MQL | 39% | 26% | 21% | 19% |
| MQL to SQL | 38% | 41% | 46% | 38% |
| SQL to Opp | 42% | 46% | 49% | 41% |
| SQL to Close | 37% | 51% | 58% | 46% |
Company size changes the math. SMB and mid-market companies (under $100M ARR) convert visitors to leads at 1.4%. Enterprise companies ($1B+ ARR) convert at just 0.7% - half the rate. Enterprise also sees steeper drop-offs at every subsequent stage: Lead-to-MQL drops from 41% (SMB) to 39% (enterprise), and both MQL-to-SQL and Opportunity-to-Close show the same 39%-to-31% drop between SMB and enterprise segments. That's not a typo, just a consistent pattern of enterprise friction compounding at every stage.
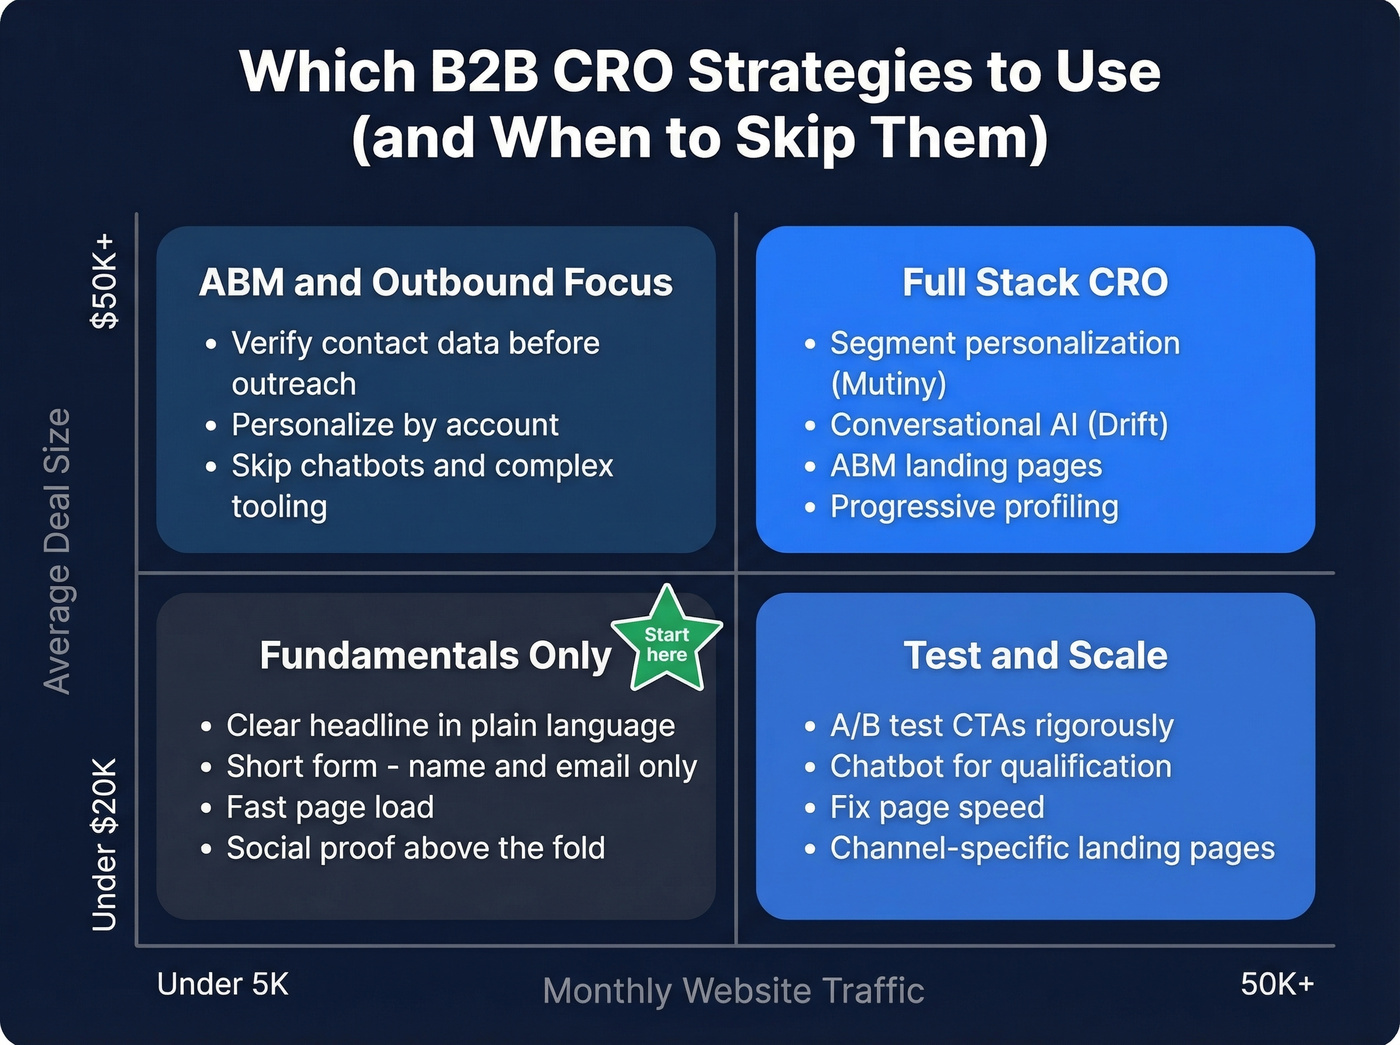
Let's be honest: if your average deal is under $15K, you probably don't need enterprise-grade CRO tooling. A clear headline, a short form, and verified contact data will outperform a $50K personalization platform every time. Save the complex optimization stack for deals where a single conversion is worth six figures.
If you're only optimizing your website's top-of-funnel conversion rate, you're ignoring the stages where the most revenue leaks out. Improving the MQL-to-SQL handoff alone can move pipeline more than doubling your site traffic.
You just read it: improving the MQL-to-SQL handoff moves pipeline more than doubling traffic. But that handoff breaks when 35% of your emails bounce. Prospeo delivers 98% email accuracy with a 7-day refresh cycle - so every lead that enters your CRM is reachable.
Stop optimizing pages when your contact data is the real conversion killer.
Diagnose Before You Optimize
Before you touch anything, figure out what's actually broken. We've seen teams spend months A/B testing hero images when the real problem was a 4-second page load time. One agency shared a scenario where a client was spending $15,000/month on high-intent ads driving traffic to a landing page converting at 0.3% - the page loaded in 6 seconds on mobile and the headline didn't match the ad copy. No amount of bid optimization fixes that.
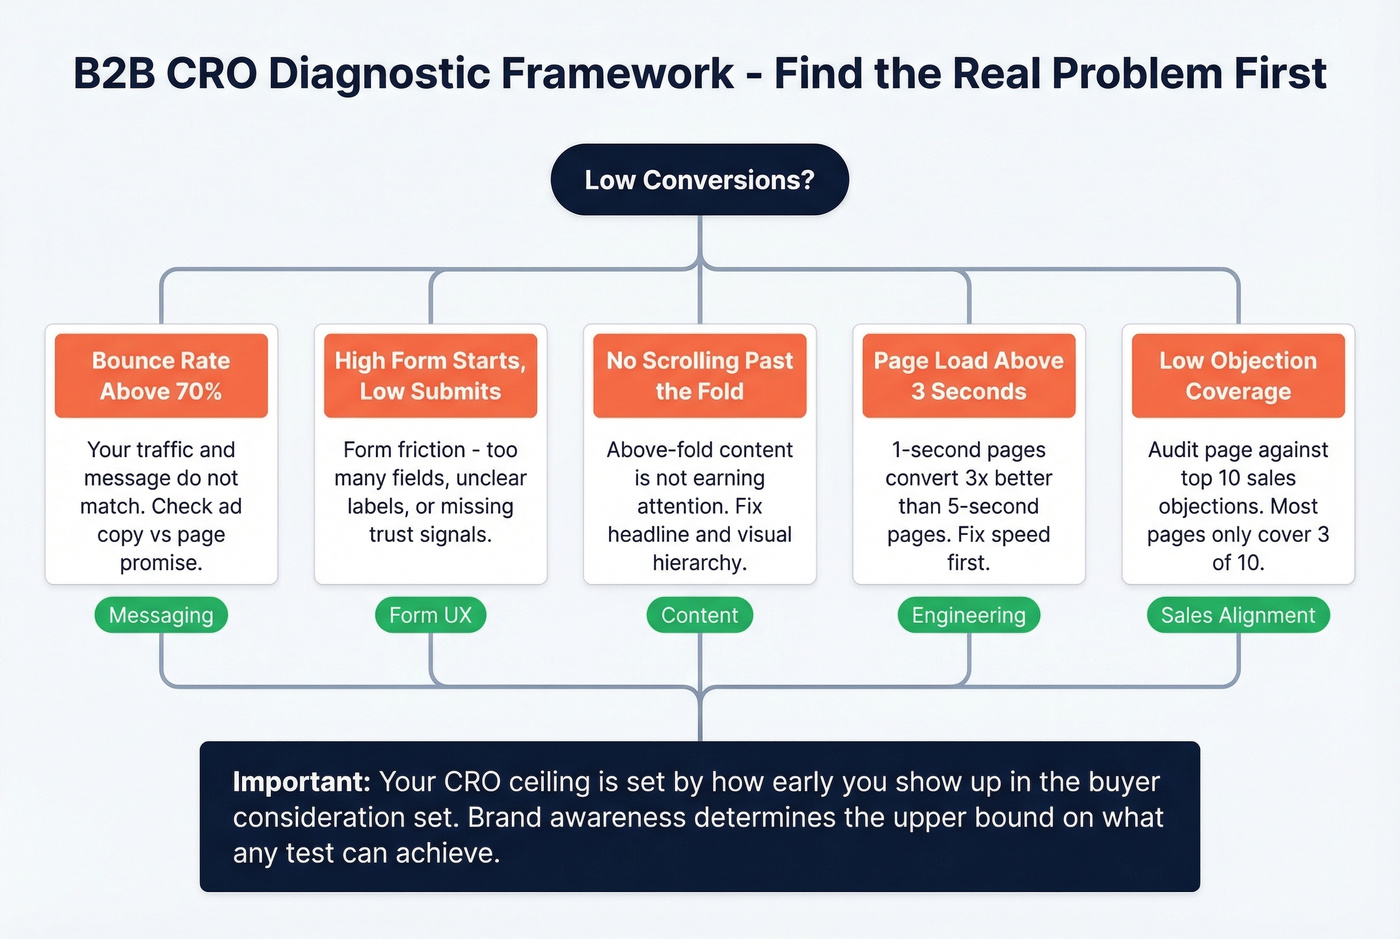
Here's a diagnostic framework that works:
- Bounce rate above 70% on key landing pages means your traffic and your message don't match. Either the ad copy is misleading or the page doesn't deliver on the promise.
- High form starts, low form submits means form friction. Too many fields, unclear labels, or missing trust signals. If 40% start your form and only 10% finish, the form is the problem.
- No scrolling past the fold means your above-fold content isn't earning attention. Headline, subhead, or visual hierarchy needs work.
- Page load time above 3 seconds is a conversion killer. A page loading in 1 second converts at 3x the rate of one loading in 5 seconds, and over 60% of web traffic is mobile, where load times are typically worse.
- Low objection coverage rate is the metric most teams never track, and it's one of the most diagnostic. Audit your page content against the top 10 objections your sales team hears. If your landing page only addresses 3 of 10, you're leaving conversions on the table.
Here's the frustrating part: if the pre-contact favorite wins roughly 80% of deals, and 92% of buyers already have a vendor in mind before they start evaluating, page-level tweaks have a hard ceiling. Your CRO ceiling is set by how early you show up in the buyer's consideration set. Conversion optimization matters, but brand awareness and early-stage trust-building determine the upper bound on what any test can achieve.
Strategies That Move Pipeline
Rewrite Headlines in Plain Language
The consensus on r/SaaS is clear: clarity beats cleverness every time. If a visitor can't understand what you do within five seconds, no design polish will save the page. "Reduce invoice processing from 3 days to 3 minutes" beats "AI-Powered AP Automation Platform" every time. Skip this if your bounce rate is low and form starts are high - your headline is working and the problem is downstream.
Move Social Proof Above the Fold
In our experience, moving logos above the fold is the single easiest win on most B2B sites. Most companies bury social proof below three screens of feature descriptions. Don't make visitors scroll to find out that real companies trust you - that's the first thing they want to know. Skip this if you're pre-product-market-fit with no recognizable customers yet; a strong value prop matters more at that stage.
Simplify Your Forms
If your form-start-to-submit ratio is below 30%, you have a friction problem. For top-of-funnel offers, name and email should be enough. Save the 12-field qualification form for demo requests where the lead is already committed. Use progressive profiling or lead scoring to gather additional data points over time rather than front-loading the ask.
Fix Page Speed First
A page loading in 1 second converts at 3x the rate of one loading in 5 seconds. Run your key pages through PageSpeed Insights before you touch copy or design. This is the highest-ROI fix most teams skip because it requires engineering time, not marketing creativity. Skip this if your pages already load under 2 seconds - diminishing returns kick in fast.
Replace Forms With Conversational AI
This is the biggest shift in B2B CRO right now. AI chatbots that qualify visitors through natural conversation consistently outperform static forms - they feel less like a commitment and more like getting help. Tools like Drift and Qualified let you route high-intent visitors directly to sales while capturing the same data a form would.
As one founder on r/BootstrappedSaaS put it: most B2B sites don't have a traffic problem - they have a "nobody understands what we do" problem. A chatbot that asks "What are you trying to solve?" gets to the answer faster than any form. Skip this if your monthly traffic is under 5,000. The implementation cost won't justify the lift at that volume.
Personalize by Segment
For enterprise and ABM motions, generic pages underperform. Tools like Mutiny ($20K+/year) let you serve different headlines, CTAs, and case studies based on the visitor's company, industry, or buyer intent signals. Skip this if your average deal size is under $20K - the tool cost won't justify the lift.
Test Your CTAs Rigorously
Small copy changes produce outsized results. In one well-documented case, the travel company Going tested "Sign up for free" against "Trial for free" and saw a 104% increase in premium trial starts. The lesson isn't to copy their exact words - it's that CTA language is worth testing, even when the change seems trivial. Rigorous CTA testing compounds across every page and every traffic source.
Fix Your Data Quality
This is the CRO lever nobody talks about. You double your form conversions, celebrate the win, and then discover that 30% of those emails bounce and your SDRs are chasing dead addresses. Pipeline impact ends up a fraction of what it should be.

Testing With Low Traffic
Most B2B sites get 5,000-20,000 monthly visits. That's a problem for traditional A/B testing, which needs roughly 13,000 visitors per variation to reach statistical significance. At 10,000 visits per month, a single test takes over three months.
One concept worth understanding: Minimum Detectable Effect (MDE). It's the smallest improvement your test can reliably detect. With a 5% baseline conversion rate and 10,000 visitors, you'd need an MDE of at least 2 percentage points - meaning you can only detect changes from 5% to 7%+. Anything subtler gets lost in the noise.
Sequential testing, like Optimizely's Stats Engine, offers a practical alternative. Instead of requiring a pre-set sample size, it continuously evaluates results with false discovery rate controls, letting you read results earlier without inflating your error rate.
But for many B2B sites, even sequential testing is slow. Practical alternatives: session recordings (watch 50 sessions and you'll spot patterns), five-second tests (show your page to someone for five seconds and ask what it does), user interviews with recent buyers, and simple before/after measurement with a 2-4 week baseline. We've found that watching 30 session recordings often reveals more actionable insights than a month-long A/B test. When traffic is limited, qualitative methods are the fastest way to identify exactly where prospects drop off.
If you need a repeatable way to operationalize this, build it into your lead generation workflow so insights turn into fixes.
CRO Tool Stack
You don't need ten tools. Start with analytics, add behavior tracking, then layer in testing when your traffic justifies it.
| Tool | Category | Starting Price | Best For |
|---|---|---|---|
| GA4 | Analytics | Free | Baseline metrics |
| Microsoft Clarity | Heatmaps/replay | Free | Budget teams |
| Prospeo | Data quality | Free tier; ~$0.01/email | Lead verification |
| Hotjar | Heatmaps/replay | ~$32-99/mo | UX diagnostics |
| Crazy Egg | Heatmaps/A/B | $29/mo | Simple tests |
| VWO | A/B testing | ~$99-199+/mo | Mid-market testing |
| Optimizely | A/B testing | $1,000+/mo | Enterprise |
| Mutiny | Personalization | $20K+/yr | ABM / enterprise |
| Unbounce | Landing pages | ~$99-200/mo | Campaign pages |
Start with GA4 + Clarity + one testing platform. That covers 90% of what you need. Then layer in data verification so the leads your optimized pages generate are actually reachable - a 98% email accuracy rate and 7-day refresh cycle mean your attribution data stays clean and your SDRs aren't wasting cycles on dead contacts.
If you're building out the rest of the stack, start with SDR tools and a clean contact management process so handoffs don't break.
Your SQL-to-Opportunity stage stalls when reps can't reach decision-makers. Prospeo gives you 125M+ verified mobile numbers with a 30% pickup rate and 143M+ verified emails - at $0.01 per lead. That's the fastest CRO fix you'll never find in an A/B test.
Direct dials convert better than any landing page redesign ever will.
FAQ
What's a good B2B conversion rate?
It depends entirely on your industry. B2B SaaS averages 1.1%, manufacturing 2.2%, and legal services leads at 7.4% per First Page Sage's 2026 benchmarks. Landing pages convert higher, with a median of 6.6%. Compare against your vertical, not generic "2-3%" numbers.
How long does B2B CRO take to show results?
Quick wins like headline rewrites and form simplification show impact in 2-4 weeks. Structured testing programs need 2-3 months minimum, especially with low traffic. Full-funnel optimization is ongoing - the average B2B buying cycle runs 10.1 months, so pipeline-level results take time to materialize.
What's the difference between B2B and B2C CRO?
B2B involves longer sales cycles (10+ months), buying committees instead of individual buyers, and significantly lower traffic volumes. B2C optimizes for immediate purchase; B2B optimizes for lead quality and pipeline progression. Most B2B "conversions" are demo requests or content downloads, not transactions.
Why don't my conversion gains show up in pipeline?
Almost always a data quality problem. You optimize the page, more people fill out the form, and then 30% of those emails bounce. Verify emails before they hit your CRM so your sales team only works contacts who are actually reachable.
How do I prioritize which funnel stage to optimize first?
Run a funnel conversion analysis to find your weakest stage - for most B2B companies, that's MQL-to-SQL or SQL-to-Opportunity, not top-of-funnel. A 5-point lift at any mid-funnel stage can increase closed revenue by 12-18%. Fix the biggest leak first, then work your way up or down the funnel.