The B2B Marketing Plan Template With Numbers You Can Actually Use
Your CEO asked for "the marketing plan" last Tuesday. You opened a blank doc, found 40 templates, and every single one was filler - placeholder text, vague objectives, zero actual numbers. Meanwhile, 55% of B2B firms delayed or canceled projects in 2024 because of economic uncertainty. Finding a B2B marketing plan template isn't the hard part. Knowing what numbers to put in the boxes is.
Every section below includes benchmark conversion rates, budget ranges, and funnel math you can paste directly into your plan. No form to fill out, no 14-page Word doc to customize.
What Your Plan Needs
Your plan needs 10 sections, not 30. We walk through each one below with benchmark numbers you can use as starting defaults. Start with pipeline math, not tactics - if you don't know how many leads you need to hit revenue targets, your channel strategy is guesswork.
For format: Google Sheets wins for most teams (tabs for personas, goals, campaign planner, performance tracker). Notion works well for one-page executive views. Google Slides if you're presenting to the board. Skip the Word doc. It's static, nobody collaborates in it, and it'll be outdated by February.
Plan vs. Strategy vs. GTM
These three terms get used interchangeably, and it causes real confusion when stakeholders expect different deliverables.
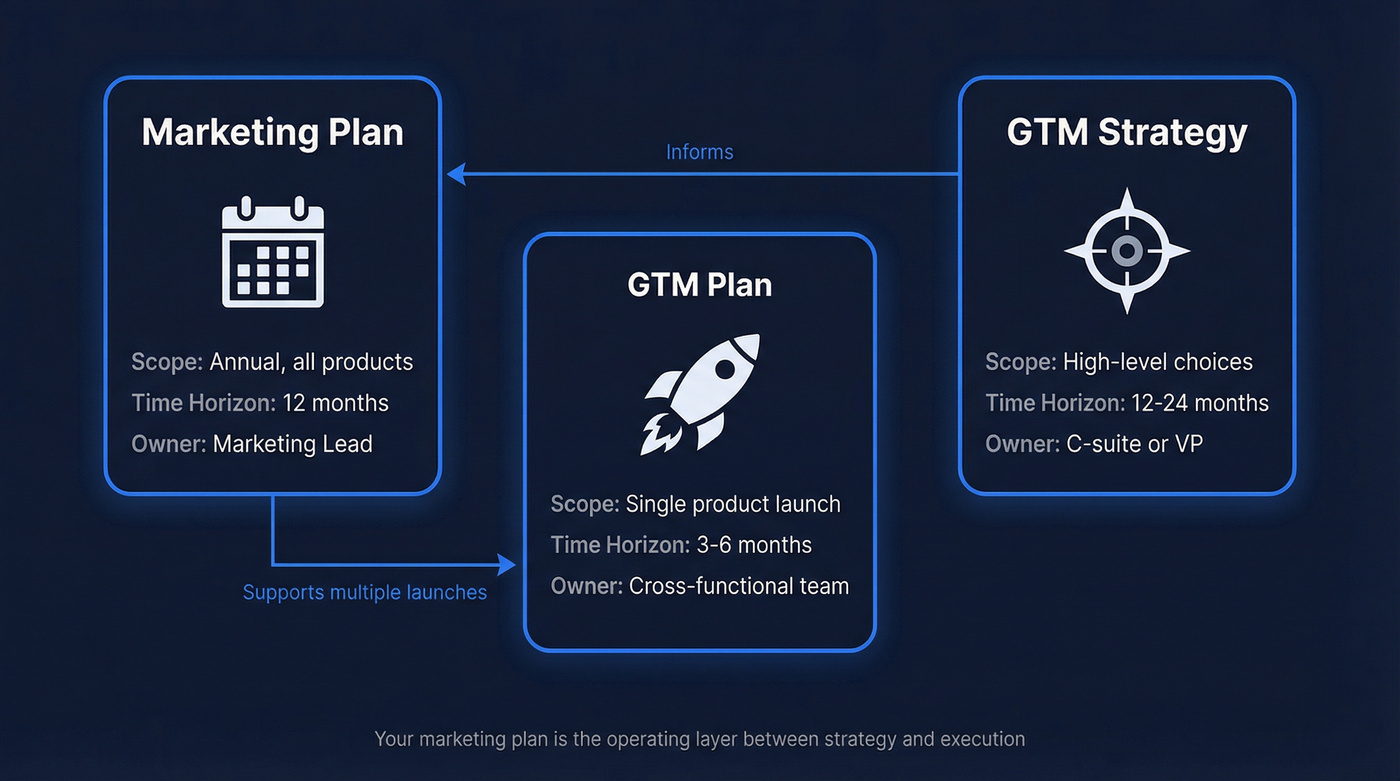
| Document | Scope | Time Horizon | Owner |
|---|---|---|---|
| Marketing plan | Annual, all products | 12 months | Marketing lead |
| GTM plan | Single launch | 3-6 months | Cross-functional |
| GTM strategy | High-level choices | 12-24 months | C-suite / VP |
A marketing plan is the annual operating document covering campaigns, channels, content, and budget across your entire product portfolio. A GTM plan is a time-bound execution blueprint for a specific product launch - dates, owners, budgets, success metrics. Your marketing plan supports multiple GTM plans throughout the year. The GTM strategy sits above both: it's the 12-24 month set of choices about segments, positioning, and business model.
Mistakes That Kill B2B Plans
A Forrester analyst catalogued seven planning pitfalls that show up in B2B orgs every year. Here's each one with a fix.
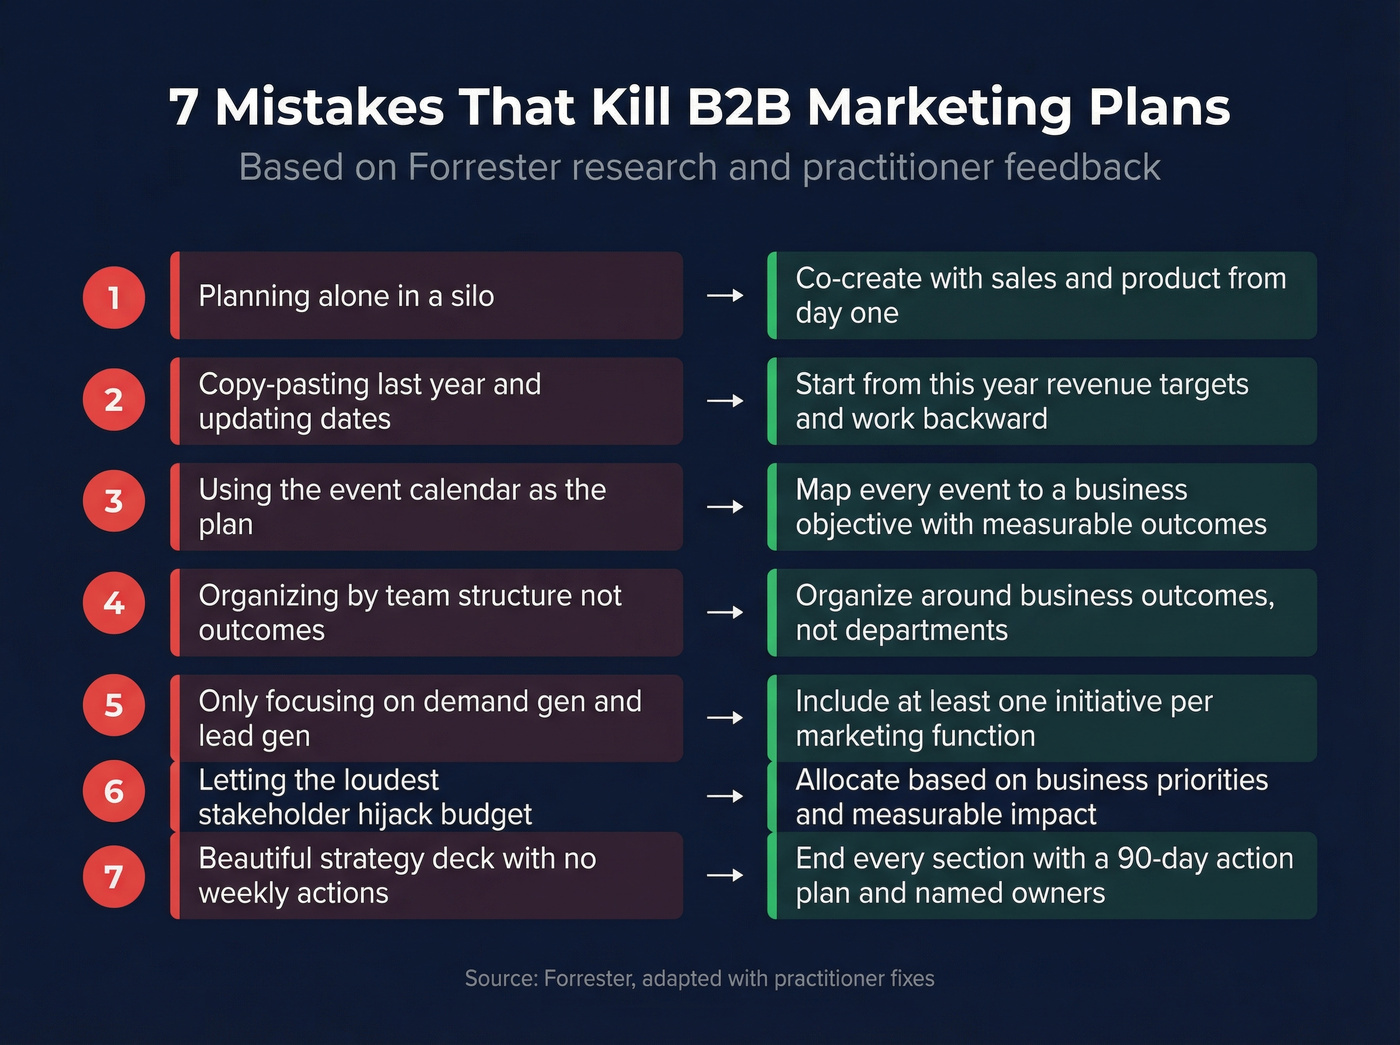
1. Planning alone. Marketing builds the plan in a silo, then wonders why sales ignores it. Fix: co-create with sales and product from day one.
2. Dusting off last year's plan. Copy-pasting last year's doc and updating the dates is how you end up with a plan that doesn't reflect current business objectives. Fix: start from this year's revenue targets and work backward.
3. Using the event calendar as the plan. Conferences and webinars aren't a strategy. Fix: map every event to a business objective with a measurable outcome.
4. Mirroring org structure. Planning by team discipline (content team does X, demand gen does Y) creates disconnected tactics nobody can measure. Fix: organize the plan around business outcomes, not departments.
5. Myopia on demand. Marketing value spans reputation, demand, customer engagement, sales enablement, and ops. If your plan only covers lead gen, you're underinvesting in the functions that compound over time. Fix: include at least one initiative per marketing function.
6. Giving in to the loudest business unit. The richest internal stakeholder can hijack the plan and starve long-term growth bets. Fix: allocate budget based on business priorities and measurable impact, not internal politics.
7. No action translation. A beautiful strategy deck that doesn't translate into weekly activities is just a PDF nobody opens after January. Fix: end every section with a 90-day action plan and named owners.
The consensus on r/marketing mirrors this. A common complaint about B2B marketing templates is that they feel too generic - "not right" for corporate-style planning, as one marketing consultant put it. The templates exist, but they're missing the numbers that make them usable.
Your ICP and personas are only useful if you can actually reach those buyers. Prospeo's 30+ search filters - including buyer intent, technographics, headcount growth, and funding - let you build targeted lists that match your marketing plan's exact segments. 98% email accuracy means your campaigns hit real inboxes, not bounce logs.
Stop planning campaigns against contacts you can't reach.
Template Sections With Benchmarks
This is the core of the plan. Each subsection maps to a section in your actual document. We've filled in benchmark numbers so you're not starting from zero.
Executive Summary & Objectives
Before setting targets, audit last year's actuals. If you don't know your current conversion rates, the benchmarks below are your starting point - but replace them with real data within 90 days.
Keep this section to half a page. State the company's revenue target, marketing's pipeline contribution goal, and 2-3 SMART objectives. Example: "Increase marketing-sourced pipeline from $2.4M to $2.9M per quarter by Q3 2026 (20% increase), measured by CRM-attributed pipeline." Every objective needs a number, a deadline, and a measurement method. If it doesn't have all three, it's a wish, not a goal.
ICP, Personas & Buying Committee
Your ICP defines the company profile you're targeting. Your buyer personas define the individuals within those companies. These aren't the same thing - your ICP might be "Series B SaaS companies, 50-200 employees, selling to enterprise" while your personas are the VP of Sales, the RevOps lead, and the CFO who signs the check.
Map the full buying committee, not just the obvious decision-maker. Finance and legal are hidden influencers that kill deals late in the funnel if you haven't addressed their concerns in your content and messaging. Document their objections and the content that neutralizes each one.
Channel Strategy With Benchmarks
Pick 2-3 channels and go deep. In our experience, SEO tends to produce the highest MQL-to-SQL conversion rates, with email close behind - meaning the leads they generate are more likely to become real opportunities.
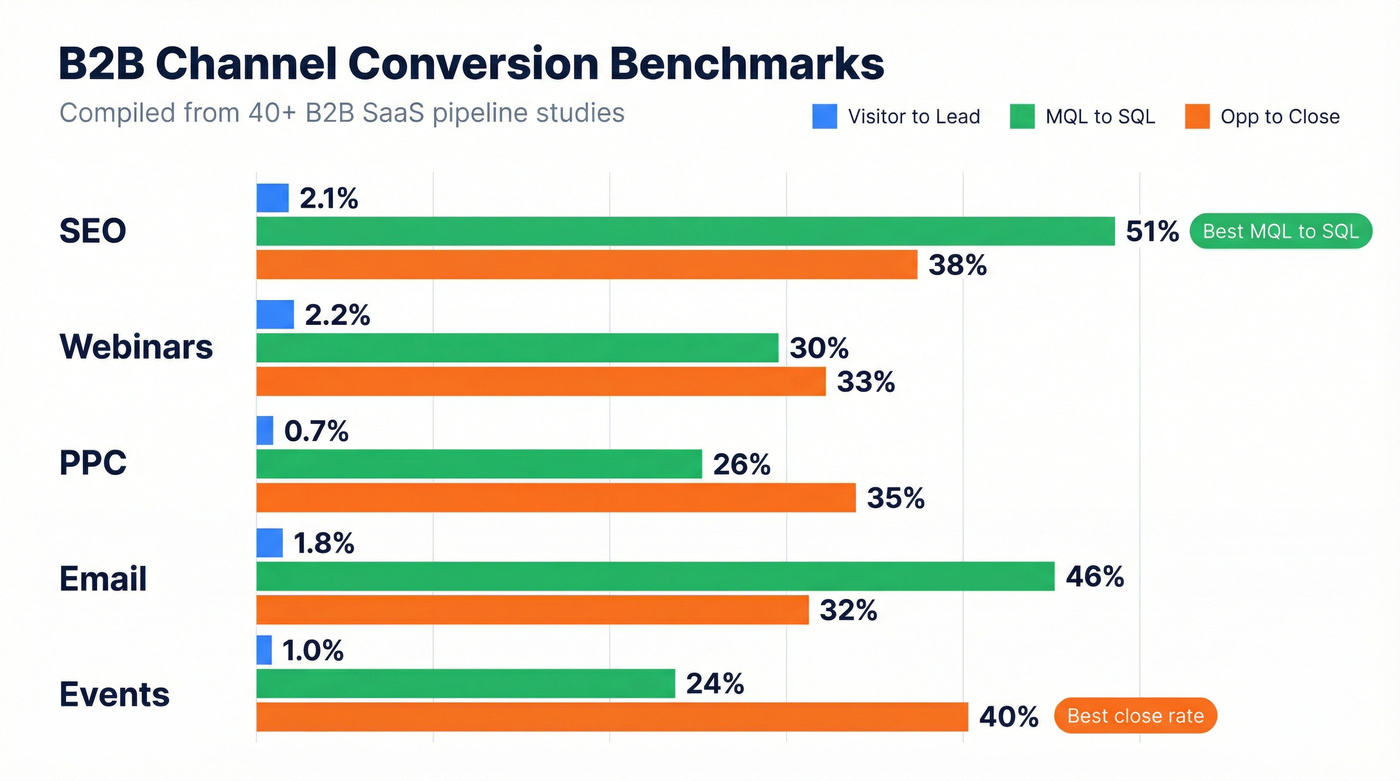
| Channel | Visitor-to-Lead | MQL-to-SQL | Opp-to-Close |
|---|---|---|---|
| SEO | 2.1% | 51% | 38% |
| Webinars | 2.2% | 30% | 33% |
| PPC | 0.7% | 26% | 35% |
| 1.8% | 46% | 32% | |
| Events | 1.0% | 24% | 40% |
Source: compiled B2B SaaS pipeline benchmarks across 40+ studies.
Events have the highest opportunity-to-close rate (40%), but the lowest top-of-funnel conversion. SEO has the best MQL-to-SQL rate (51%), making it the most efficient channel for generating qualified pipeline. Use these as starting defaults and adjust quarterly based on your own data.
Budget - 2026 Allocation
52.3% of B2B firms increased marketing budgets heading into 2025, with a median increase of 5%. But 29% are being asked to generate more pipeline without additional budget. If that's you, the allocation matters more than the total.
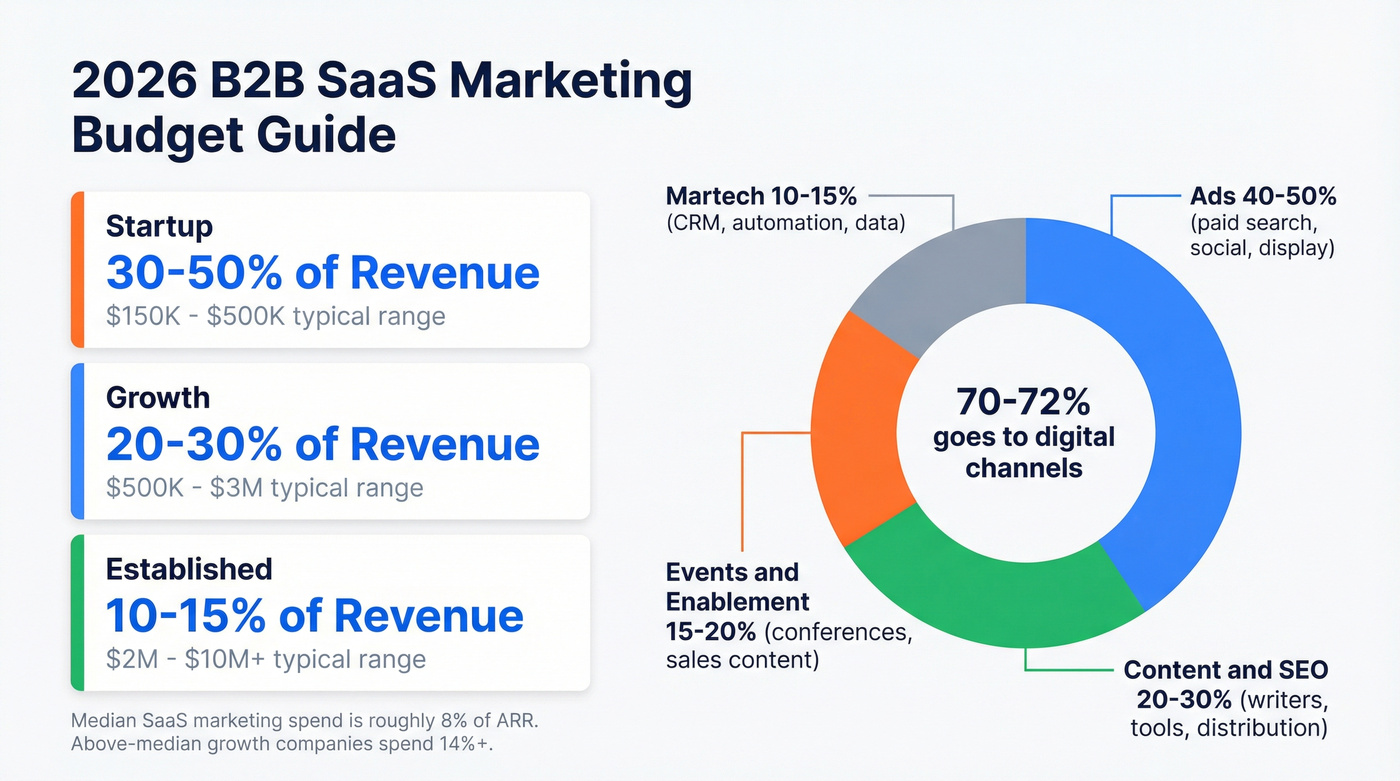
Median SaaS marketing spend runs ~8% of ARR. Digital channels account for 70-72% of total spend, so plan your offline/online split accordingly.
| Stage | % of Revenue | Typical Range |
|---|---|---|
| Startup | 30-50% | $150K-$500K |
| Growth | 20-30% | $500K-$3M |
| Established | 10-15% | $2M-$10M+ |
For channel allocation, here's the split we've seen work for most B2B teams:
| Category | % Allocation | Covers |
|---|---|---|
| Ads | 40-50% | Paid search, social, display |
| Content/SEO | 20-30% | Writers, tools, distribution |
| Events/Enablement | 15-20% | Conferences, sales content |
| Martech | 10-15% | CRM, automation, data |
Above-median growth SaaS companies allocate 14%+ of revenue to marketing. In mature SaaS businesses, retention budgets deliver 3-5x better ROI than acquisition - which is why the Expansion stage in ABM frameworks (covered below) deserves real budget allocation, not leftover dollars.
KPIs & Pipeline Math
This is where most templates fall apart. They list "increase leads" as a KPI without defining what a lead is or how many you need. Here are actual funnel metrics to plan around:
| Funnel Stage | SMB/Mid-Market | Enterprise |
|---|---|---|
| Visitor-to-Lead | 1.4% | 0.7% |
| Lead-to-MQL | 41% | 30-35% |
| MQL-to-SQL | 39% | 31% |
| SQL-to-Opportunity | 42% | 36% |
| Opp-to-Close | 39% | 31% |
Enterprise Lead-to-MQL sits lower because of longer qualification cycles; 30-35% is a reasonable planning range.
Overall lead-to-customer conversion runs 2-5%. Median sales cycle is 84 days (optimal is 46-75). Win rates typically land at 20-30%, with a median deal size of $26,265 for private SaaS.
Work backward from your revenue target. If you need $3M in new ARR at a $25K average deal size, that's 120 closed deals. At a 25% win rate, you need 480 opportunities. At a 40% SQL-to-Opp rate, you need 1,200 SQLs. Now you know exactly how many leads each channel needs to generate.
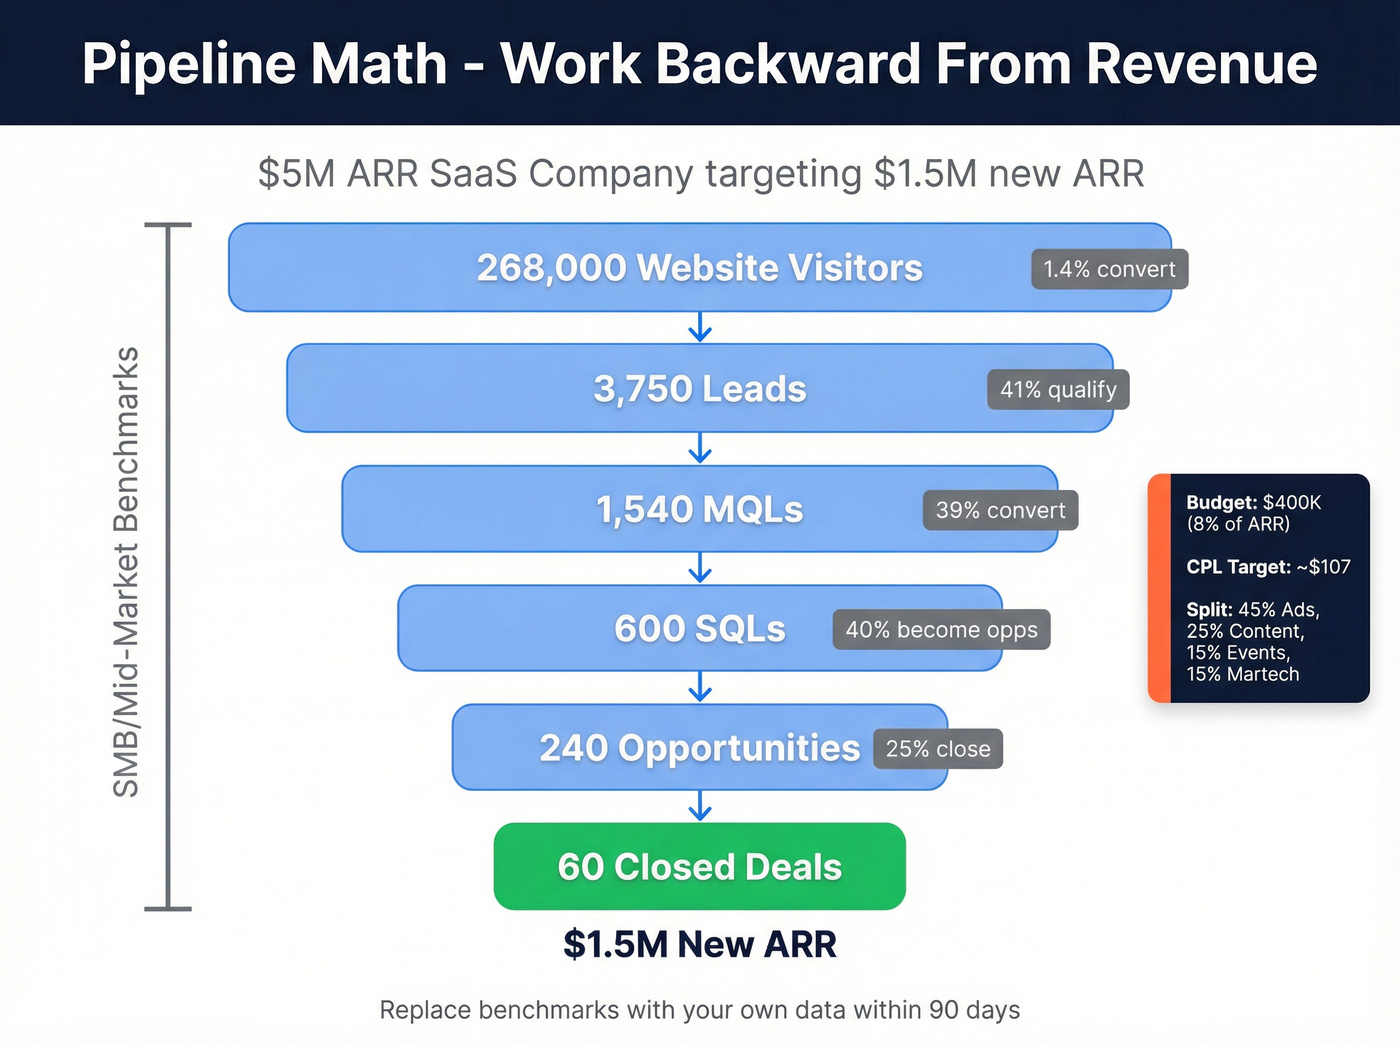
Worked Example: $5M ARR SaaS Company
Target: $1.5M in new ARR. Average deal size: $25K. That's 60 closed deals.
At a 25% win rate, you need 240 opportunities. At a 40% SQL-to-Opp rate, that's 600 SQLs. At a 39% MQL-to-SQL rate, roughly 1,540 MQLs. At a 41% Lead-to-MQL rate, about 3,750 leads. At a 1.4% visitor-to-lead rate, around 268,000 website visitors.
Marketing budget at 8% of ARR = $400K. Channel split: $180K ads (45%), $100K content/SEO (25%), $60K events (15%), $60K martech and data (15%). That $400K needs to generate 3,750 leads - a cost per lead of ~$107. If your CPL is running above $150, you're either targeting too broadly or leaning too heavily on paid channels. Shift budget toward SEO and email, which convert at roughly 2x the rate of PPC at the MQL-to-SQL stage.
Dependencies, Risks & Martech
This section is the one everyone skips and then regrets in Q2. Document your assumptions: product launch dates that marketing plans depend on, sales team headcount that affects follow-up capacity, infrastructure investments that need to land before campaigns can run.
Your martech stack should cover four categories: CRM (Salesforce or HubSpot for pipeline tracking and attribution), marketing automation (Marketo, HubSpot, or Pardot for nurture sequences and scoring), analytics (GA4 or Mixpanel for behavioral data and conversion tracking), and data/prospecting (your contact database, data enrichment tools, and verification layer).
Here's the thing about outbound: your channel plan is only as good as your contact data. If your bounce rate is above 5%, the problem isn't your copy or your sequences - it's your data source. We've seen teams cut bounce rates from 35% to under 4% just by switching to a provider with a weekly refresh cycle instead of the industry-standard six weeks. That difference compounds fast when you're sending thousands of emails per month.
90-Day Action Plan
Don't try to execute the entire annual plan at once. Use the 80/20 model: 80% of resources go to regular marketing operations (content production, ad management, newsletter, pipeline reviews, reporting). The remaining 20% goes to time-boxed experiments treated as 90-day sprints.
Each sprint gets a maximum of 5-7 key activities, a named owner, a budget, and leading indicators you'll check at 30 and 60 days. If an experiment works, operationalize it into the 80%. If it doesn't, cut it and run the next one. This prevents the "random acts of marketing" problem that kills most plans by Q2.
You just mapped your channel benchmarks and budget allocation. Now you need the pipeline math to actually work. Teams using Prospeo book 35% more meetings than Apollo users, with bounce rates under 4%. At $0.01 per email, your cost-per-lead stays inside even the tightest marketing budget.
Turn your funnel math from a spreadsheet exercise into real revenue.
The One-Page Plan Option
Your CEO doesn't need 10 pages. They need one page that shows strategies, KPIs, budget, and timeline. Forrester calls this the "plan on a page" - it communicates up to the C-suite and cascades down into campaign-level plans for the team.
Two frameworks work well here. EOS, the system from Traction, gives you a structured one-page format with rocks, goals, and accountability. OGSM - Objective, Goals, Strategies, Measures - is more common in enterprise orgs and maps cleanly to board-level reporting. Maintain two artifacts: the one-page version for executives and quarterly reviews, and the full plan for the marketing team's daily execution. They should reference the same numbers.
Choosing the Right Format
| Format | Best For | Collaboration | Limitation |
|---|---|---|---|
| Google Sheets | Day-to-day ops | Excellent (real-time) | Not presentation-ready |
| Notion | One-page GTM views | Good (async) | Learning curve |
| Google Slides | Board presentations | Good (commenting) | Hard to update often |
| Word/PDF | - | Poor (version hell) | Static, no collaboration |
Google Sheets wins for most teams. The best practitioner-shared B2B marketing templates on Reddit use tabs for persona creation, goal tracking, campaign planning, content calendars, and performance dashboards - all in one workbook. Notion is gaining traction for one-page GTM boards, and the Marketing Goals and OKRs template carries a 4.7/5 rating from 100+ users.
Let's be honest: the format matters less than the discipline of updating it. A Google Sheet you review weekly beats a beautiful Notion board nobody opens after launch.
ABM Alternative - Acquisition, Acceleration, Expansion
If your team runs account-based marketing, the standard template structure doesn't quite fit. IMPACT's ABM framework organizes planning into three stages instead.
Acquisition covers net-new accounts entering the pipeline - your ICP targeting, outbound plays, and top-of-funnel campaigns. Acceleration focuses on engaged accounts already in the pipeline - the content, events, and touchpoints that keep deals moving or revive stalled ones. Expansion handles retention, upsell, and cross-sell within existing customers.
Use this structure when your average deal size is above $50K and your buying committee has 5+ stakeholders. Here's our hot take: most B2B teams default to the standard template when they should be using ABM. If your ACV clears $30K and you're still optimizing for lead volume instead of account penetration, you're spending more to close less. The standard template works better for velocity-driven models where you're optimizing for volume across channels rather than orchestrating account-level plays.
Skip the ABM framework if you're selling sub-$10K deals with a single decision-maker. You'll over-engineer the process and slow down a motion that should be fast.
FAQ
How long should a B2B marketing plan be?
One page for executive communication, 5-10 pages for the working document. The plan-on-a-page covers strategies, KPIs, and budget at a glance. The full version adds channel details, conversion benchmarks, martech decisions, and 90-day action items with named owners.
What's the difference between a marketing plan and a GTM plan?
A marketing plan is annual and covers all products and channels. A GTM plan is a 3-6 month execution blueprint for a specific product launch with dates, owners, and success metrics. Your annual plan supports multiple GTM plans throughout the year.
How much should a B2B company spend on marketing?
Median SaaS spend is ~8% of ARR. Startups typically allocate 30-50% of revenue, growth-stage companies 20-30%, and established companies 10-15%. Above-median growth companies push to 14%+ of revenue - the benchmarks table above breaks this down by stage.
What conversion rates should I use for planning?
For B2B SaaS: lead-to-customer 2-5%, MQL-to-SQL 31-39% depending on company size, win rate 20-30%, median sales cycle 84 days. Use these as starting defaults and replace them with your own pipeline data within 90 days.
How do I keep outbound email deliverability high?
Start with verified contact data - a 5%+ bounce rate means your data source is the problem, not your copy. Tools like Prospeo verify emails before you send with 98% accuracy across 300M+ profiles, and a 7-day refresh cycle means lists built in Q1 stay current through Q2.