B2B Target Market Analysis: Frameworks, Formulas, and Scoring Models That Work
Your SDR team is burning through 10,000 accounts, but only 200 are a real fit. The problem isn't effort - it's targeting. Every guide online gives you definitions and taxonomy for B2B target market analysis. This one gives you the formulas, scoring models, and tiering frameworks you can put into a spreadsheet today.
A PMM on r/ProductMarketing nailed it: "online videos tell theory, not process and templates." 76% of marketers use segmentation in some form, but most can't score their ICP numerically. If your ICP is a paragraph of adjectives, it's not an ICP. Let's fix that.
Seven Steps to Analyze Your Target Market
Seven steps, in order. Each builds on the last.
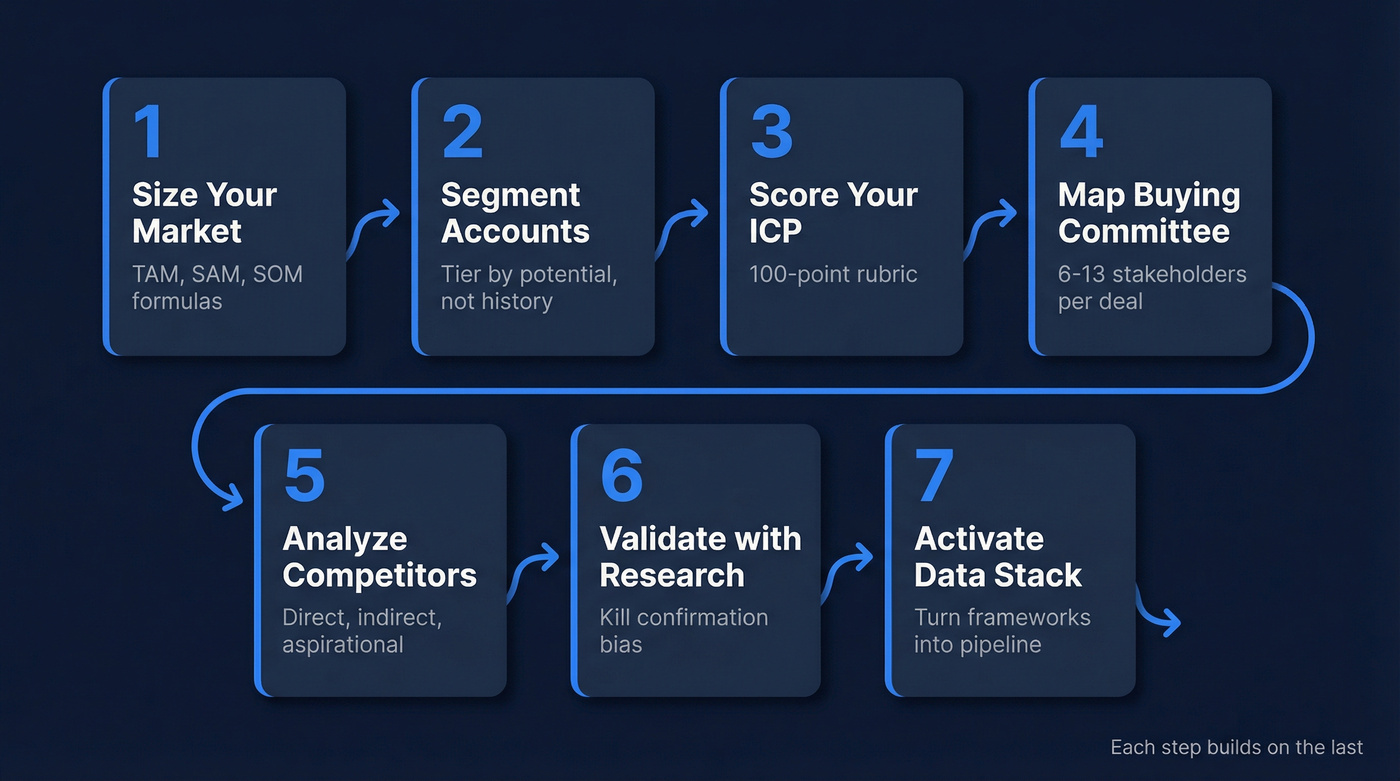
- Size your market - calculate TAM, SAM, and SOM with real formulas
- Segment accounts - group by opportunity size and complexity
- Score your ICP - build a 100-point rubric, not a wish list
- Map the buying committee - identify every stakeholder by role
- Analyze competitors - tier them and benchmark positioning
- Validate with primary research - kill confirmation bias before it kills your strategy
- Activate with a data stack - turn frameworks into pipeline
Teams running advanced segmentation see 2-3x higher conversion rates and 28% better marketing ROI. The rest of this article gives you the math and models for each step.
Size Your Market (TAM / SAM / SOM)
Your CEO asks "what's our TAM?" in a board meeting and you don't have a number. Don't let that happen.
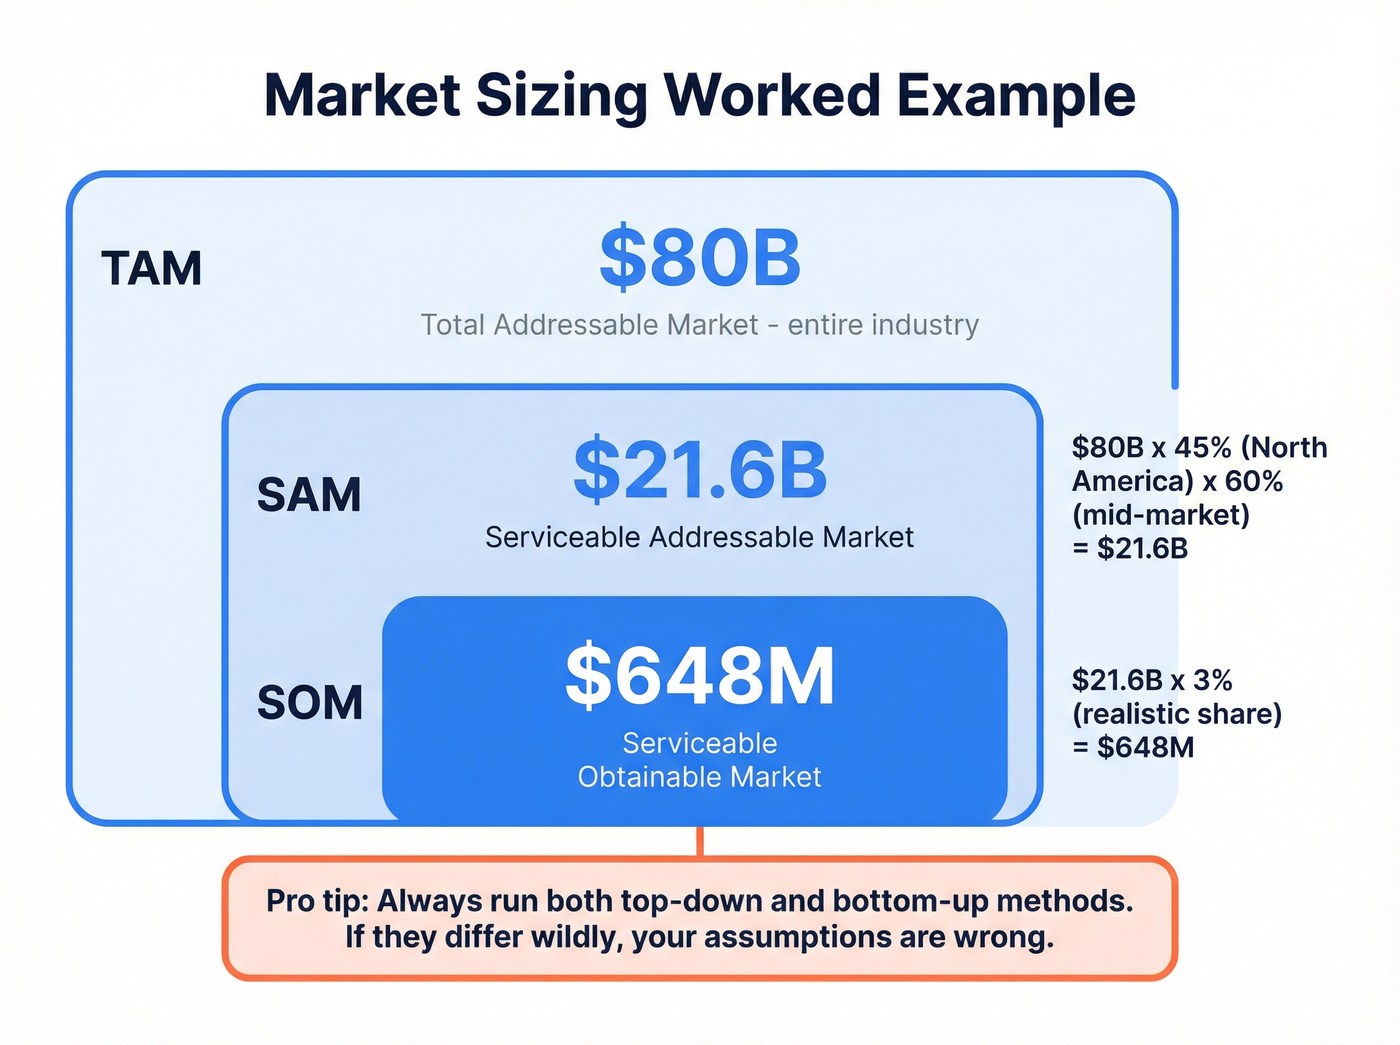
Top-down starts with industry size and narrows by segment percentage - fast but lazy on its own. Bottom-up multiplies your number of potential customers by average contract value, which takes more work but produces more accurate results. Value theory estimates the economic value you deliver, multiplies by willingness-to-pay share, then by customer count. Use at least two methods and compare. If they're wildly different, your assumptions are off.
Here's a worked example for SAM. Say your TAM is $80B. You only serve North America (45% of the market), and your product fits mid-market companies (60% of that slice). SAM = $80B x 45% x 60% = $21.6B. For SOM, apply your realistic market share - say 3%. SOM = $21.6B x 3% = $648M. That's the number your board actually cares about.
Common Sizing Mistakes
Over-relying on top-down analysis without a bottom-up cross-check is the most frequent one we see. Close behind: confusing TAM, SAM, and SOM - they aren't interchangeable, and investors notice. Using market reports from 2023 to model 2026 dynamics doesn't hold up either. And inflating TAM for investors never works - due diligence will catch it.
If you only run one sizing method, you're guessing with extra steps.
Segment and Tier Your Accounts
Segmentation isn't about creating clever labels. It's about allocating finite sales and marketing resources against accounts with different complexity levels and revenue potential. Yet only 52% of B2B companies even use [firmographic segmentation](https://www.contentful.com/guides/segmentation/firmographic/), which means half the market is still spraying and praying.
A proven account tiering model breaks your addressable market into four tiers:
| Tier | Account Count | Complexity | Example Motion |
|---|---|---|---|
| Key | 10-100 | Very high | Dedicated AE, custom plays |
| National | 50-500 | High | Named accounts, ABM |
| Core | 100-1,000 | Medium | Territory-based outbound |
| SMB | Thousands+ | Low | Self-serve, inbound-led |
Keep segments between 3 and 5. Fewer than 3 means you're treating fundamentally different buyers the same way. More than 5 creates governance overhead that nobody maintains. Share your segmentation across sales, marketing, and customer success - siloed segments create misaligned motions.
The biggest pitfall we see? Inside-out segmentation - grouping accounts by historical revenue instead of future potential. That's how you end up defending a shrinking book instead of attacking your best opportunities. The second biggest: account hoarding, where reps grandfather legacy accounts into top tiers to protect territory, starving genuinely high-potential accounts of attention. Reevaluate tiers at least every three years as part of commercial planning.
Build a 100-Point ICP Scoring Model
Here's the thing: naming your ICP dimensions is easy. Turning them into a numeric score that reps and marketers can actually act on - that's where most teams stall.
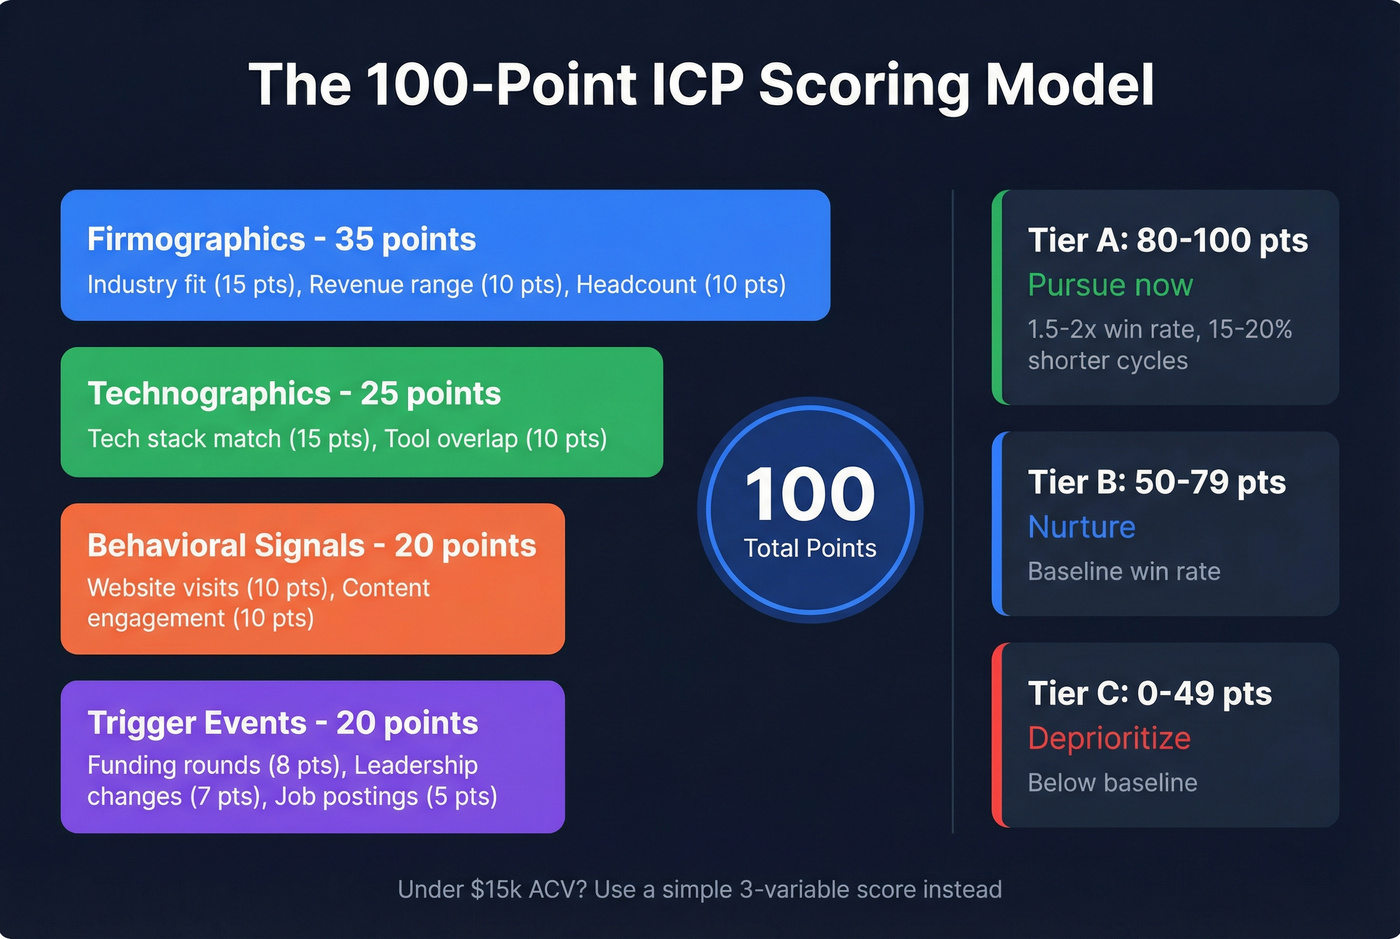
Start by analyzing 50-100 closed-won deals. Look for patterns across four categories: firmographics (industry, revenue, headcount), technographics (tech stack, tools they use), behavioral signals (website visits, content engagement), and trigger events (funding rounds, leadership changes, job postings). Assign weighted points across these categories on a 100-point scale, then set tier thresholds.
| Tier | Score Range | Action | Win Rate Lift |
|---|---|---|---|
| A | 80-100 | Pursue now | 1.5-2x vs Tier B |
| B | 50-79 | Nurture | Baseline |
| C | 0-49 | Deprioritize | Below baseline |
In our experience, Tier A win rates run 1.5-2x higher than Tier B, with 15-20% shorter sales cycles. The build process: analyze closed-won deals, define scoring categories, assign point weights, set tier thresholds, validate quarterly. Skip the quarterly validation and your model decays within two quarters as your market shifts underneath it.
Skip the full 100-point model if your deals average under $15k. A simple 3-variable score - industry fit + headcount + tech stack match - will get you 80% of the value in 20% of the time. Save the full rubric for complex, high-ACV sales where the scoring granularity actually changes decisions.
Your 100-point ICP model is only as good as the contact data behind it. Prospeo gives you 30+ filters - buyer intent, technographics, headcount growth, funding - to turn your scoring rubric into a live target list. 300M+ profiles, 98% email accuracy, refreshed every 7 days.
Stop scoring accounts you can't actually reach.
Map the Buying Committee
Single-persona targeting is dead. The average B2B purchase involves 13 stakeholders, and 89% of buying decisions cross multiple departments according to Forrester. Gartner puts the typical buying group at 6-10 decision-makers, each bringing 4-5 pieces of independent research to the table. Buyers spend only 17% of their purchase time meeting vendors - split across every vendor in the running.
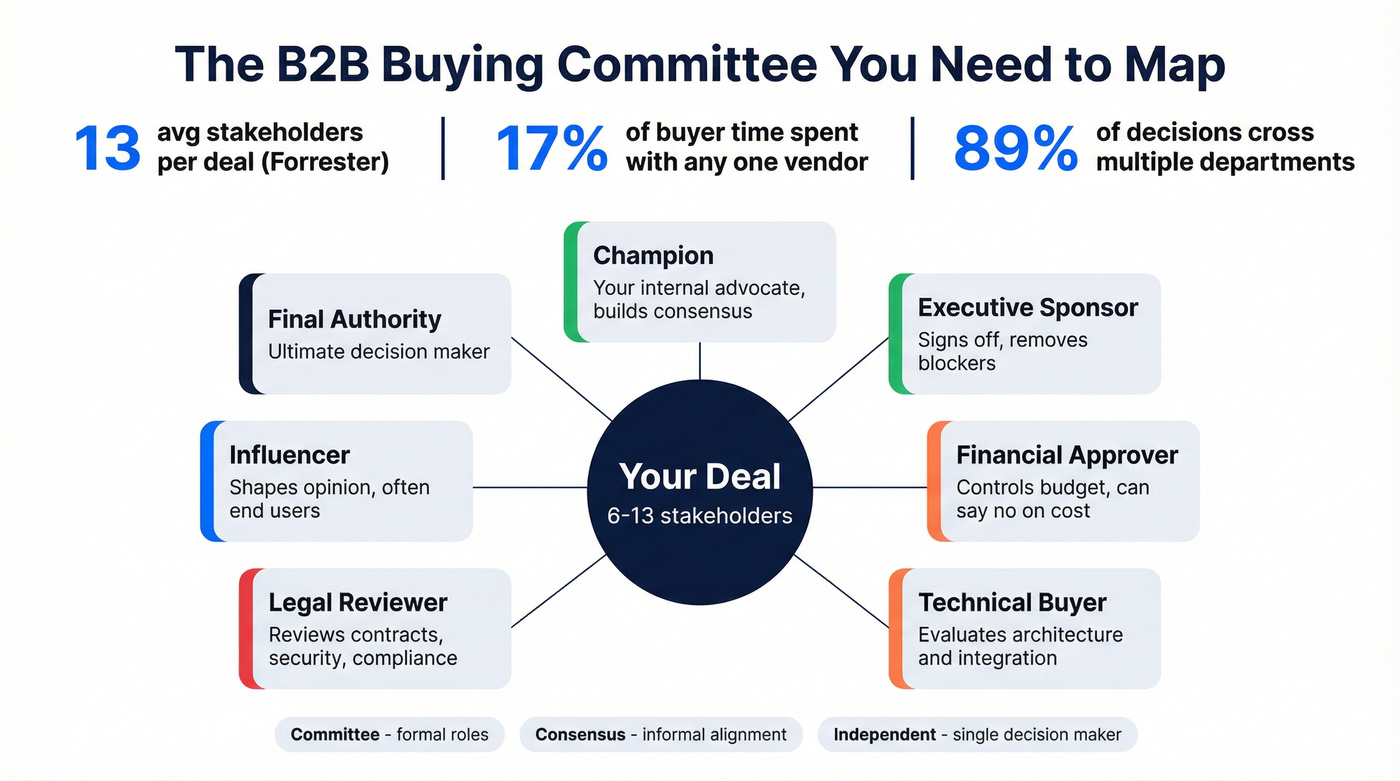
Not every deal follows the same pattern. SiriusDecisions identifies three buying scenarios: committee (formal group with defined roles), consensus (informal alignment across stakeholders), and independent (single decision-maker). Knowing which scenario you're selling into determines how many contacts you need to map and how you sequence outreach.
For committee and consensus deals, identify these roles at every target account:
- Champion and executive sponsor - your internal advocates
- Financial approver and technical buyer - the people who can say no on budget or architecture
- Legal reviewer, influencer, and final authority - the last-mile blockers
- Validate real people against these roles in your CRM
- Operationalize into fields and plays with sales and CS
Once you've identified the roles, you need verified contact data for each person. Prospeo's 30+ filters let you search by job title, seniority, and department within target accounts, so you're not guessing who the financial approver is - you're pulling their verified email and direct dial.
Run Competitive Analysis
Don't boil the ocean. Use the Assess, Benchmark, Strategize framework. First, define your scope: which competitors, which markets, what time horizon. Second, benchmark their positioning, pricing, and feature gaps against yours. Third, strategize your differentiation.
Tier your competitors into three buckets: direct (same audience, same solution), indirect (same problem, different approach), and aspirational (market leaders you learn from). 67% of product managers regularly use competitive frameworks, and 54% report 10-15% improvement in product launch success. The frameworks work. The problem is most teams do competitive analysis once and never update it.
Validate with Primary Research
Frameworks are hypotheses until you validate them with real buyers. But B2B primary research has its own failure modes. The top four pitfalls practitioners flag on r/Entrepreneur:
- Confirmation bias - designing questions that confirm what you already believe
- Low response rates - cold survey emails pull low single-digit response rates; use customer lists first
- False positives - respondents saying they'd buy something they never would
- Speed vs. depth - rushing omnichannel research and getting shallow data
Look, I've seen teams spend six months building a scoring model only to discover their Tier A accounts churn at the same rate as Tier C. Run win/loss analysis on your last 20 deals and compare cohort retention across your ICP tiers. If Tier A accounts don't retain better than Tier B, your scoring model needs recalibration - not more data.
Activate Your Analysis with a Data Stack
You've scored your accounts and mapped the buying committee. Now you need verified contact data for the actual humans at those companies. The right stack covers four categories.
| Category | Tool | Approx. Pricing |
|---|---|---|
| Enrichment | Prospeo | Free (75 emails/mo), ~$0.01/email |
| Enrichment | Apollo | Free tier, from ~$49/mo/user |
| Enrichment | ZoomInfo | ~$15k-$40k/year |
| Intent | 6sense / Demandbase | $30k-$100k+/year |
| CRM | HubSpot | Free CRM, paid plans from ~$800/mo |
| CRM | Salesforce | From ~$25/user/mo |
| Survey | Typeform / SurveyMonkey | Free tiers, from ~$25/mo |
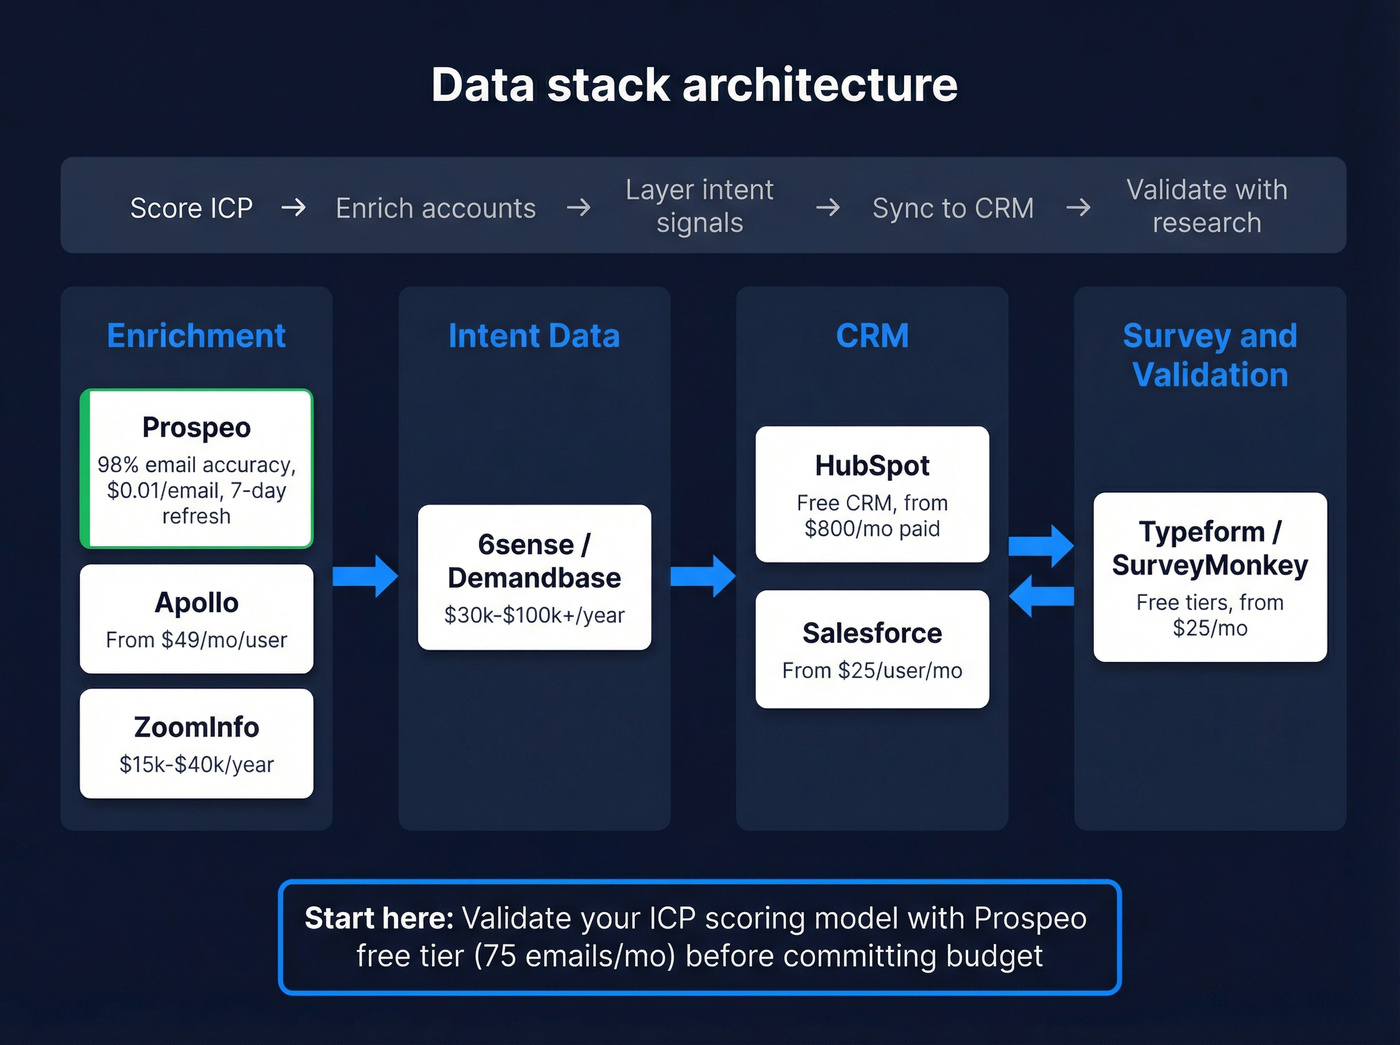
For enrichment specifically, we've tested several platforms and Prospeo consistently delivers 98% email accuracy on a 7-day data refresh cycle - compared to the 6-week industry average. It covers 300M+ profiles with buyer intent signals across 15,000 topics via Bombora, technographic filters, and native CRM integrations. The free tier gives you 75 verified emails per month with no contracts, which is enough to validate your lead scoring model before committing budget.
Mapping 13 stakeholders per deal means nothing if you can't find their direct contacts. Prospeo surfaces verified emails and 125M+ mobile numbers across entire buying committees - at $0.01 per email. No contracts, no sales calls required.
Cover the full buying committee, not just the easy-to-find champion.
FAQ
What's the difference between ICP and buyer persona?
An ICP defines the ideal company - firmographics, revenue, headcount, technographics. A buyer persona defines the ideal person within that company. Build the ICP first; personas without one just give you well-described contacts at the wrong companies.
How often should I revisit my target market analysis?
Revisit ICP scoring quarterly. Reevaluate full segmentation and TAM annually, or whenever win rates shift by more than 10%. Most models decay within two quarters if left untouched.
What's the fastest way to build a target account list from my ICP?
Use a B2B data platform with firmographic, technographic, and intent filters. Apply your ICP scoring criteria as search filters, then export directly to your CRM or sequencer. Free tiers on most platforms give you enough volume to validate the approach before scaling spend.
How many segments should a B2B company have?
Three to five. Fewer means you're oversimplifying fundamentally different buyer profiles. More creates maintenance overhead that erodes within a quarter - nobody updates seven segment playbooks.
Do I need intent data for market analysis?
It isn't required, but it dramatically improves prioritization. Teams combining advanced segmentation with intent signals often see 2-3x higher conversion rates. Intent data tells you which accounts are actively researching your category right now, so reps focus on in-market buyers instead of cold accounts.