B2B Technographics: The Practitioner's Guide to Tech Stack Intelligence
Your SDR just pitched a Salesforce integration to a company that's been running HubSpot for three years. The prospect went cold. The deal died before it started - not because the product was wrong, but because the technographic data was missing.
That's what happens when you skip tech stack intelligence.
Here's the short version: Technographic data tells you what software a company uses. It's most valuable for competitive displacement and personalized outreach. Pixel-based detection - the most common method - misses most backend systems and anything behind authentication. Multi-source detection is more reliable. Enterprise providers charge $25K-$80K+/year, but self-serve platforms with technographic filters start free.
What Is Technographic Data?
Technographic data describes the technology a company uses - their CRM (Salesforce or HubSpot), cloud infrastructure (AWS or Azure), collaboration tools (Slack or Teams), and everything in between. The average enterprise runs 100+ software applications, creating a rich signal layer underneath every account in your TAM.
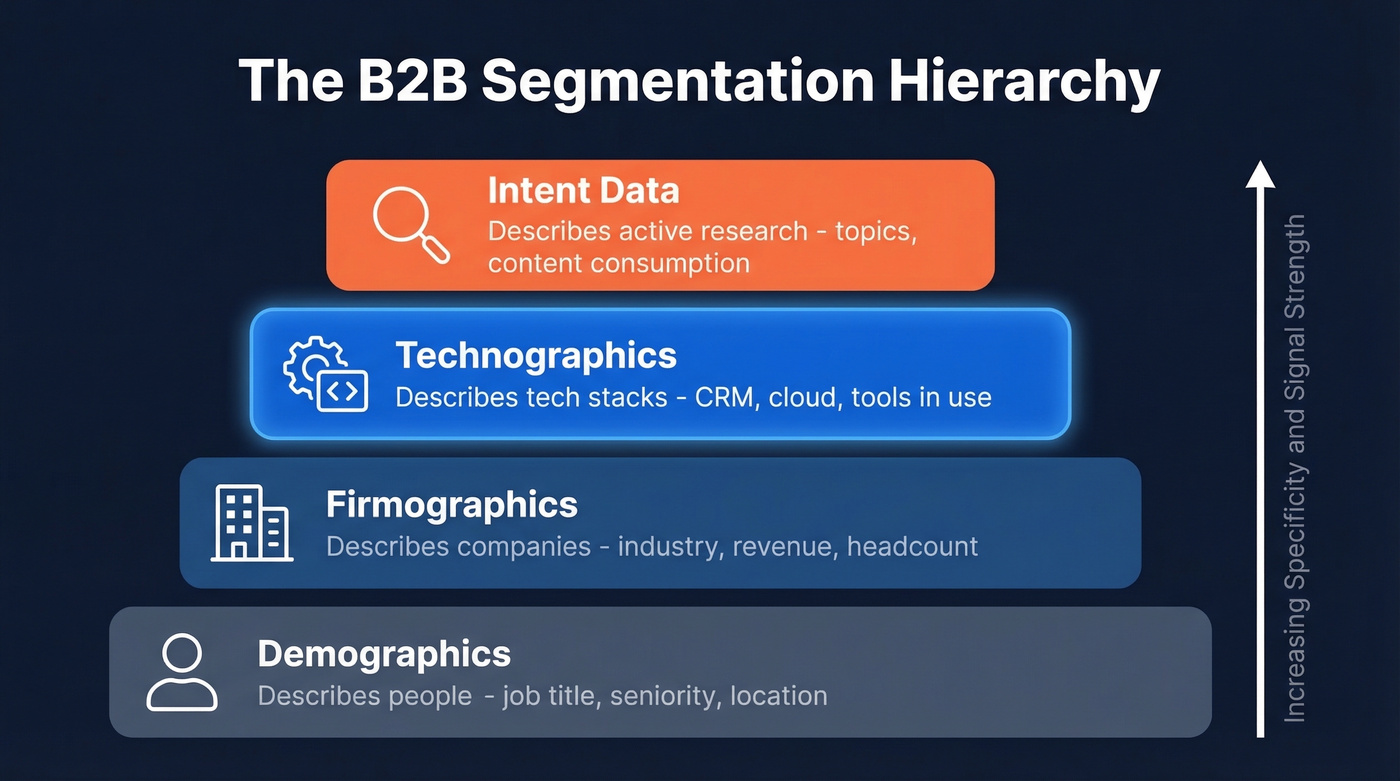
Think of it as the third layer in the segmentation hierarchy. Demographics describe people. Firmographics describe companies. Technographics describe what those companies run. Intent data describes what they're actively researching. VentureBeat called technographics "the new demographics" back in 2016, and while the data sources have evolved since then, the core insight holds up.
Why Tech Stack Intelligence Matters in 2026
The technographic data market grew from $367M in 2020 to $1.17B by 2025. Over 50% of high-impact B2B tech purchases are replacement-driven. If you know what a prospect currently uses, you position your product as the upgrade - not just another option.
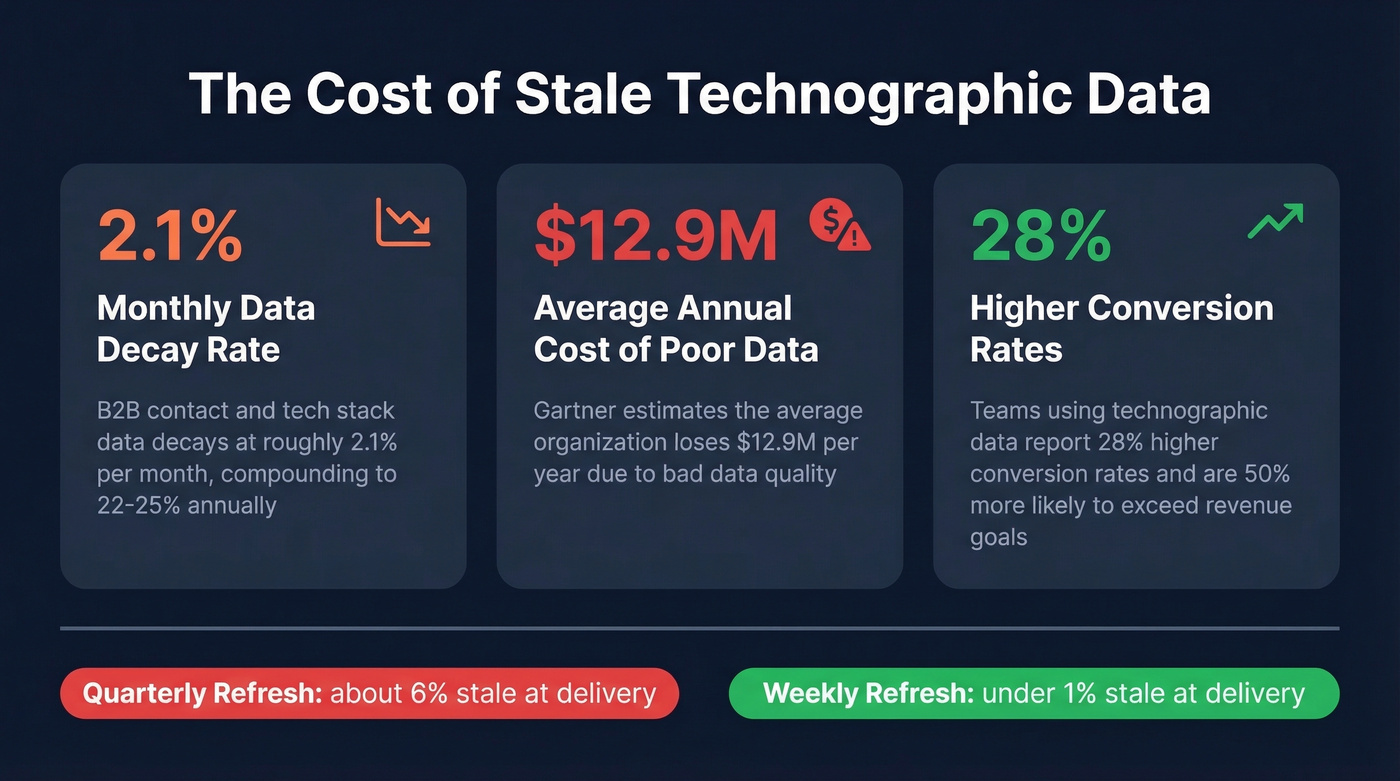
Teams using this data report 28% higher conversion rates and are 50% more likely to exceed revenue goals. Without tech stack intelligence, you're guessing. And guessing at scale gets expensive fast - Gartner pegs the cost of poor data quality at $12.9M/year for the average organization.
How Technographic Data Gets Collected
Not all technographic data is equal. The collection method determines what you can trust, and the options range from free browser extensions to six-figure enterprise platforms.
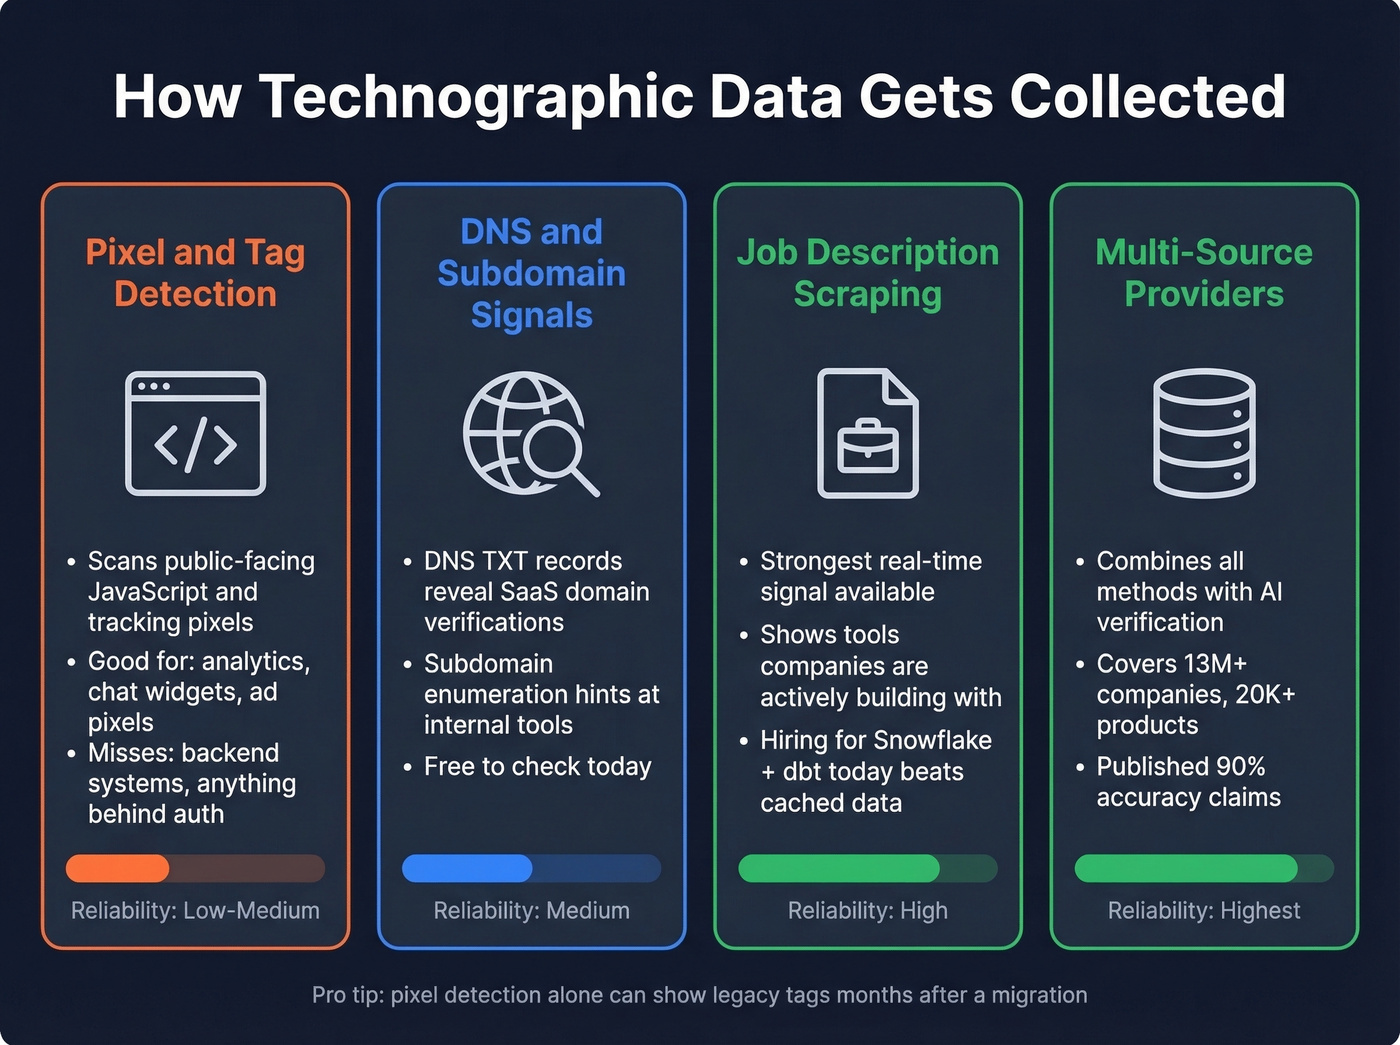
Pixel and tag detection
This is the most common approach. Tools like BuiltWith and Wappalyzer scan public-facing pages for JavaScript snippets and tracking pixels. It works for front-end martech - analytics, chat widgets, ad pixels. But as practitioners on r/gtmengineering consistently point out, it's "useless for backend or anything behind auth." Pixel-based signals can also lag reality after migrations because old code sticks around even when the tool isn't in use anymore. Treat it as a weak prior, not ground truth.
Free signals you can check today
DNS TXT records reveal SaaS tools through domain verification strings. Subdomain enumeration with tools like knock uncovers custom patterns hinting at internal tooling. And vendor customer pages, while only capturing 10-15% of actual customers, surface the most important reference accounts.
Job descriptions
Here's the thing: job postings are the strongest real-time signal we've found. Scraping career pages for required tools tells you what a company is actively building with right now. Hiring for Snowflake + dbt today beats any cached dataset from last quarter.
Multi-source providers
These combine all of the above. HG Insights covers 13.2M+ companies across 20K+ products using AI-led detection, with a published 90% accuracy claim.
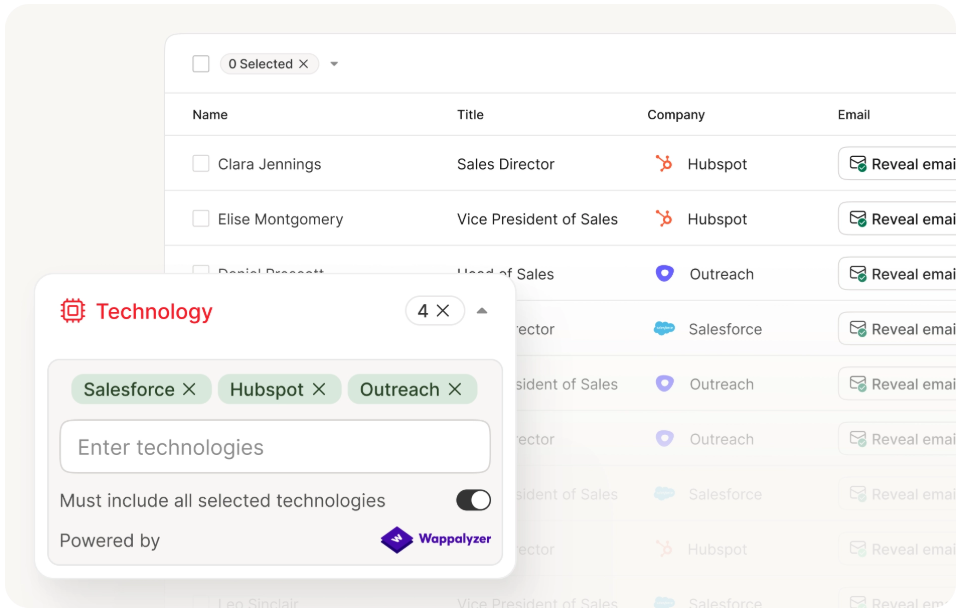
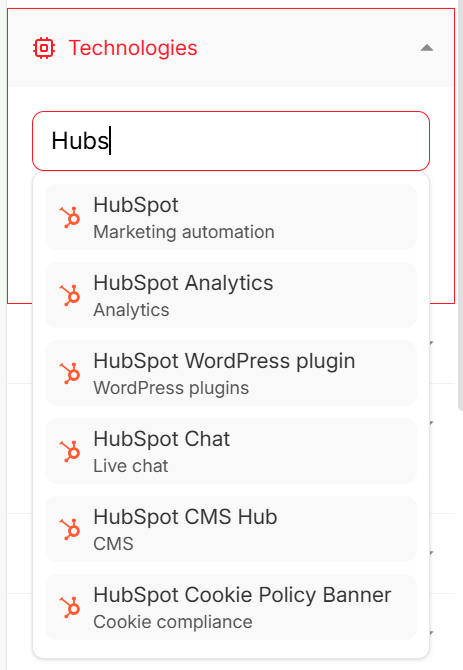
Prospeo combines Wappalyzer-powered technographic filters with 30+ other signals - buyer intent, job changes, funding, headcount growth - across 300M+ profiles. Find every company running your competitor's tool, then get 98% accurate emails for the decision-makers inside. At $0.01/email, you don't need a $50K platform.
Stop guessing at tech stacks. Filter, find contacts, and launch outreach in minutes.
How Teams Actually Use Technographic Data
This is where tech stack intelligence moves from interesting to revenue-generating.
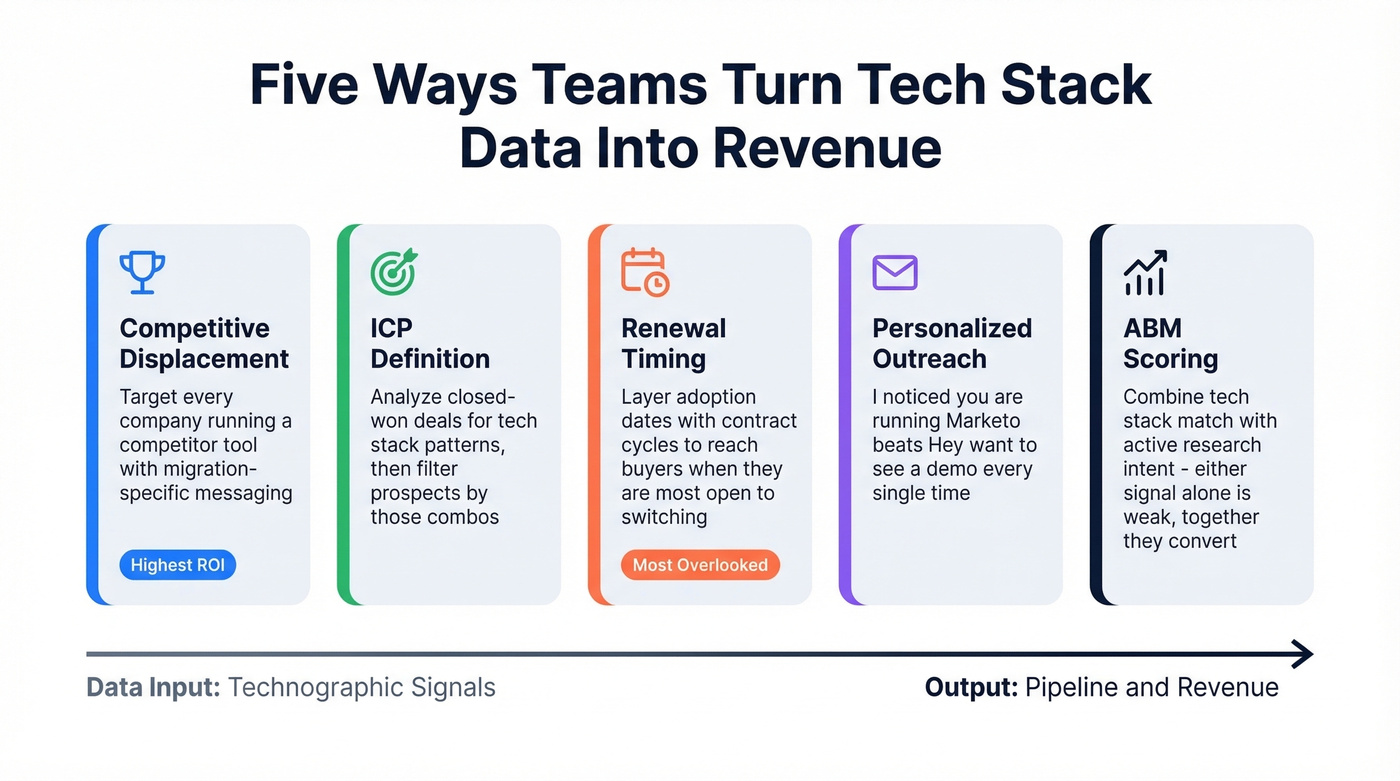
Competitive displacement is the highest-ROI use case, period. Target every company running a competitor's product with messaging built around migration paths and pain points specific to that tool.
ICP definition gets sharper when you analyze closed-won deals for tech stack patterns. If HubSpot + Snowflake + Outreach appears in 60%+ of your best accounts, filter your prospect database by that exact combination. We've seen teams cut their prospecting time in half just by adding two or three technographic filters to their existing firmographic criteria. (If you need a framework for this, start with an Ideal Customer Profile.)
Renewal timing is the signal most teams ignore entirely. Contract renewal windows are when buyers are most open to switching. Layer technographic data with adoption dates to time outreach around annual renewals.
Personalized outreach converts far better than generic pitches. "I noticed you're running Marketo - here's how teams migrate in under two weeks" beats "Hey, want to see a demo?" every time. (If you want to systematize this, use a personalized outbound email workflow.)
ABM scoring gets real teeth when you combine tech stack match with active research intent. Either signal alone is weak. Together they're actionable. (Benchmarks help here - see Account Based Marketing Benchmarks.)
Let's be honest about one thing, though: if your average deal size is under $15K, you probably don't need a $50K data platform to capture these signals. A self-serve tool with technographic filters gets you 80% of the way there.
Types of Technographic Segmentation
Not every tech stack signal carries the same weight. The segmentation approach you pick depends on your product and sales motion.
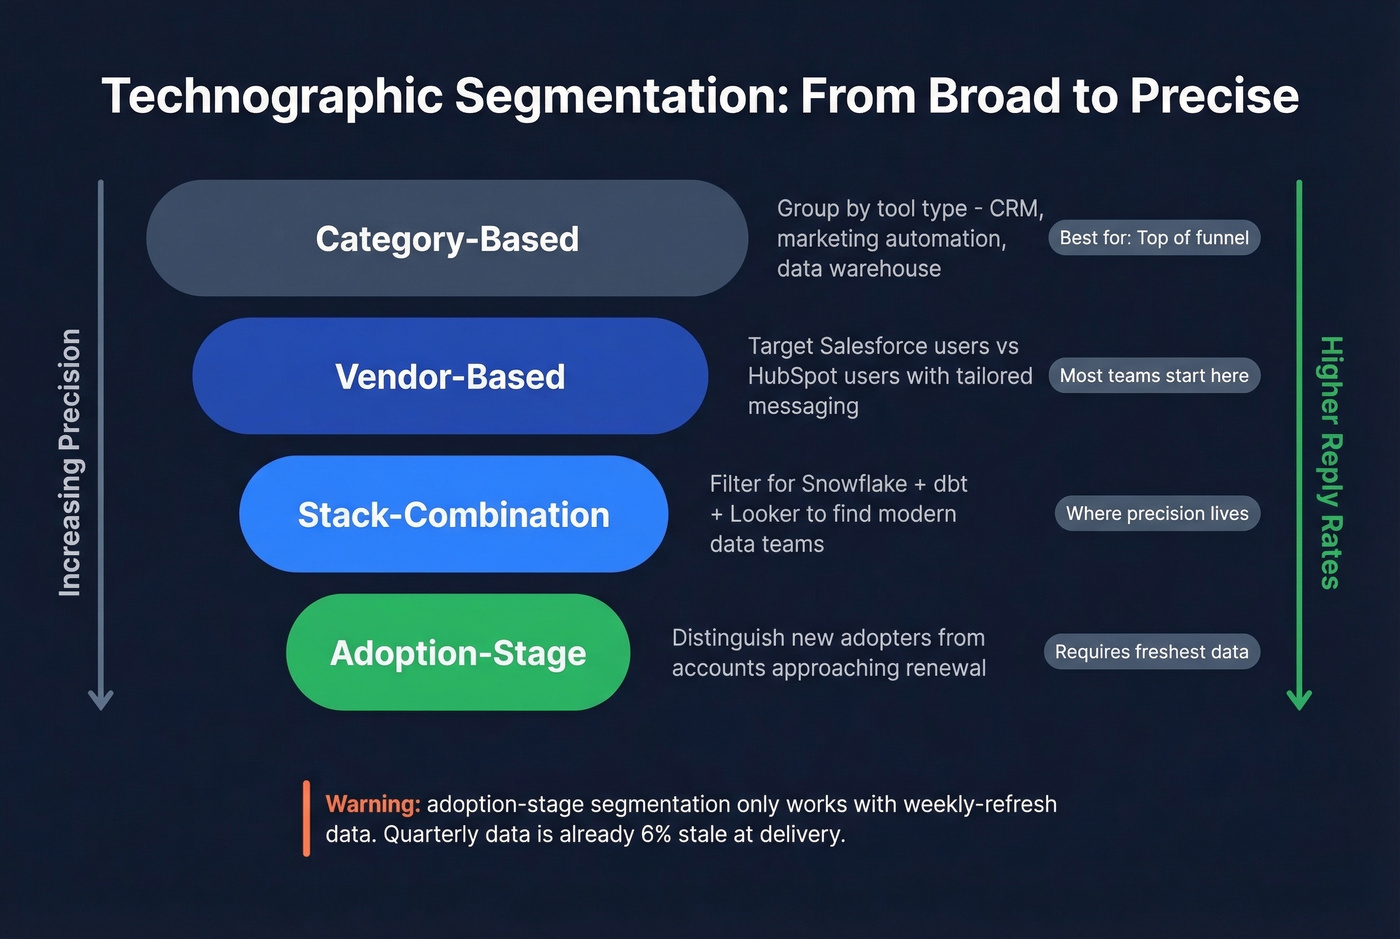
Category-based segmentation groups prospects by tool type - CRM, marketing automation, data warehouse, helpdesk. It's the broadest cut and works well for top-of-funnel targeting.
Vendor-based segmentation narrows to specific products. Targeting Salesforce users versus HubSpot users lets you tailor messaging to each platform's pain points and migration paths. Most teams start here.
Stack-combination segmentation filters for accounts running a specific set of tools together. A company using Snowflake + dbt + Looker signals a modern data team - very different from one running legacy on-prem BI. This is where the real precision lives, and it's where we've seen the biggest impact on reply rates.
Adoption-stage segmentation distinguishes between companies that recently adopted a tool versus those approaching renewal. Timing your outreach around these stages dramatically changes conversion rates, but it requires fresher data than most providers deliver.
What Technographic Providers Cost
Most technographic providers are overpriced for what you actually get. Skip the enterprise platforms unless you're running a 50+ person sales org with dedicated data ops.
| Provider | Detection Method | Coverage | Pricing | Refresh Cycle |
|---|---|---|---|---|
| Prospeo | Wappalyzer + live job posting signals | 300M+ profiles, 143M+ emails | Free tier; ~$0.01/email | 7 days |
| HG Insights | AI + multi-source | 13.2M+ companies | $24K-$80K+/yr | Not public |
| Demandbase | Proprietary | 136M+ domains; 47K+ technologies | ~$30K-$100K+/yr | Not public |
| ZoomInfo | Multi-source | Broad (bundled) | $15K-$45K+/yr | Not public |
| BuiltWith | Pixel/tag scan | 673M+ websites | $295-$995/mo | Varies |
| Apollo | Multi-source | Broad (bundled) | $49-$119/user/mo | Not public |
| Wappalyzer | Pixel/tag scan | 7,400 technologies | 50 free/mo | Daily |
B2B data decays at roughly 2.1% per month - about 22-25% annually. Quarterly-refresh data is already about 6% stale when it hits your CRM. Prospeo's 7-day refresh cycle keeps technographic filters aligned with reality instead of last quarter's snapshot. If you're comparing options, start with a shortlist of the best technographic data tools and cross-check against your workflow.
You just read that adoption-stage segmentation requires fresher data than most providers deliver. Prospeo refreshes every 7 days - while the industry average sits at 6 weeks. Layer technographic filters with intent data tracking 15,000 Bombora topics to catch buyers mid-renewal window, then pull verified emails and direct dials in one click.
Technographic targeting only works when the data is current. Ours refreshes weekly.
Common Mistakes
Trusting pixel detection alone. BuiltWith and similar tools can show legacy tags long after a migration. Pixel data lags reality, sometimes by months.
Ignoring data decay. At 2.1%/month, quarterly-refresh data is about 6% stale at delivery. That compounds fast across a large TAM - by the time your SDRs work through a 10,000-account list built on stale data, hundreds of those tech stack signals are already wrong. (This is also why data enrichment needs to be continuous, not quarterly.)
Using technographics in isolation. Forrester explicitly recommends pairing technographic signals with intent and firmographic data. A tech stack match without buying intent is just a list. (If you're building the system end-to-end, see how to automate sales signals.)
Skipping compliance. As of 2026, 20+ US states have comprehensive privacy laws, plus GDPR. Broader "sensitive data" definitions and universal opt-out signals mean your data practices need legal review. Don't assume your provider handles this for you - ask for their DPA and compliance documentation. (More detail: B2B compliance.)
FAQ
What's the difference between technographic and firmographic data?
Firmographic data describes the company - industry, size, revenue. Technographic data describes what technology that company uses. Layer both with intent signals for ICP segmentation that actually converts.
Can I get technographic data for free?
Yes, partially. Wappalyzer offers 50 free lookups/month, and tools like Prospeo include technographic search filters on their free tier. You can also check DNS TXT records and scrape job postings manually. These free sources won't match enterprise coverage, but they're enough to validate your ICP before committing budget.
How often does technographic data go stale?
B2B data decays at roughly 2.1% per month - about 6% stale per quarter. Providers refreshing monthly or quarterly deliver outdated records at scale. Look for weekly refresh cycles to keep your prospecting lists accurate.
How do technographics help identify target customers?
By revealing what software a prospect already runs, technographics let you filter for accounts matching your ideal tech stack profile - companies most likely to need your product and least likely to face integration friction. Combined with firmographic and intent signals, this narrows your TAM to accounts worth pursuing right now.