CAC to LTV Ratio: Why 3:1 Isn't Enough Context
Your CAC to LTV ratio looks great on a board deck. It also tells you almost nothing about whether your business will survive the next 18 months.
The ratio compresses too many moving variables into a single number - and most teams calculate it wrong anyway. They use revenue instead of gross margin, count ad spend instead of fully loaded costs, and blend cohorts that have nothing in common. We've seen companies report a "healthy 4:1" while burning cash faster than they can raise it.
Quick version: LTV:CAC tells you if your unit economics work on paper. Payback period tells you if you'll survive long enough to see the returns. Track both, and calculate them correctly.
What the Ratio Actually Tells You
The CAC to LTV ratio measures how much revenue a customer generates over their lifetime relative to what you spent acquiring them. A 3:1 ratio means you earn $3 for every $1 of acquisition cost.
Operators use it to gauge unit economics health. Investors use it to screen deals. Finance teams drop it into board decks. But the number only means something if the inputs are right, and that's where things fall apart. The formula assumes stable churn, uniform customer behavior, and clean cost attribution across sales and marketing - none of which hold in practice for most companies at any stage of growth.
The Formulas
LTV = (ARPA x Gross Margin) / Churn Rate
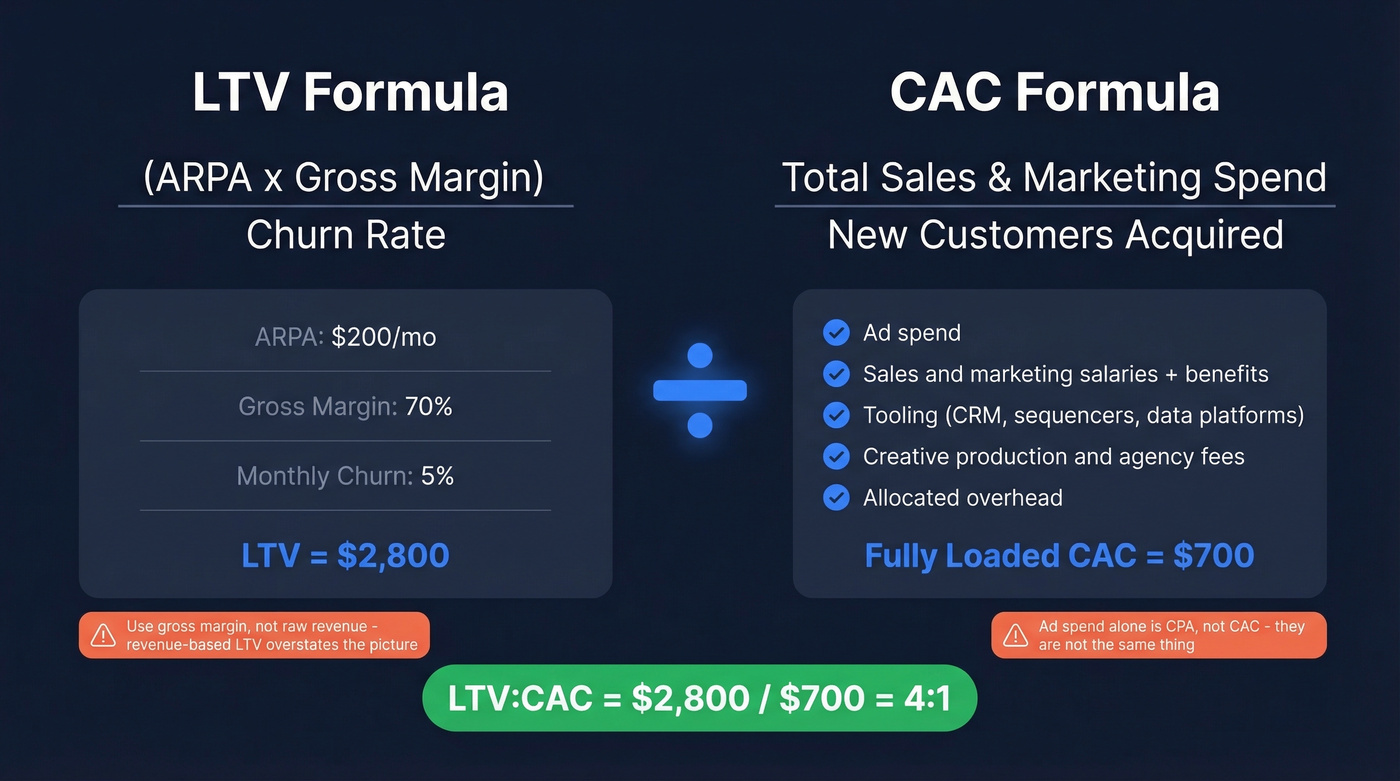
CAC = Total Sales & Marketing Spend / New Customers Acquired
The margin-adjusted LTV matters here. Revenue-based LTV overstates the picture. You need gross margin in the numerator, not raw ARPA.
For CAC, "total spend" means fully loaded:
- Ad spend
- Sales and marketing salaries + benefits
- Tooling (CRM, sequencers, data platforms)
- Creative production and agency fees
- Allocated overhead
If you're only counting ad spend, you're calculating CPA - not CAC. They're not the same thing.
Here's a quick example. ARPA of $200/month, 70% gross margin, 5% monthly churn. LTV = ($200 x 0.70) / 0.05 = $2,800. Fully loaded CAC of $700 gives you a 4:1 ratio. One warning: if you have negative net churn, the standard formula breaks and LTV goes to infinity. Cap your customer lifetime at 5 years.
Every bounced email and wrong number inflates your CAC without adding a single dollar to LTV. Meritt cut their bounce rate from 35% to under 4% with Prospeo and tripled pipeline to $300K/week - a structural CAC reduction, not a marginal one. At $0.01 per verified email, cleaner data is the fastest lever you have.
Fix your unit economics at the source - start with better data.
What's a "Good" Ratio?
The 3:1 target is a starting point, not a finish line.
| Ratio | What It Means |
|---|---|
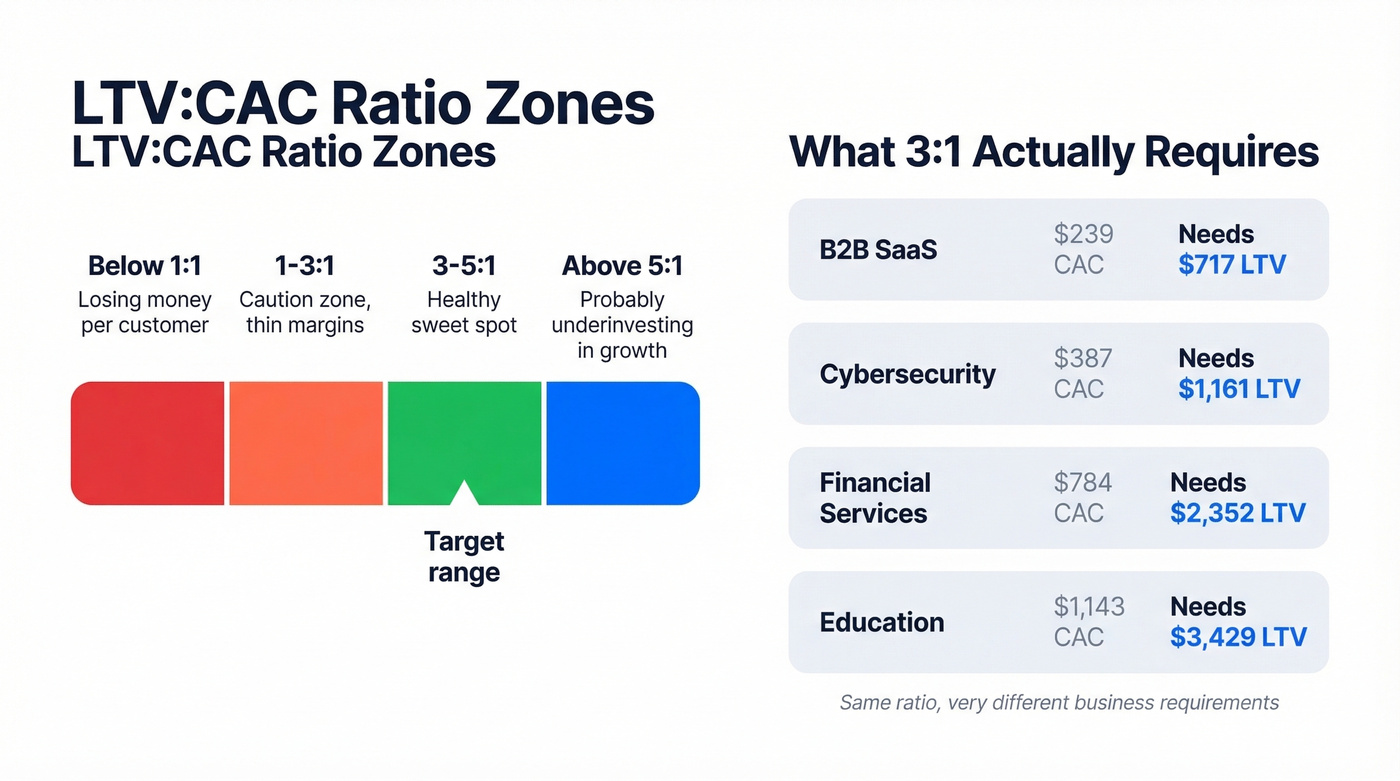
| Below 1:1 | Losing money per customer |
| 1-3:1 | Caution zone - thin margins |
| ~3:1 | Healthy baseline |
| Above 5:1 | Probably underinvesting in growth |
Context matters enormously. A $239 average CAC in B2B SaaS demands a very different LTV than a $1,143 CAC in education.
| Industry | Avg. CAC |
|---|---|
| B2B SaaS | $239 |
| Cybersecurity | $387 |
| Financial Services | $784 |
| Education | $1,143 |
A 3:1 ratio with a $239 CAC means you need $717 in gross-margin-adjusted LTV. With a $1,143 CAC, you need $3,429. Same ratio, very different business requirements. SaaS companies often target higher ratios because subscription models benefit from compounding retention and expansion revenue - but only if churn stays controlled. For eCommerce, healthy ratios tend to land around 2-3:1 depending on margins and repeat purchase rate.
Why LTV:CAC Misleads You
This is where most guides stop. Let's keep going.
Payback Period Matters More
LTV:CAC tells you the eventual return. Payback period tells you when you get your money back: CAC / monthly gross profit per customer.
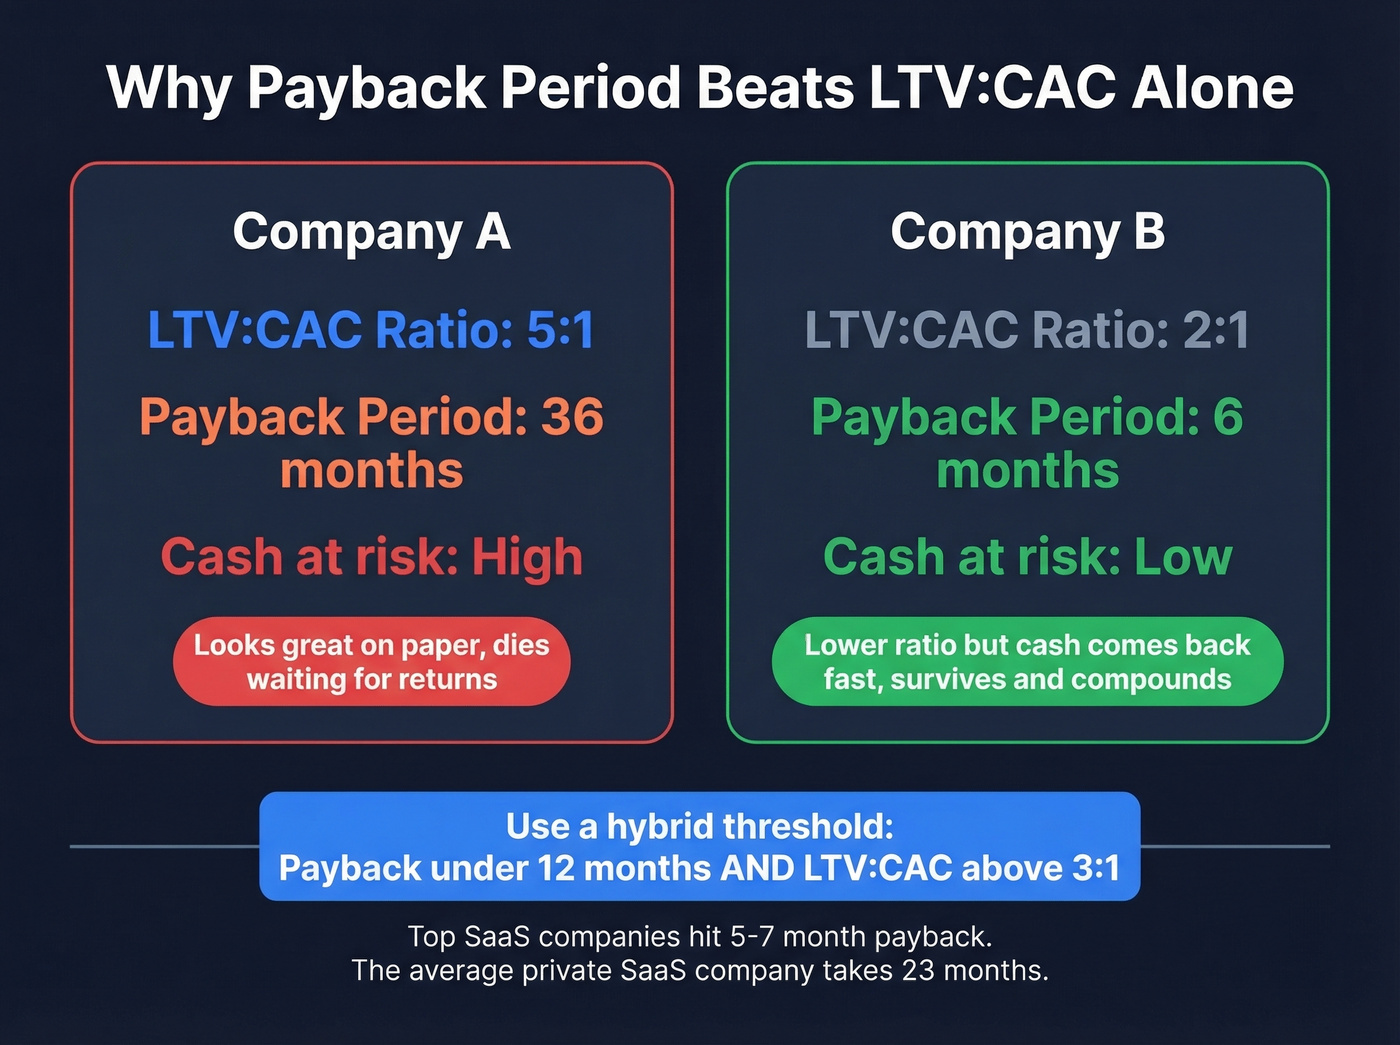
Top-performing SaaS companies hit 5-7 month payback. The average for private SaaS is 23 months. That gap is staggering - most companies are burning cash far longer than their models suggest.
Here's the thing: we'd rather have 2:1 with a 6-month payback than 5:1 with a 36-month payback. The consensus on r/SaaS agrees. Cash-constrained businesses die waiting for theoretical LTV to materialize. Use a hybrid threshold - payback under 12 months AND LTV:CAC above 3:1 - to filter out false positives.
Cohort LTV vs. Formula LTV
The ARPA / churn formula assumes all customers behave identically. They don't.
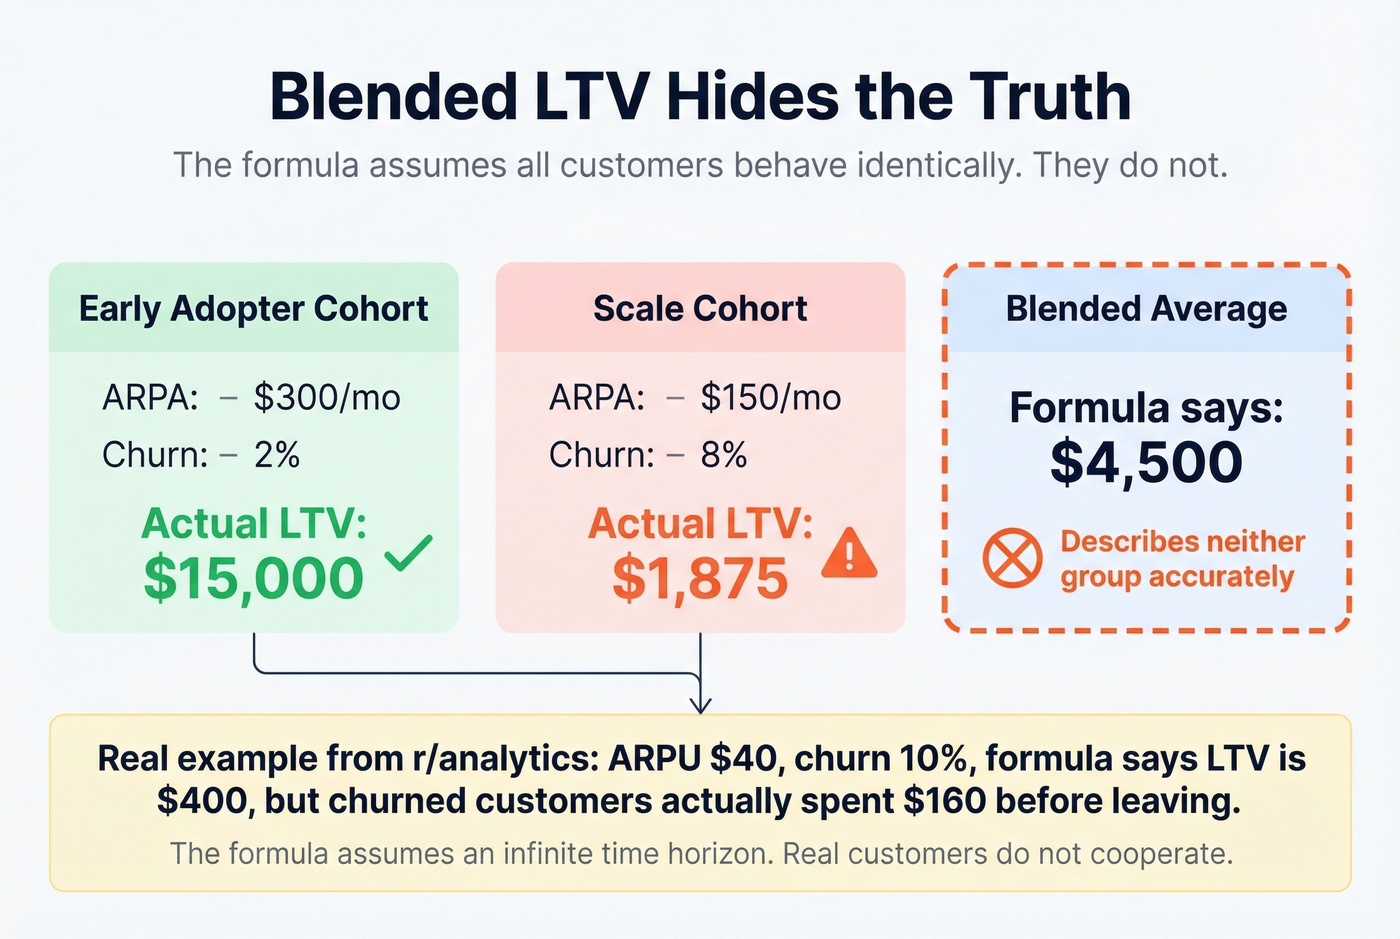
An "Early Adopter" cohort at $300 ARPA and 2% churn has an LTV of $15,000. A "Scale" cohort at $150 ARPA and 8% churn has an LTV of $1,875. Blend them and you get a misleading $4,500 that describes neither group. One r/analytics thread nailed this: ARPU $40, churn 10%, formula says LTV is $400 - but churned customers actually spent $160 before leaving. The formula assumes an infinite time horizon. Real customers don't cooperate.
If you want to go deeper on churn mechanics, start with a proper churn analysis instead of a single blended rate.
CAC Timing and Expansion Traps
If your sales cycle runs 60+ days, dividing this month's spend by this month's new customers produces garbage. Always align spend periods with the cohort that actually converted from that spend.
Mixing acquisition CAC with expansion-inflated LTV is the most common way teams accidentally inflate their ratio. CAC measures what you spent to land new customers; expansion revenue has different cost drivers. Include expansion in LTV without separating the costs, and you're measuring acquisition cost against a revenue stream with entirely different economics. As Stage 2 Capital puts it, LTV:CAC compresses variables that change over time into a single point-in-time number.
How to Improve Your Ratio
Two levers. Both matter.
Reduce Acquisition Cost
Digital ad costs are up 5.13% market-wide, so efficiency gains have to come from conversion rates, not cheaper impressions.
The fastest win for outbound teams: fix your contact data. Bad emails bounce, bad phone numbers waste rep time, and every wasted touch inflates CAC. We've seen this firsthand - Meritt dropped their bounce rate from 35% to under 4% after switching to Prospeo, tripled their connect rate, and pushed pipeline from $100K to $300K per week. That's not a marginal improvement; it's a structural reduction in wasted acquisition spend.
If you're diagnosing bounces, use email bounce rate benchmarks and fixes before you scale volume.
Increase Lifetime Value
Retention is the bigger lever, and it's getting harder. 75% of software companies reported declining retention through 2024. Focus on onboarding quality, expansion revenue from existing accounts, and reducing time-to-value. Skip this if your churn is already below 3% monthly - at that point, acquisition efficiency will move the needle faster.
To pressure-test your retention inputs, align on what is churn and how you’re defining it across cohorts.
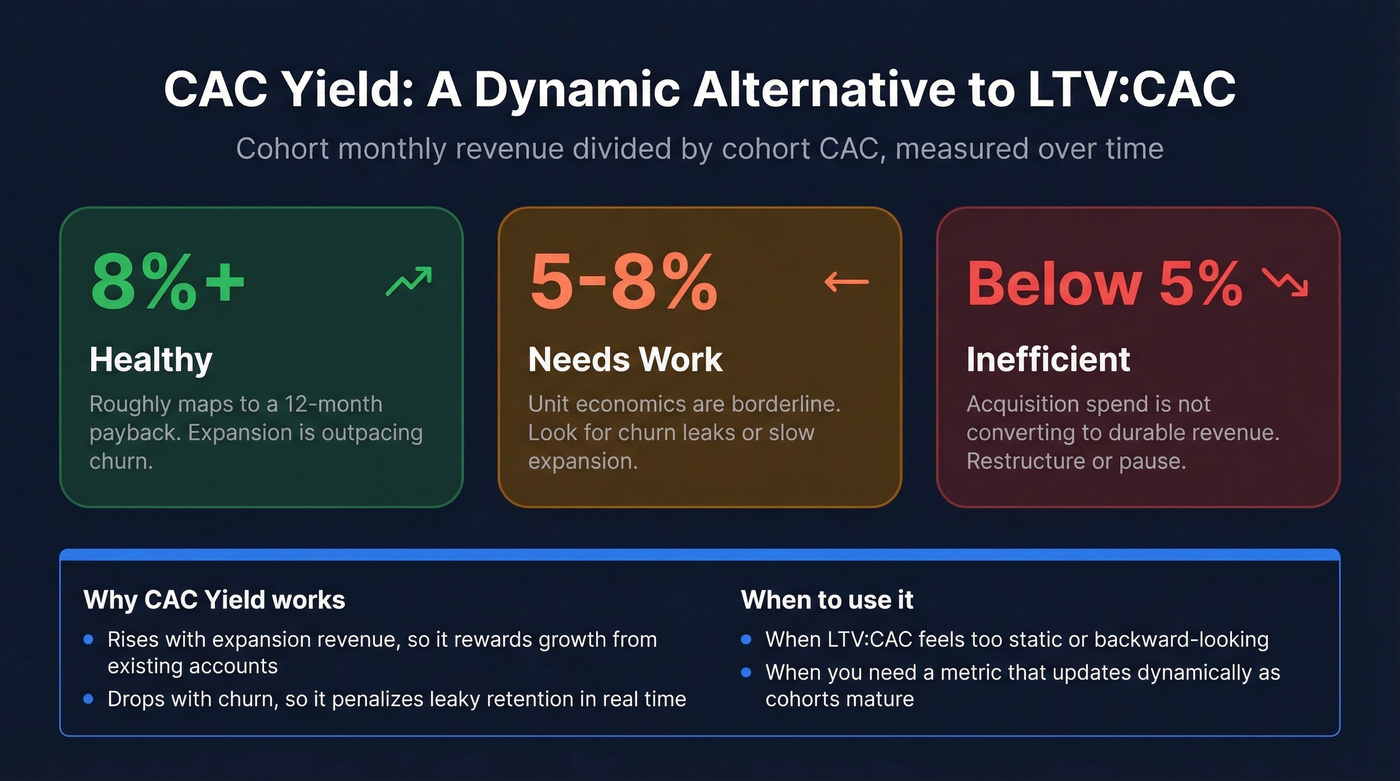
The Alternative Metric: CAC Yield
If LTV:CAC feels too static, look at CAC Yield - cohort monthly revenue divided by cohort CAC, measured over time. Benchmarks: 8%+ is healthy and roughly maps to a 12-month payback, 5-8% needs work, below 5% is inefficient. It rises with expansion and drops with churn, giving you a dynamic read instead of a snapshot.
Your LTV:CAC ratio is only as reliable as the inputs. When reps waste hours on bad numbers and bounced emails, fully loaded CAC balloons while pipeline stalls. Prospeo gives you 125M+ verified mobiles with a 30% pickup rate and 98% accurate emails - so every dollar of sales spend actually reaches a buyer.
Stop inflating CAC with dead contacts. Get verified data today.
FAQ
Is a higher CAC to LTV ratio always better?
No. Above 5:1 typically signals you're underinvesting in growth and leaving revenue on the table. The sweet spot sits between 3:1 and 5:1, paired with payback under 12 months. If your ratio exceeds 5:1, test increasing ad spend or hiring reps before competitors capture the demand you're ignoring.
How often should I recalculate LTV:CAC?
Quarterly at minimum, using cohort-based LTV updated monthly. Point-in-time snapshots miss trends - a healthy Q1 ratio can deteriorate by Q3 if churn creeps up. Tie recalculation to your board reporting cadence so the numbers stay current.
What's the difference between CAC and CPA?
CAC is the fully loaded cost to acquire a paying customer - salaries, tools, overhead included. CPA measures cost per any conversion like a lead, trial signup, or registration. Using CPA where you mean CAC makes unit economics look artificially good by roughly 40-60%.
How does better contact data improve my ratio?
Inaccurate emails and wrong phone numbers inflate acquisition costs through wasted rep time and burned sequences. When bounce rates drop from 35% to under 4%, more of your outbound spend converts into pipeline instead of dead ends - and your CAC drops without changing a single thing about your go-to-market strategy.