Churn Prediction: What Works, What Fails, and What to Do About It
A RevOps lead we know built a churn prediction model that scored 85% precision and 85% recall in testing. Month one in production? 60% recall, 18% precision. The CS team got flooded with false positives, stopped trusting the scores, and went back to gut instinct within six weeks.
That's not an edge case - it's the norm. Here's how to avoid it.
The Short Version
Churn prediction uses machine learning to score which customers will leave so you can intervene before they do. Most models fail not because of bad algorithms but because of dirty data, missing action plans, and offline/online performance gaps. We're covering the full lifecycle here - from measuring churn to building models to actually doing something with the scores.
What Is Churn Prediction?
It's the practice of using ML models to assign a probability score: how likely is this customer to leave within a defined time window? The output isn't a binary yes/no. It's a risk score that feeds into segmentation, prioritization, and intervention workflows.
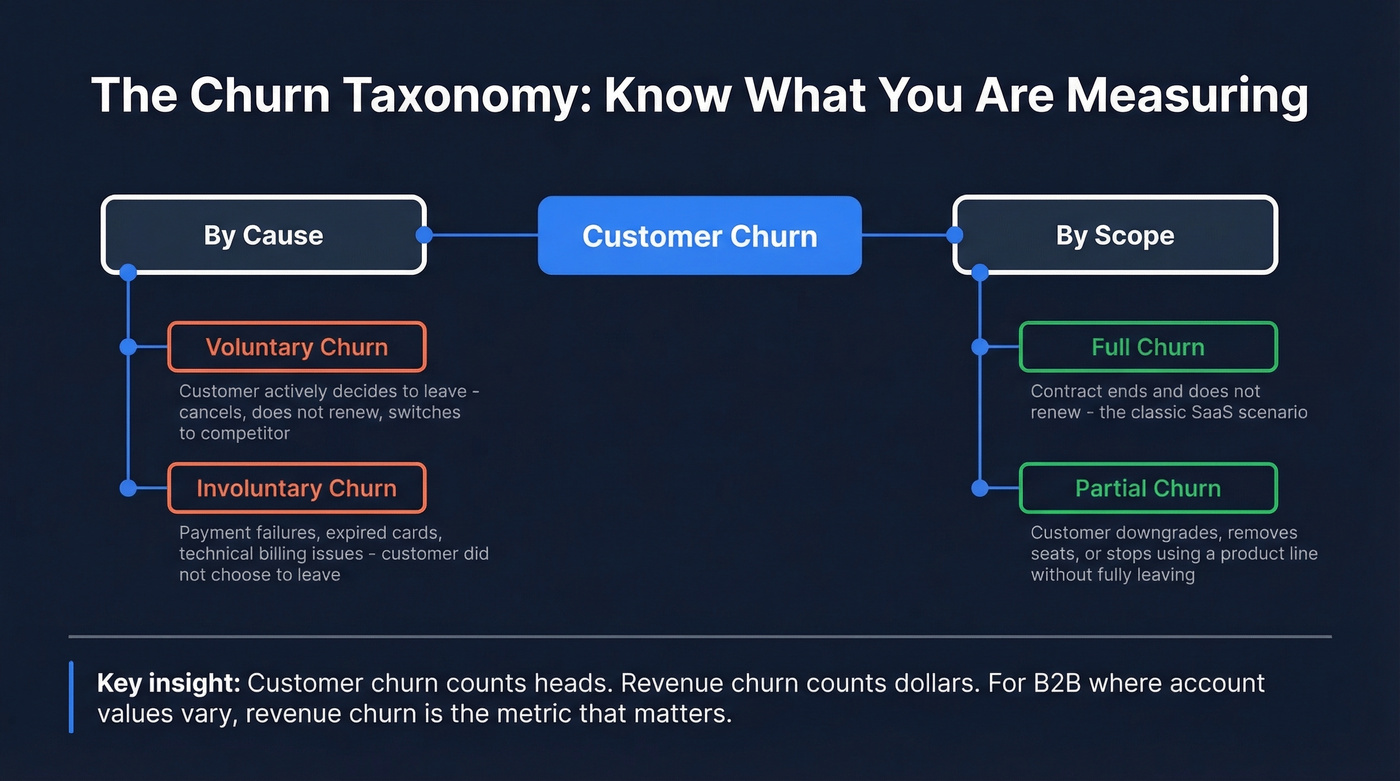
Voluntary churn is the customer actively deciding to leave - they cancel, they don't renew, they switch to a competitor. Involuntary churn is payment failures, expired cards, technical issues. The customer didn't choose to leave; their billing just broke.
Subscription churn is the classic SaaS scenario: the contract ends and doesn't renew. Partial churn is subtler - a customer downgrades, removes seats, or stops using a product line without fully leaving. Then there's the customer-vs-revenue distinction. Losing ten $50/month accounts looks the same as losing one $500/month account in customer churn metrics. Revenue churn tells you the actual financial damage, and for any business where customer values vary significantly - which is most B2B companies - revenue churn is the metric that matters.
Why Predicting Churn Matters
The economics are brutal and well-documented. Increasing customer retention by just 5% can boost profits 25-95%, per Bain & Company research. The probability of selling to an existing customer is 60-70%, compared to just 5-20% for new prospects. HBR puts the acquisition-vs-retention cost ratio at 5-7x. At scale, Accenture estimates companies lose $1.6 trillion annually to customer churn.
The causes aren't mysterious either - 53% of churn traces back to just three culprits: poor onboarding (23%), weak relationship management (16%), and bad customer service (14%).
Most companies know retention matters. They've seen the stats. The gap isn't awareness - it's prediction. By the time a customer submits a cancellation request, the intervention window has closed. Forecasting attrition moves the signal upstream, giving your CS and retention teams weeks or months of lead time instead of days. And here's the thing that makes this one of the more reliable ML applications in business: it runs on first-party product usage data and clear contract timelines, not noisy third-party signals you don't control.
Industry Benchmarks
Benchmarks vary wildly depending on who's measuring, how they define churn, and what time window they use. That caveat aside, here's a consolidated view:
| Industry | Annual Churn | Retention | Source |
|---|---|---|---|
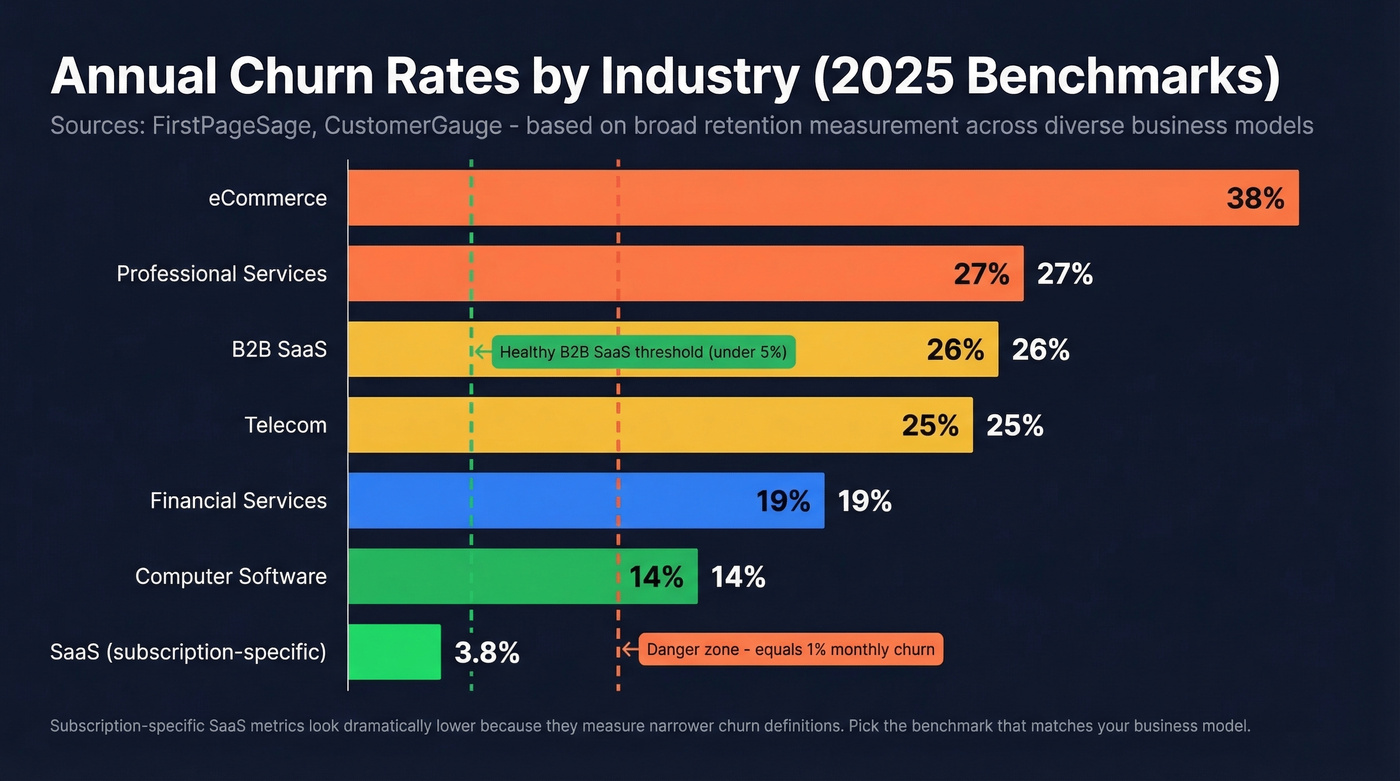
| B2B SaaS | ~26% | ~74% | FirstPageSage |
| Telecom | ~25% | ~75% | FirstPageSage |
| eCommerce | ~38% | ~62% | FirstPageSage |
| Computer Software | ~14% | ~86% | CustomerGauge |
| Financial Services | ~19% | ~81% | CustomerGauge |
| Professional Svcs | ~27% | ~73% | CustomerGauge |
| SaaS (avg) | ~3.8%/yr | ~96% | Vena Solutions |
| B2B SaaS | ~4.9%/yr | ~95% | Vena Solutions |
| All (Recurly) | ~4% | ~96% | IBM/Recurly |
The Vena and Recurly numbers look dramatically lower because they measure subscription-specific churn in SaaS businesses, while FirstPageSage (based on data from 10,214 firms across Jan 2023-Mar 2025) and CustomerGauge measure broader retention across diverse business models and customer types. Don't compare these numbers directly - pick the benchmark that matches your business model and measurement approach.
For B2B SaaS specifically, below 5% annual churn is healthy. Top performers keep it under 3%. Monthly churn above 1% is a red flag that compounds fast - 1% monthly equals roughly 11.4% annual. Monthly churn above 1% is a red flag that compounds fast - 1% monthly equals roughly 11.4% annual.
How to Measure Churn
Before you predict churn, you need to measure it consistently. The formulas are simple; the definitions are where teams get tripped up.
Customer churn rate = (Customers lost during period / Customers at start of period) x 100. Straightforward, but it treats a $50/month account the same as a $50,000/month account.
Gross revenue churn = (MRR lost to cancellations and downgrades / MRR at start of period) x 100. This captures the financial impact but ignores expansion revenue from surviving customers.
Net revenue churn = ((MRR lost - MRR gained from expansions) / MRR at start of period) x 100. This is the gold standard for SaaS. When expansion revenue from existing customers exceeds lost revenue, you get negative churn - the best position a SaaS company can be in, where your existing customer base grows even without new logos.
Revenue churn matters more than customer churn whenever customer values vary. A company losing ten small accounts has a very different problem than one losing its largest enterprise customer, even if the customer churn rate looks identical.
Building a Churn Prediction Model
Data You Need
Every churn tutorial assumes you have clean, well-structured data sitting in a warehouse. In practice, data quality is the real bottleneck - not algorithm selection.
You need four categories of data:
- Behavioral - session frequency, feature adoption, login patterns, time-in-app trends
- Transactional - spend-per-order trends, purchase frequency, transaction intervals, contract details
- Support - ticket volume, resolution times, CSAT scores, interaction sentiment
- Billing - payment failures, payment method, contract type (monthly vs annual), renewal dates
The common failure mode isn't missing a data category. It's having dirty, inconsistent data within categories you think you've covered. CRM fields that are 40% blank, support tickets with no sentiment tagging, billing systems that don't flag soft declines. Audit your data quality before you touch a model.
Feature Engineering
Raw data doesn't predict churn. Engineered features do. The difference between a mediocre model and a useful one usually comes down to how well you transform raw logs into predictive signals.
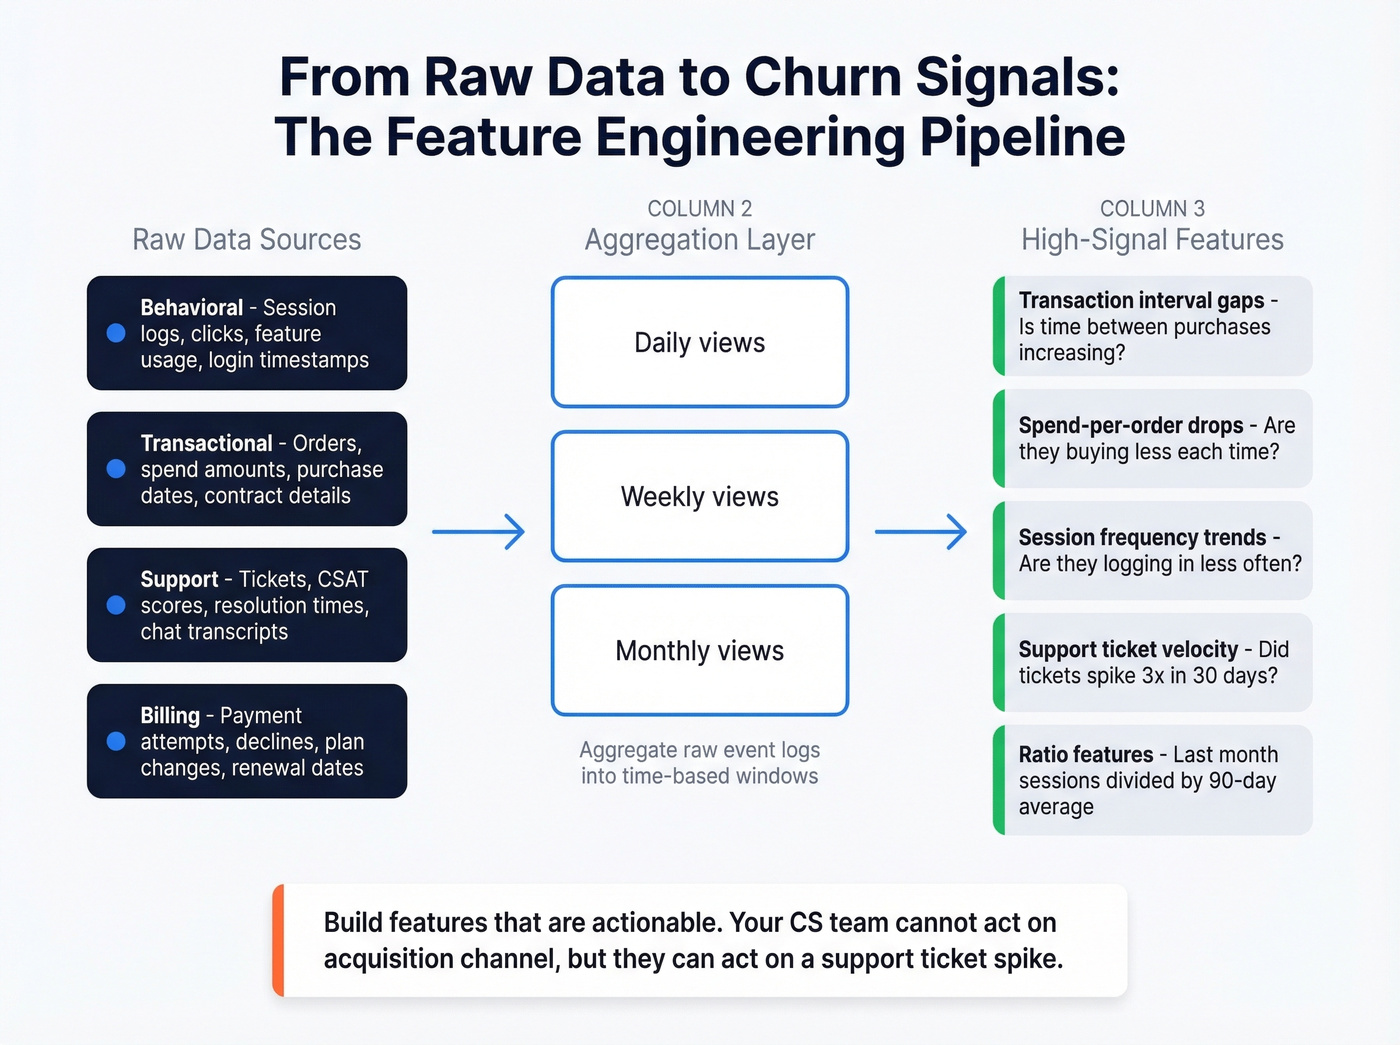
The highest-signal features consistently include transaction interval gaps (is the time between purchases increasing?), spend-per-order drops (are they buying less each time?), and session frequency trends (are they logging in less often?). These are all trend features - not snapshots.
Aggregate raw event logs into daily, weekly, and monthly views, then derive ratios and trend features from those aggregations. A customer's average session count last month isn't very predictive on its own. The ratio of last month's sessions to their 90-day average? That's a signal.
From telco churn datasets, the classic predictive features are tenure, monthly charges, contract type, and service add-ons. Churners tend to have shorter tenure, higher monthly charges, and month-to-month contracts. These patterns translate across industries.
One critical distinction: build features that are actionable. "Customer signed up via organic search" might predict churn, but your CS team can't do anything with it. "Support tickets increased 3x in the last 30 days" gives them something to act on. And watch for concept drift - retrain quarterly at minimum, and increase cadence if precision or recall drops more than 10% between cycles.
Which Algorithm to Use
| Algorithm | Best For | Interpretability | Performance | Complexity |
|---|---|---|---|---|
| Logistic Regression | Starting point | High | Baseline | Low |
| Random Forest | Balanced accuracy | Medium | Good | Medium |
| XGBoost/LightGBM | Best tabular perf | Medium (w/ SHAP) | Highest | Medium-High |
| Neural Networks | Unstructured data | Low | Rarely better | High |
| Survival Analysis | Time-to-churn | Medium | Context-dependent | Medium |
Start with logistic regression. It's interpretable, fast to iterate, and gives your stakeholders something they can actually understand. Graduate to XGBoost or LightGBM when you need better performance on tabular data - gradient boosting is consistently a top performer on structured churn datasets. Neural networks are rarely worth the complexity here; your data is tabular, not images or text.
Use survival analysis when timing matters more than a binary prediction. "This customer has a 70% chance of churning" is useful. "This customer has a 70% chance of churning within 45 days" is more useful for planning interventions.
Evaluating Your Model
Accuracy is a garbage metric for churn models. If 95% of your customers don't churn in a given month, a model that predicts "no churn" for everyone achieves 95% accuracy while being completely useless.
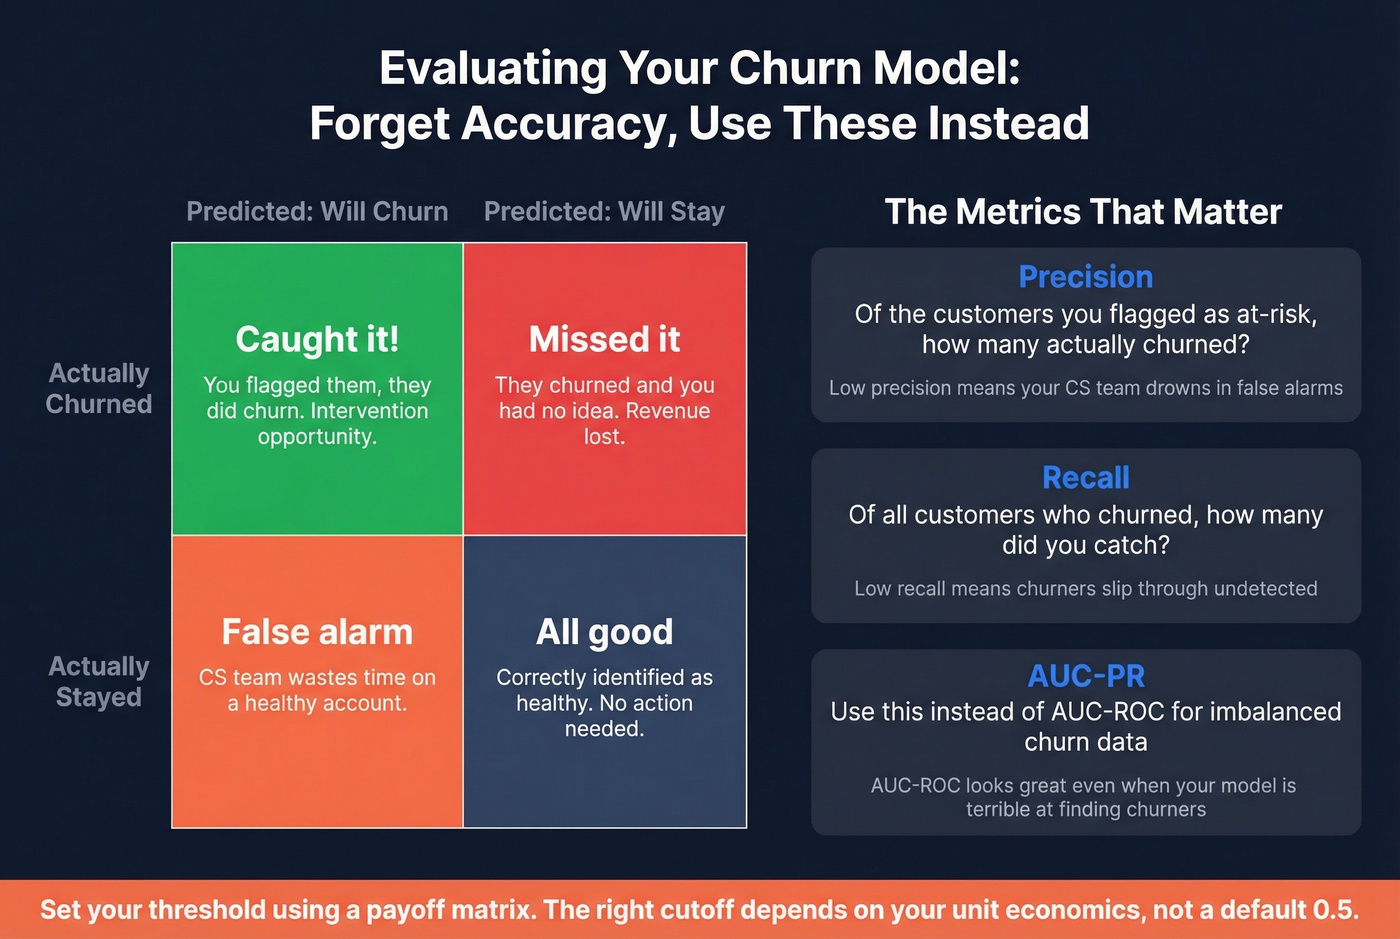
What matters is the tradeoff between precision (of the customers you flagged as at-risk, how many actually churned?) and recall (of all the customers who churned, how many did you catch?). Use AUC-PR instead of AUC-ROC for imbalanced churn data. AUC-ROC can look great even when your model is terrible at identifying the minority class.
Build a payoff matrix to set your threshold. What's the cost of a false positive - CS time wasted on a healthy account? What's the cost of a false negative - a churned account you could've saved? The right threshold depends on your unit economics, not on some default 0.5 cutoff.
Your churn model is only as good as the data feeding it. Dirty CRM records poison predictions. Prospeo enriches your CRM with 50+ verified data points per contact at a 92% match rate - so your churn scores reflect reality, not stale fields.
Clean data in, accurate churn predictions out. Start enriching today.
Why Models Fail in Production
This is where most tutorials stop and most real-world projects fall apart. The case from our intro isn't hypothetical - it keeps showing up in practitioner discussions on r/datascience.
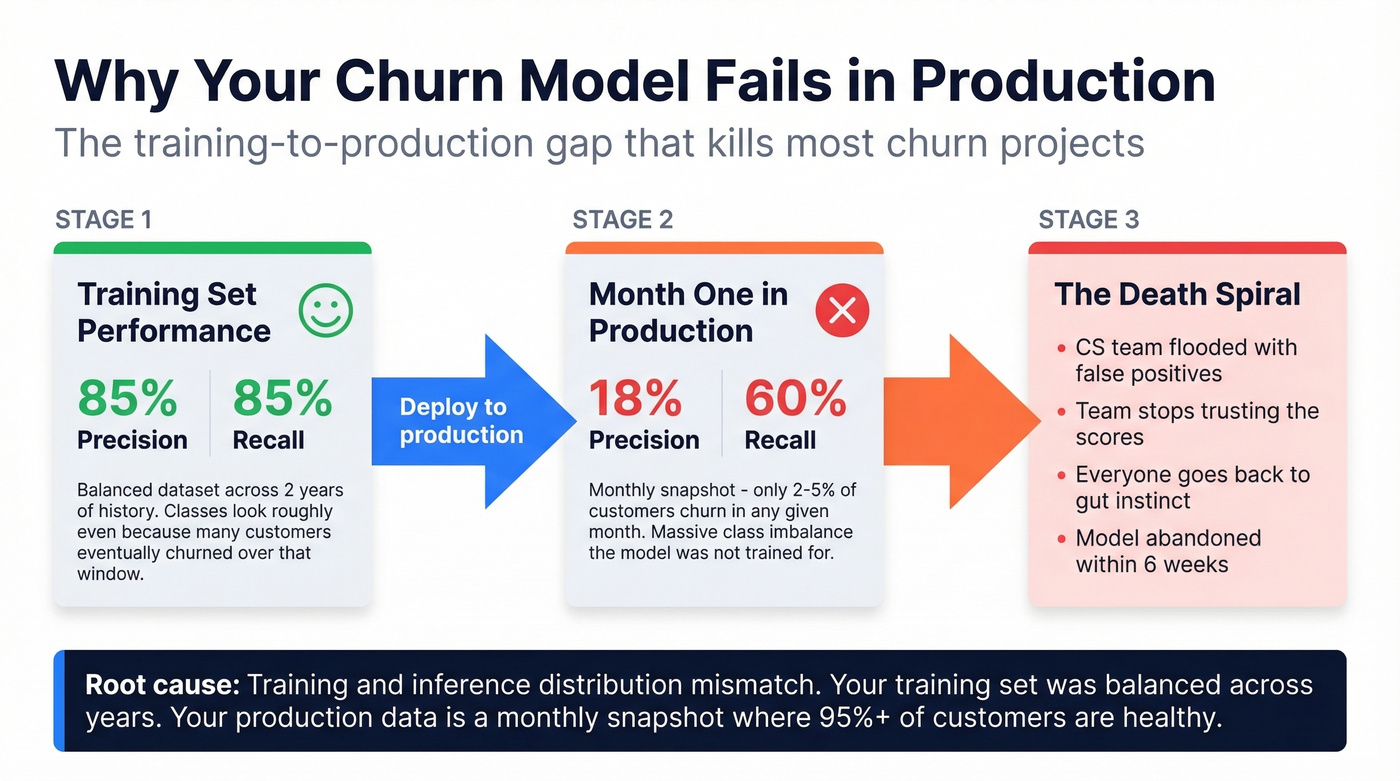
A team builds a model. Test set performance: 85% recall, 85% precision. They deploy it. Month one: 60% recall, 18% precision. The model went from catching most churners with few false alarms to flagging nearly everyone while missing real churners.
The root cause is a training/inference distribution mismatch. The training set was "balanced" across two years of customer history - over that window, a large percentage of customers eventually churned, making the classes look roughly even. But in production, you're scoring current active users where only 4-5% churn per month. The model was trained on one distribution and deployed against a completely different one.
It gets worse. Monthly scoring on nearly the same active user base carries forward prior false positives. If a customer's behavior doesn't change much month-to-month, the model keeps flagging them, and your CS team keeps ignoring the alerts. Trust erodes fast.
Other production killers: data leakage (using future information during training that won't be available at prediction time), concept drift (customer behavior shifts but the model doesn't), and the longitudinal framing problem - training only on "final states" of user journeys makes it impossible to capture seasonality without introducing leakage.
10 Mistakes That Kill Models
No stakeholder buy-in. You build a model nobody asked for. CS leadership wasn't involved in defining "at-risk." The scores sit in a dashboard nobody checks.
Wrong prediction point. You didn't define when the prediction happens relative to the churn event. Features leak future information, or the horizon doesn't match your intervention timeline.
Cross-sectional training. One snapshot per customer instead of multiple time points per journey. You lose temporal patterns and introduce survivorship bias.
Non-actionable features. The model's top predictor is "signup channel." Your CS team can't change that. Build features they can respond to.
Optimizing AUC over LogLoss. AUC measures ranking. LogLoss measures calibration - whether your 70% probability actually means 70%. Calibrated probabilities matter for threshold-setting.
No payoff matrix. You're using 0.5 as your cutoff because it's the default. The right threshold depends on the relative cost of false positives vs false negatives.
No interpretability. CS reps need a reason to call - "usage dropped 60% and they filed 3 tickets last week" beats "the model says so."
No drift detection. You deployed the model and walked away. Six months later, precision has cratered because the product changed.
No retraining policy. Who owns retraining? What triggers it? If the answer is "nobody" and "nothing," the model has an expiration date.
Treating the model as autonomous. The model prioritizes accounts for human review. It doesn't replace judgment. The most successful implementations use models for prioritization and planning, not as process substitutes.
What to Do With Churn Scores
The hardest part isn't building the model. It's building the action playbook. The #1 question on r/datascience about customer attrition models isn't "which algorithm?" - it's "what do we actually do with these probabilities?"
Segment your scored accounts into three groups:
High-risk saves are customers with 70%+ churn probability who have enough lifetime value to justify intervention - executive escalation calls, personalized retention offers, dedicated CSM attention. Borderline persuadables sit in the 30-70% range and represent your highest-ROI targets because they're genuinely on the fence. Targeted content, check-in sequences, and proactive feature education can tip them back. Low-risk upsell candidates below 30% are healthy customers you should be expanding, not worrying about.
Tie your thresholds to the payoff matrix from your model evaluation. If saving one enterprise account is worth $50K in ARR, you can afford more false positives in that segment. If your average account is $200/month, you need tighter precision to avoid drowning your CS team. Well-run retention programs that combine predictive scoring with structured intervention playbooks typically achieve 5-15% relative churn reduction within 6-12 months.
But there's an operational gap that undermines even the best models. Your CS team gets a list of 500 high-risk accounts. They start making calls. 40% of phone numbers are disconnected. 25% of emails bounce. The model worked perfectly - your contact data didn't.

This is where data quality meets retention execution. Prospeo verifies emails at 98% accuracy on a 7-day refresh cycle, so when your save team reaches out to flagged accounts, they're actually connecting with the right people - not bouncing into the void.
Tools and Platforms
Predictive Platforms
| Tool | Focus Area | Starting Price | Free Trial |
|---|---|---|---|
| Zendesk | Support + sentiment | $25/agent/mo | 14-day |
| Pecan | No-code ML | $950/mo | 7-day |
| Gainsight | CS platform | ~$2,500-$10K+/mo | Demo only |
| ChurnZero | CS + health scores | ~$1,500-$5K+/mo | Demo only |
| Amplitude | Product analytics | Free tier available | Free tier |
| Vitally | CS for SMB SaaS | ~$500-$2K+/mo | Demo only |
| Baremetrics | Subscription metrics | $49/mo | - |
The buy-vs-build decision depends on your customer base size and data maturity. Under 10,000 customers, start with product analytics (Amplitude's free tier is genuinely useful) plus a logistic regression model before committing to a platform. Pecan is the strongest option for teams that want ML-grade predictions without a data science team - $950/month is steep for a startup but reasonable for a mid-market company losing more than that in monthly churn.
Skip Gainsight and ChurnZero unless you're already running one of them as your CS platform. They're full customer success suites with predictive scoring as one feature among many. If you're buying specifically for attrition forecasting, they're overkill. And if your average deal size is under $10K, you probably don't need a dedicated platform at all - a well-built spreadsheet model and clean data will get you 80% of the way there.
Dunning and Recovery Tools
| Tool | Starting Price | Key Feature |
|---|---|---|
| ChurnBuster | $249/mo | ~50% median recovery |
| ChurnKey | $250/mo | Cancel flow + dunning |
| ProsperStack | $200-$750/mo | Cancel flow optimization |
Involuntary churn is a completely separate problem from predictive modeling. It's not dissatisfaction - it's payment failures, expired cards, and billing glitches. ChurnBuster reports median recovery rates around 50%, with top performers hitting 80-90%+. If you're a subscription business and haven't optimized your dunning flows, this is the highest-ROI churn investment you can make - before you even touch predictive modeling.
Identifying Key Risk Signals
Before you can build an effective model, you need to know which risk signals actually matter for your business. Not every behavioral change indicates risk - some customers naturally have seasonal usage patterns, and flagging every dip creates noise that buries real warnings.
In our experience, the most reliable signals fall into three categories: engagement decay (login frequency drops, feature usage narrows), support escalation (ticket volume spikes, sentiment turns negative), and commercial pullback (downgrades, delayed payments, reduced seat count). Map these signals to your specific product and customer journey before engineering features around them.
Getting Started
Here's a practical roadmap that won't take six months to execute.
Step 0: Audit and clean your CRM data. This is the prerequisite everything else depends on. Enrich missing fields, verify contact information, and fill gaps in your account records. Prospeo's enrichment API returns 50+ data points per contact at a 92% match rate - clean data in, clean predictions out.
Step 1: Define churn for your business. Is it contract non-renewal? 90 days of inactivity? Revenue downgrade below a threshold? Get stakeholders to agree on one definition before you write a single line of code. (If you need a baseline, start with our guide on what churn is.)
Step 2: Pick a prediction point and forecast horizon. When does the model score? How far ahead does it predict? Match the horizon to your intervention timeline - a 90-day forecast gives your CS team time to act.
Step 3: Build features from behavioral and transactional data. Focus on trend features and actionable signals. Session frequency drops, support ticket spikes, usage pattern changes.
Step 4: Train a simple model. Logistic regression. Evaluate with AUC-PR and a payoff matrix. Resist the urge to jump to XGBoost until you've proven the simple model adds value. (For a broader view, see B2B predictive analytics.)
Step 5: Build the action playbook before deploying. Define segments, thresholds, intervention types, and ownership. If your CS team doesn't know what to do with the scores, the model is worthless.
Step 6: Monitor, retrain quarterly, iterate. Track precision and recall in production. Watch for drift. Treat the model as a living system, not a one-time project. If you want a deeper framework, start with churn analysis.
Predicting churn means nothing if your save team can't reach at-risk accounts. Prospeo delivers 98% accurate emails and 125M+ verified mobile numbers with a 30% pickup rate - so intervention campaigns actually connect.
Stop losing saves to bounced emails and dead phone numbers.
FAQ
What's the difference between customer churn and revenue churn?
Customer churn counts lost accounts regardless of size; revenue churn measures lost dollars - far more meaningful when account values vary. A company losing ten $50/month accounts faces a completely different problem than one losing a single $5,000/month account, even if the customer count looks identical.
Which algorithm works best for churn prediction?
Start with logistic regression for interpretability and fast iteration, then graduate to XGBoost or LightGBM for better tabular performance. Use survival analysis when you need time-to-event predictions ("70% chance of leaving within 45 days") rather than binary classification.
How often should you retrain a model?
Quarterly is a solid default for most SaaS businesses. Monitor precision and recall between cycles - if either metric drops more than 10%, increase retraining frequency. Seasonal businesses often need monthly refreshes to capture shifting behavior patterns.
Can you predict churn without a data science team?
Yes. Platforms like Pecan ($950/mo) offer no-code ML, and Amplitude's free tier provides solid product analytics. Pair either with clean, enriched contact data and a structured health-score framework in your CS platform - you'll cover 80% of what a custom model delivers.
What's a good churn rate for SaaS?
Below 5% annually is healthy for B2B SaaS; top performers stay under 3%. Monthly churn above 1% compounds to roughly 11.4% annual attrition, which erodes your customer base faster than most teams realize - making predictive intervention essential at that threshold.