Cold Email Open Rate Benchmarks: What the Data Actually Says in 2026
You're staring at a 52% open rate on a cold list of 3,000 contacts. Feels great - until you realize half those "opens" are Apple proxy servers preloading tracking pixels on emails nobody read. That's the problem with every cold email open rate benchmark you've seen: the number is a mirage, and you're making decisions based on it.
The Short Version
Realistic B2B cold email open rate: 25-45%, with 35% as a solid midpoint. Open rate is half-broken - Apple MPP can inflate numbers by up to 75% in some segments. Reply rate is the metric you can trust. And if your bounce rate is above 2%, none of this matters because your domain reputation is already eroding.
Benchmarks by Source
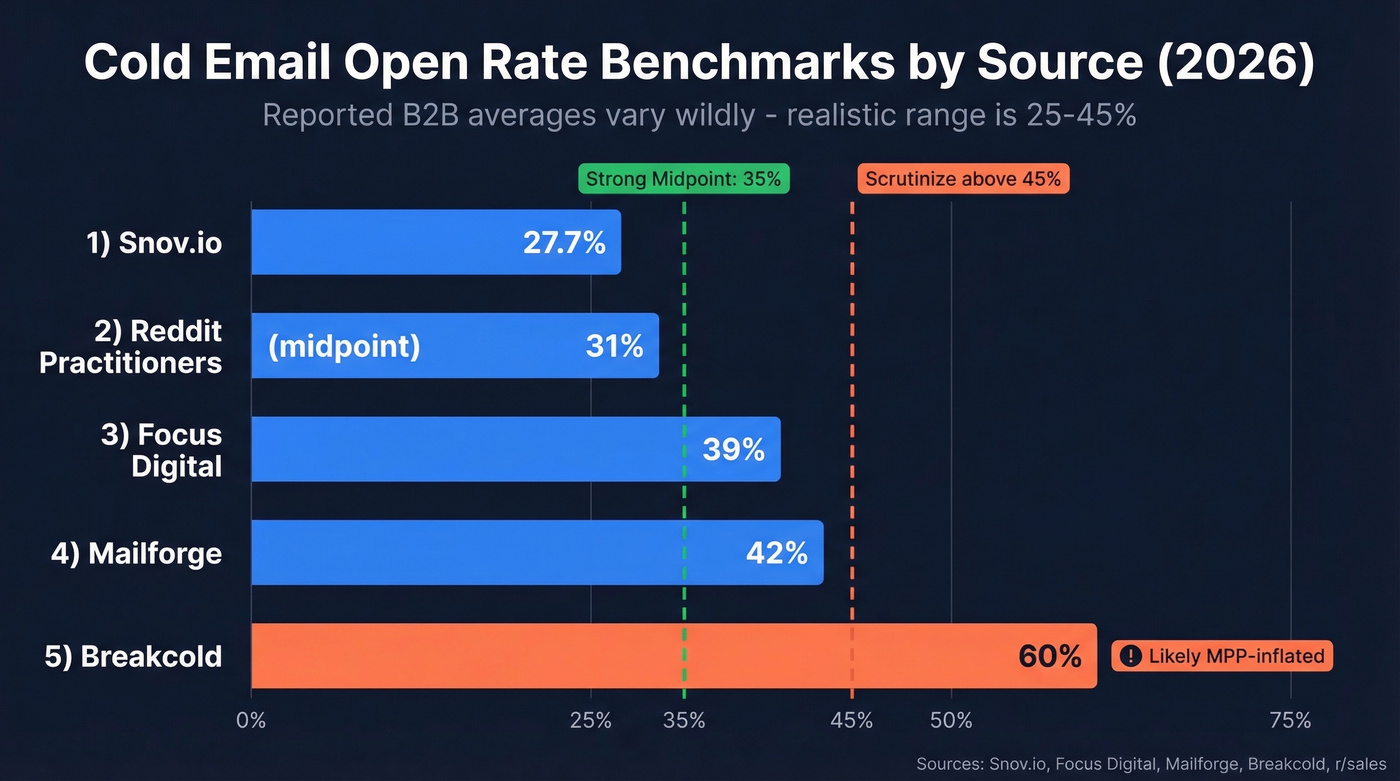
Every vendor publishes a different number. Here's what the major cold email statistics look like across sources:
| Source | Reported Open Rate | Context |
|---|---|---|
| Snov.io | 27.7% | B2B avg across industries |
| Focus Digital | ~39% | Latest available data |
| Mailforge | ~42% (range 40-60%) | 2026 averages |
| Breakcold | 60%+ | Likely MPP-inflated |
| Reddit practitioners | 27-35% | Self-reported, volume varies |
The spread is wild. Our working range: 25-45%, with 35% as a strong midpoint for B2B cold outreach with proper infrastructure. Anything above 45% on a cold list deserves scrutiny - you're probably counting machine opens.
The consensus on r/sales and r/coldemail tends to land around 27-35%, with one high-volume operator noting that even a 1.6% reply rate at 100K+ sends per month can be highly profitable. That tracks with what we've seen across campaigns ourselves.
Open Rates by Industry
| Industry | Focus Digital | Belkins (via Snov.io) |
|---|---|---|
| Energy | 46.31% | - |
| Software/SaaS | 25.71% | 47.1% |
| IT Services | 27.35% | - |
| Banking | - | 19.7% |
| Marketing & Ads | - | 35.7% |
Look at that Software discrepancy - 25.71% vs 47.1%. Same industry, nearly double the number. Dataset size, tracking methodology, and MPP exposure all shift the result dramatically, which is exactly why treating any single benchmark as gospel is a mistake.
Why These Benchmarks Broke
Apple Mail Privacy Protection preloads all images and tracking pixels through proxy servers. The pixel fires whether or not anyone reads your email. This applies even if the mailbox is Gmail or Outlook, as long as Apple Mail is the client.
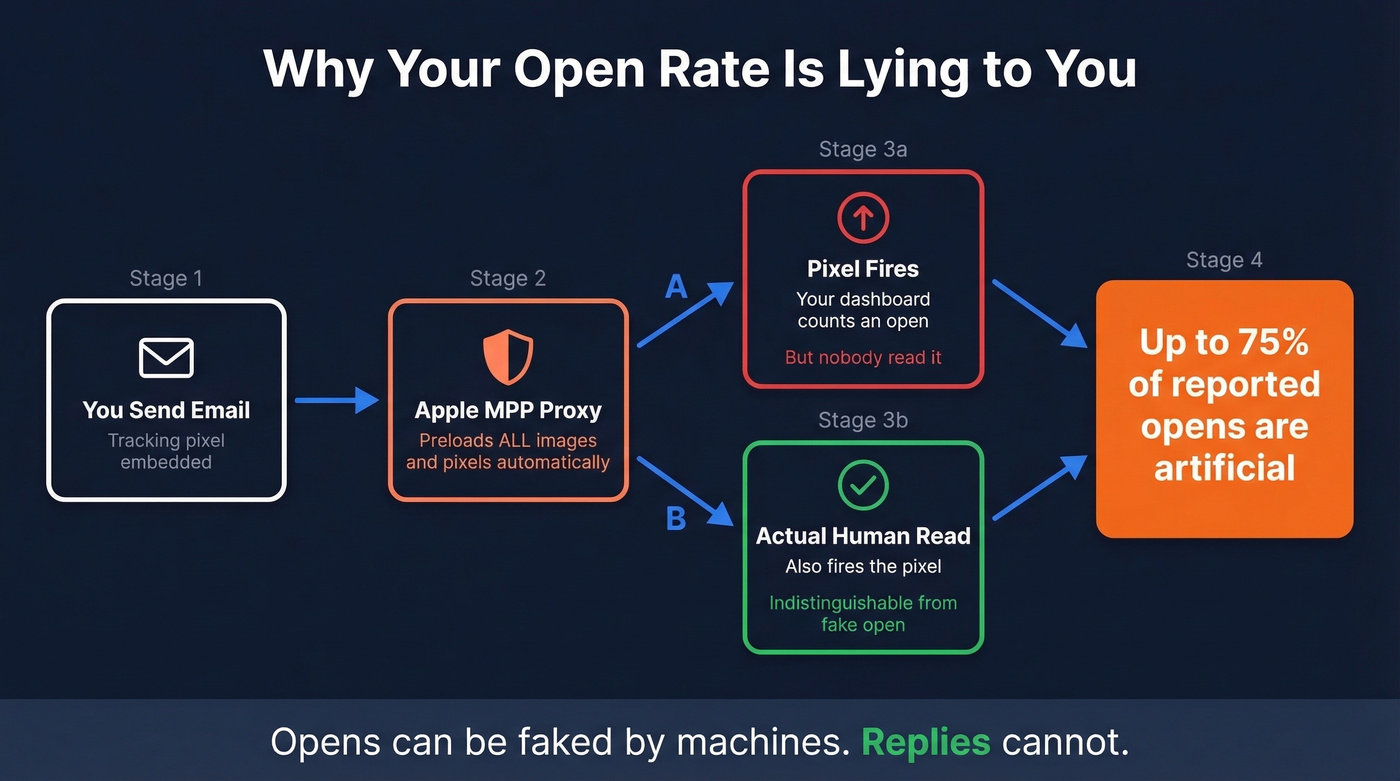
The result: up to 75% of reported opens in some segments are artificial. Open rates can also vary by up to 20 percentage points between Gmail and Outlook recipients in the same campaign, purely from how each provider handles pixel tracking. Opens can be faked by machines. Replies can't.
We've tested this across dozens of campaigns - the real human open rate on a B2B cold list runs 30-50% lower than what your dashboard reports.
Apple MPP inflates opens. Bounces destroy domains. The only metric you control is list quality. Prospeo's 5-step verification delivers 98% email accuracy on a 7-day refresh cycle - so every send hits a real inbox, not a spam trap.
Fix your list before you A/B test another subject line.
The Open Tracking Paradox
Here's the thing most people miss: measuring opens actually kills your reply rate.
Snov.io tested 44 million emails and found campaigns with open tracking disabled had a 2.36% reply rate versus 1.08% with tracking on. That's 2.2x more replies just from killing the pixel.
Open tracking adds an HTML tracking pixel (or forces an HTML version). Spam filters notice. Gmail's image-loading prompts add friction. The very act of measuring opens reduces the replies you actually care about.
Turn off open tracking entirely. You'll lose a vanity metric and gain real responses.
What to Track Instead
Instantly's 2026 benchmark report sets the bar:
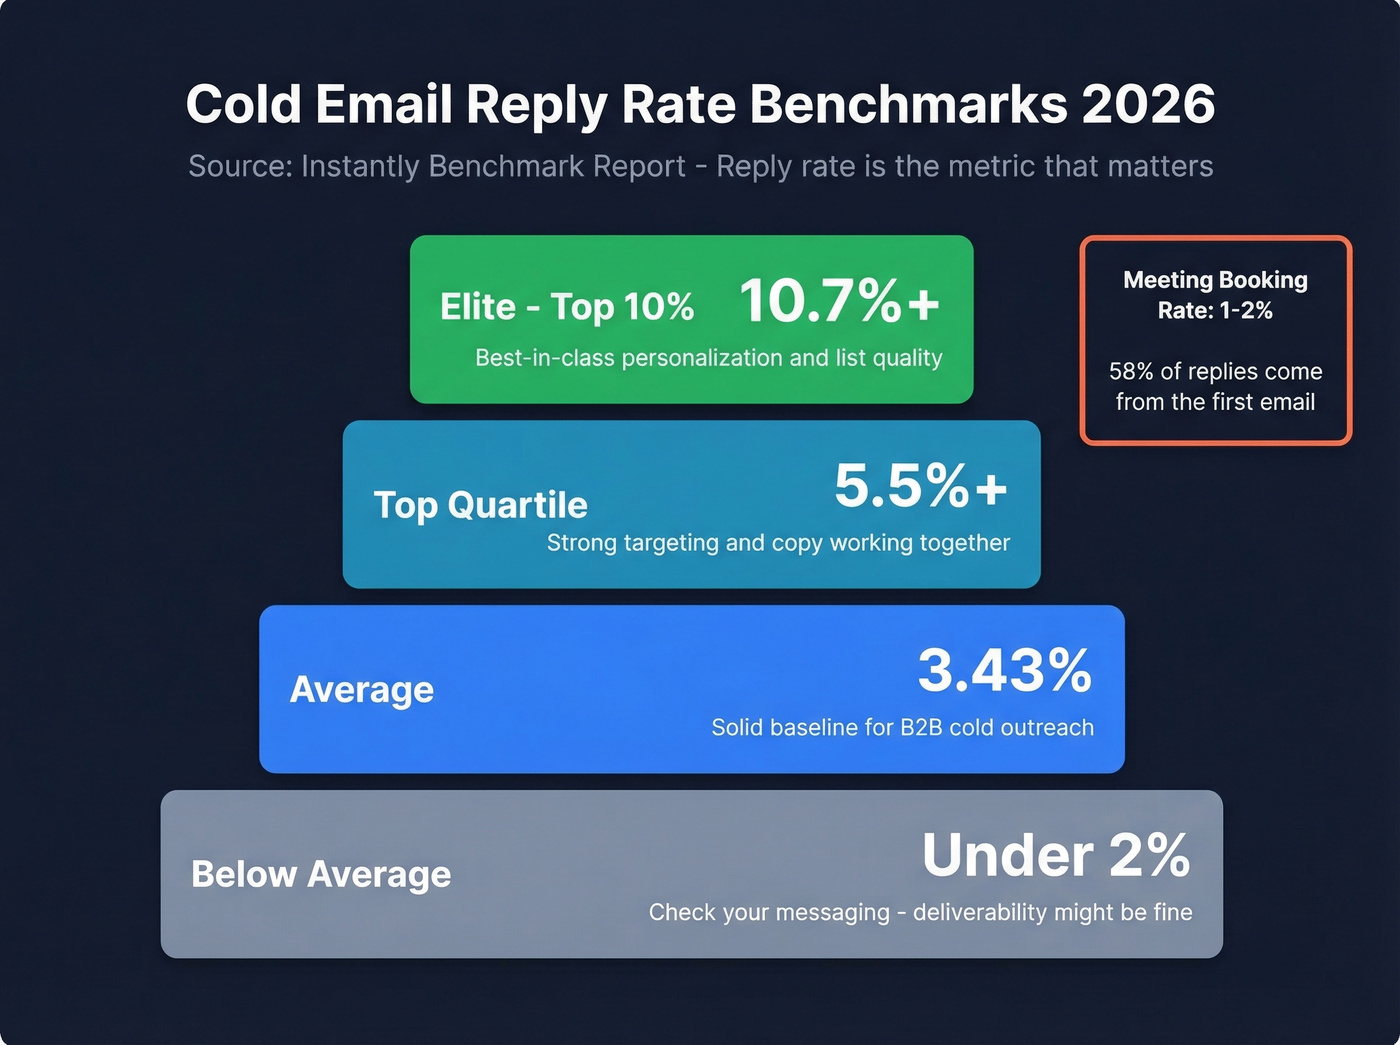
- Average reply rate: 3.43%
- Top quartile: 5.5%+
- Elite (top 10%): 10.7%+
- Meeting booking rate: 1-2%
Mailshake's 2026 survey of 508 outbound professionals corroborates the 1-4% reply rate range. Instantly's data also shows 58% of replies come from the first email - another reason to nail your initial send rather than relying on a five-touch follow-up sequence to do the heavy lifting.
If your open rate is 40%+ but replies are under 2%, your messaging is the problem, not deliverability. Open rate still works as a rough deliverability pulse - below 15% means something's broken - but it's a diagnostic signal, not a KPI.
How to Improve Your Numbers
Focus Digital's data shows "Hi {{first_name}}" pulls a 45.36% open rate versus "Quick question" at 36.45%. Personalized, lowercase, conversational subject lines consistently outperform clever or salesy ones.
If you need a starting point, pull from proven subject lines and iterate from there.
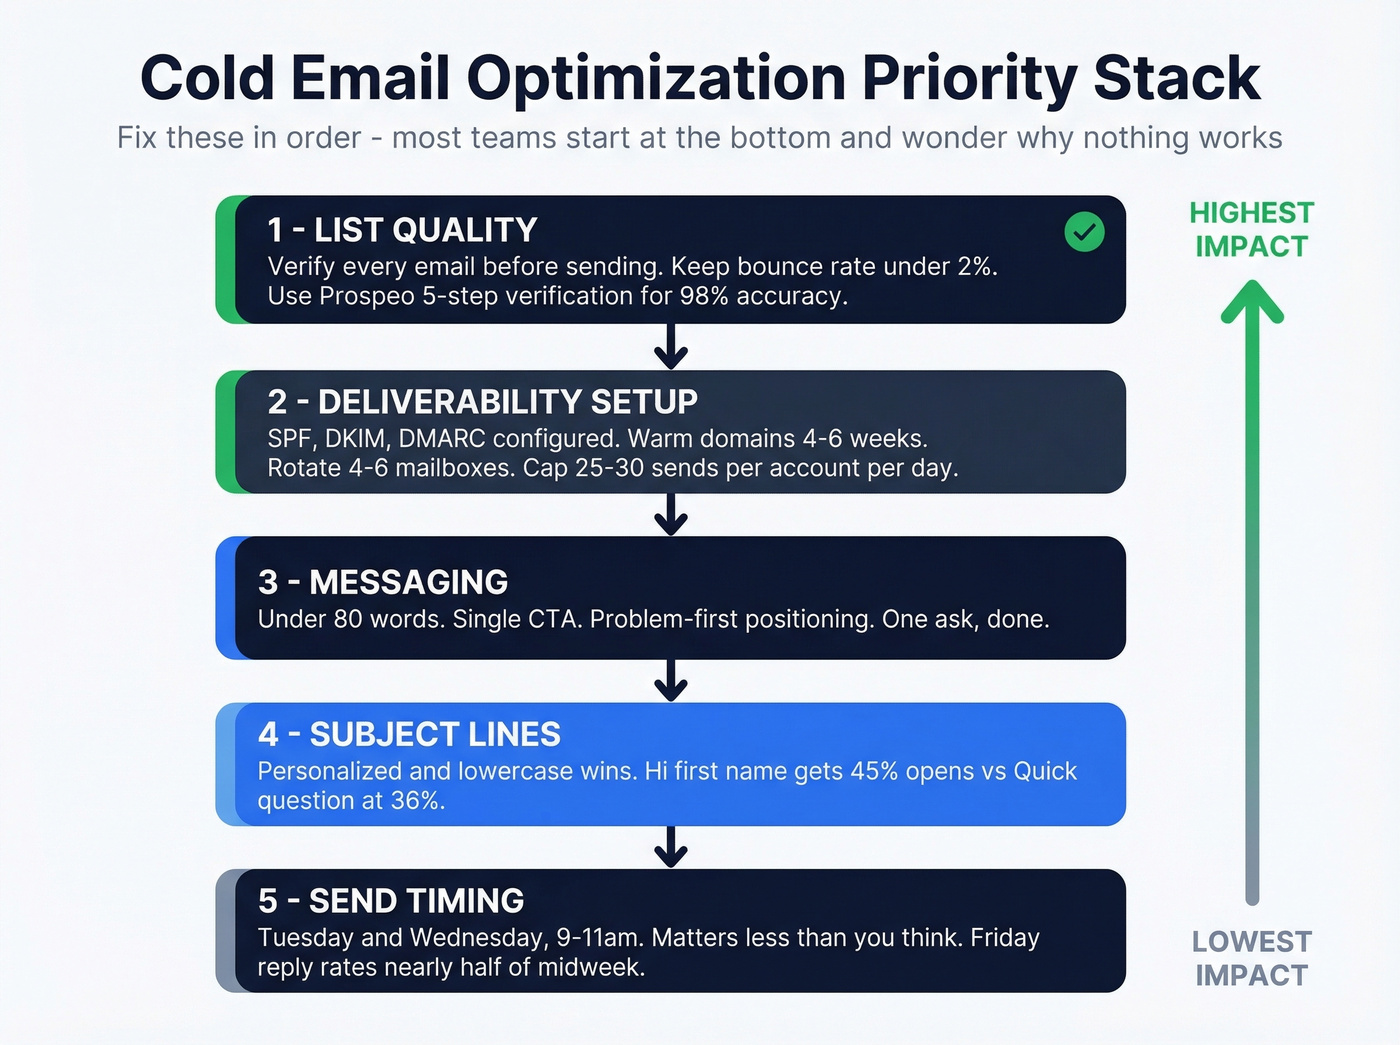
Deliverability setup is table stakes. SPF, DKIM, and DMARC must be configured correctly. Warm new domains from 5-10 sends per day up to 150+ over 4-6 weeks. Use 4-6 rotating mailboxes and cap 25-30 sends per account per day. (If you want a deeper framework, start with an email deliverability guide and then tighten your email velocity.)
Send timing matters less than you think. Tuesday and Wednesday tend to perform best, late morning around 9-11am is a common strong window, and Friday reply rates can be almost half of midweek. But timing won't save bad copy or a dirty list. If you're optimizing schedules, use a data-backed best time to send cold emails playbook.
Keep emails under 80 words with a single CTA. Problem-first positioning, one ask, done. For examples, borrow structures from emails that get responses and keep your ask tight with a clear email call to action.
List Quality Is the Root Cause Most Teams Ignore
If your bounce rate exceeds 2%, your domain is slowly dying. Every bounced email signals to inbox providers that you're sending to garbage addresses, and that damage compounds with every campaign. Teams with clean deliverability infrastructure see 15-25% more replies without changing a word of copy.
We've seen teams obsess over A/B testing subject lines while sending to lists with 8% bounce rates. That's like optimizing the paint job on a car with no engine.
This is where email verification matters more than subject line testing. Prospeo runs a 5-step verification process - catching invalid addresses, spam traps, and honeypots - with 98% accuracy and a 7-day data refresh cycle. If you're diagnosing issues, start with email bounce rate benchmarks and fixes, then consider tooling like Bouncer alternatives to compare options. Stack Optimize used Prospeo to maintain 94%+ deliverability and sub-3% bounce rates across all client campaigns while scaling to $1M ARR. Fix the list first. Everything else is optimization on top of a broken foundation.

Stack Optimize scaled to $1M ARR with sub-3% bounce rates across every client campaign using Prospeo. At ~$0.01 per verified email, cleaning your list costs less than a single bounced send costs your domain reputation.
Stop optimizing copy on top of a dirty list.
FAQ
What's a good cold email open rate benchmark in 2026?
25-45% is the realistic range, with 35% as a strong midpoint for B2B outreach. Anything above 50% on a cold list likely includes artificial opens from Apple MPP. Focus on reply rate - 3.4% average, 5.5%+ top quartile - as your primary performance metric instead.
Does open rate even matter anymore?
As a deliverability diagnostic, yes. Below 15% signals infrastructure problems like missing SPF/DKIM or spam folder placement. As a primary KPI, no. Reply rate is the only engagement metric proxy servers can't fake, making it far more reliable for campaign optimization.
How can I reduce bounce rates on cold campaigns?
Keep bounces under 2% by verifying every address before sending. Prospeo's 5-step verification catches invalid emails, spam traps, and honeypots at 98% accuracy. Teams switching from unverified lists typically see bounce rates drop from 8-10% to under 3%, which directly improves inbox placement and reply rates.