CRM Business Intelligence: Architecture, Dashboards, and Governance for Revenue Teams
It's Monday morning. The VP of Sales says pipeline is $4.2M. RevOps pulls the same CRM data and gets $3.1M. The CFO's spreadsheet shows $2.8M. Three numbers, one CRM, zero trust. The forecast meeting turns into a debate about whose filters are right, and nobody talks about actual deals.
That's what happens when CRM business intelligence is broken - not because the dashboards are ugly, but because the data underneath them is stale and nobody agreed on what "pipeline" means.
What You Need (Quick Version)
CRM BI isn't a tool you buy. It's an operating system where your CRM captures activity, a governed data model defines metrics, and a BI layer surfaces decisions. Most projects fail because of stale data and undefined metrics, not bad dashboards. This guide gives you the architecture, the KPI bundles, and the governance cadence to make it work.
What CRM BI Actually Means
Stop asking "do we need BI or CRM?" That's the wrong question. Ask "who owns the metric definitions?"
CRM business intelligence is the feedback cycle between your CRM - where reps log activity - your BI layer - where leaders analyze outcomes - and a governed data model that ensures both sides speak the same language. The CRM captures inputs. BI produces outputs. The connection between them needs one owner per metric so your Monday forecast meeting doesn't turn into a philosophy debate. The entire point is to turn raw CRM data into actionable knowledge - not just charts, but insights that change how reps sell and how leaders allocate resources.
| Dimension | CRM | BI | CRM BI (the goal) |
|---|---|---|---|
| Primary role | Capture activity | Analyze outcomes | Close the loop |
| Data scope | Customer interactions | Multi-source | CRM + finance + product |
| Metric ownership | Often undefined | Often duplicated | One owner per metric |
| Freshness | Real-time (as logged) | Batch (hourly/daily) | Matched to decisions |
| Typical failure | Starts empty - no process | Starts full - no action | Bad data + no governance |
Most teams already have both a CRM and some form of analytics. What they don't have is the governed connection between them. Until someone owns the definition of "qualified pipeline," every dashboard is a lie.
How the Architecture Works
The modern CRM BI pipeline follows five stages: Source, Ingest, Store, Transform, Consume. Your CRM - whether Salesforce, HubSpot, or Pipedrive - is one source among many. Finance data, product usage, and support tickets all feed in.
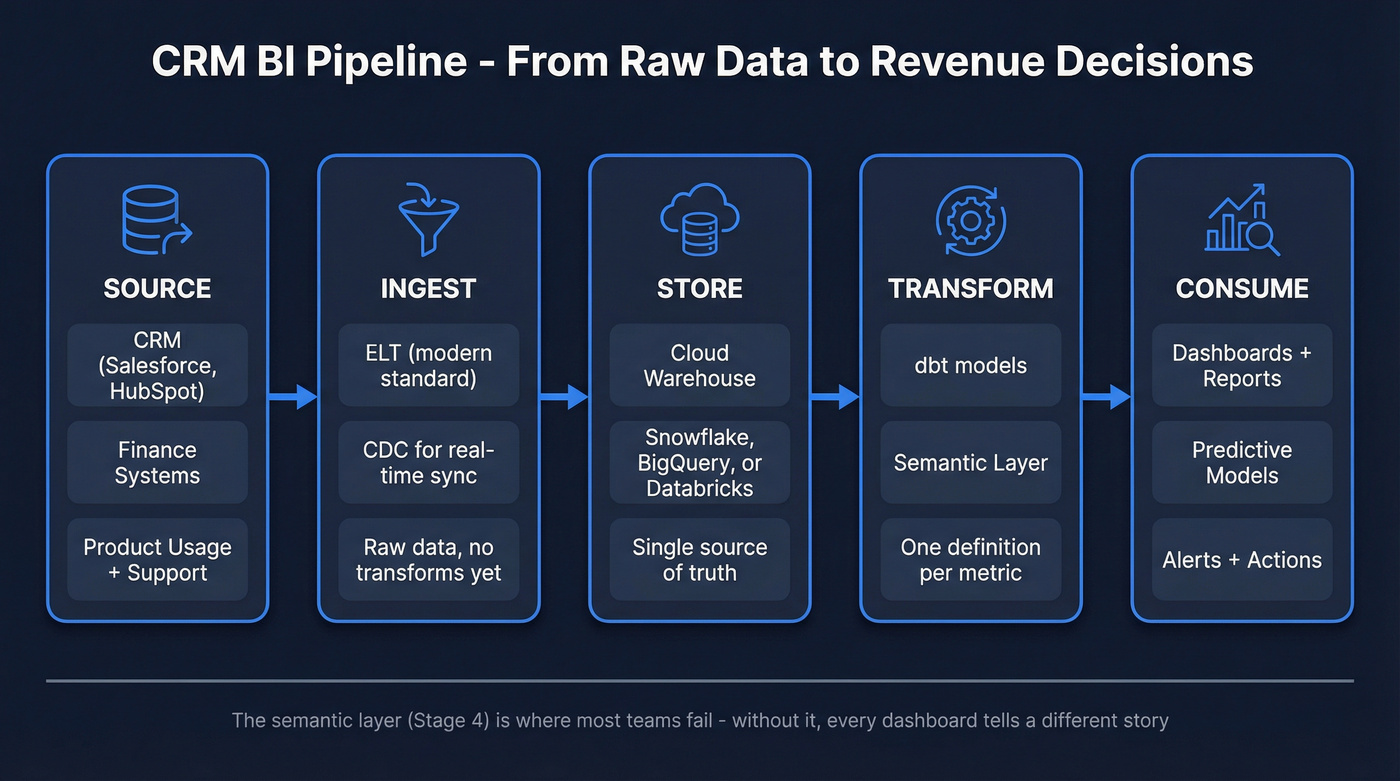
Ingestion moves data into a central warehouse. ELT (extract, load, then transform) is the modern standard. You dump raw data into a cloud warehouse like Snowflake, BigQuery, or Databricks, then transform it in place using tools like dbt. The old ETL approach still works for compliance-heavy environments, but ELT gives you more flexibility and faster iteration.
For freshness, change data capture (CDC) streams updates as they happen in your CRM rather than waiting for nightly batch jobs. If a rep moves a deal to "Closed Won" at 2pm, your pipeline dashboard reflects it within minutes - not tomorrow morning.
The piece most teams skip is the semantic layer - a centralized definition of every metric. "Pipeline" means one thing. "Win rate" has one formula. Without this, you get the Monday morning problem. dbt's semantic layer or Looker's LookML can enforce this, but even a shared Google Sheet with metric definitions beats nothing.
Here are the integration patterns worth knowing:
- ELT - load raw, transform in-warehouse. Best for most teams. Flexible, cost-effective.
- ETL - transform before load. Better for regulated industries needing cleansed data before it hits the warehouse.
- Data virtualization - query without moving data. Sounds elegant, chokes on complex joins.
- Streaming - Kafka, Kinesis. Useful when delayed data costs money.
For most revenue teams, ELT into a cloud warehouse with dbt transformations and a BI tool on top is the right architecture. Don't overcomplicate it.
Dashboards That Drive Decisions
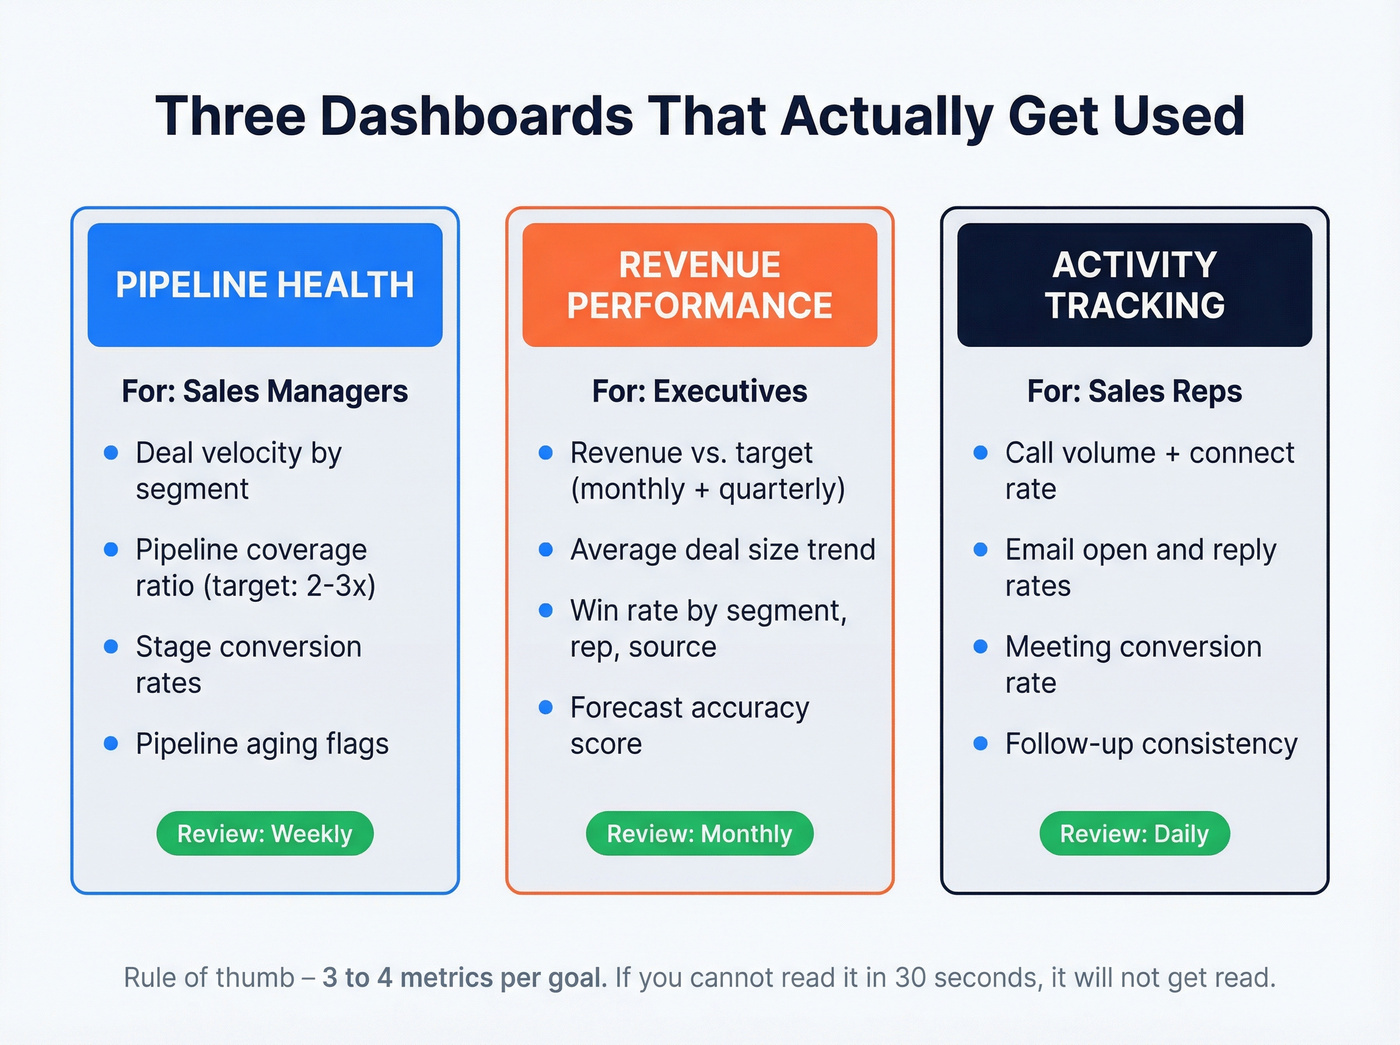
Dashboards are where CRM BI either earns trust or loses it. Salesforce's guidance is right: stick to three or four metrics per goal. Fewer dashboards with clear owners and weekly action loops is maturity. Twelve dashboards nobody checks is waste.
Pipeline Health (Manager View)
This is your operating dashboard. Managers need deal velocity broken by segment, pipeline coverage ratio (2-3x is healthy for most B2B), stage conversion rates showing where deals stall, and pipeline aging that flags deals sitting longer than your average cycle length. If pipeline coverage drops below 2x, you don't need a meeting to know there's a problem - the dashboard should make that obvious in five seconds.
Revenue Performance (Exec View)
Executives need the "are we going to hit the number" dashboard. That means revenue vs. target on monthly and quarterly views, average deal size trending over time, win rate by segment, rep, and source, plus forecast accuracy showing how close last quarter's forecast was to actual.
We've seen teams add 15 metrics to the exec dashboard. Don't. If the CEO can't read it in 30 seconds, it won't get read.
Activity Tracking (Rep View)
Here's the thing: the rep dashboard isn't about surveillance. It's about showing reps which activities actually correlate with their closed deals, so they do more of what works. That means surfacing call volume alongside connect rate, email open and reply rates, meeting conversion from scheduled to completed, and follow-up consistency measured as average time between touchpoints.
Once reps see the correlation between their activity patterns and closed revenue, the dashboard sells itself. The best post-integration action is automated follow-up triggers based on these activity signals - reps who act on them consistently outperform those who don't.
Every CRM BI failure starts with the same root cause: stale, incomplete contact data. Prospeo enriches your CRM with 50+ data points per contact at a 92% match rate - refreshed every 7 days, not every 6 weeks. Clean data in, trustworthy dashboards out.
Stop debugging dashboards. Start fixing the data underneath them.
Predictive Analytics Use Cases
Once your foundation is solid, predictive models become practical.
The highest-value use case is churn prediction. A study published in Nature tested a Random Forest model on a telecom dataset of 2,668 CRM records with a 14.6% churn rate and achieved 95.13% accuracy with a 0.89 AUC. The top predictors were total day minutes, total day charge, and customer service calls - all data points sitting in most CRMs already.
The practical challenge is class imbalance. If only 15% of customers churn, a naive model hits 85% accuracy by predicting "no churn" every time. Techniques like SMOTE and class weighting fix this, but you need a data team that understands the nuance.
Beyond churn, the use cases that deliver fastest ROI are forecast modeling weighted by stage and historical conversion, next-best-action recommendations for reps, and lead scoring that ranks inbound leads by likelihood to close. All of these depend on clean, complete CRM data - which brings us to the real bottleneck.
Why CRM BI Fails (And the Fix)
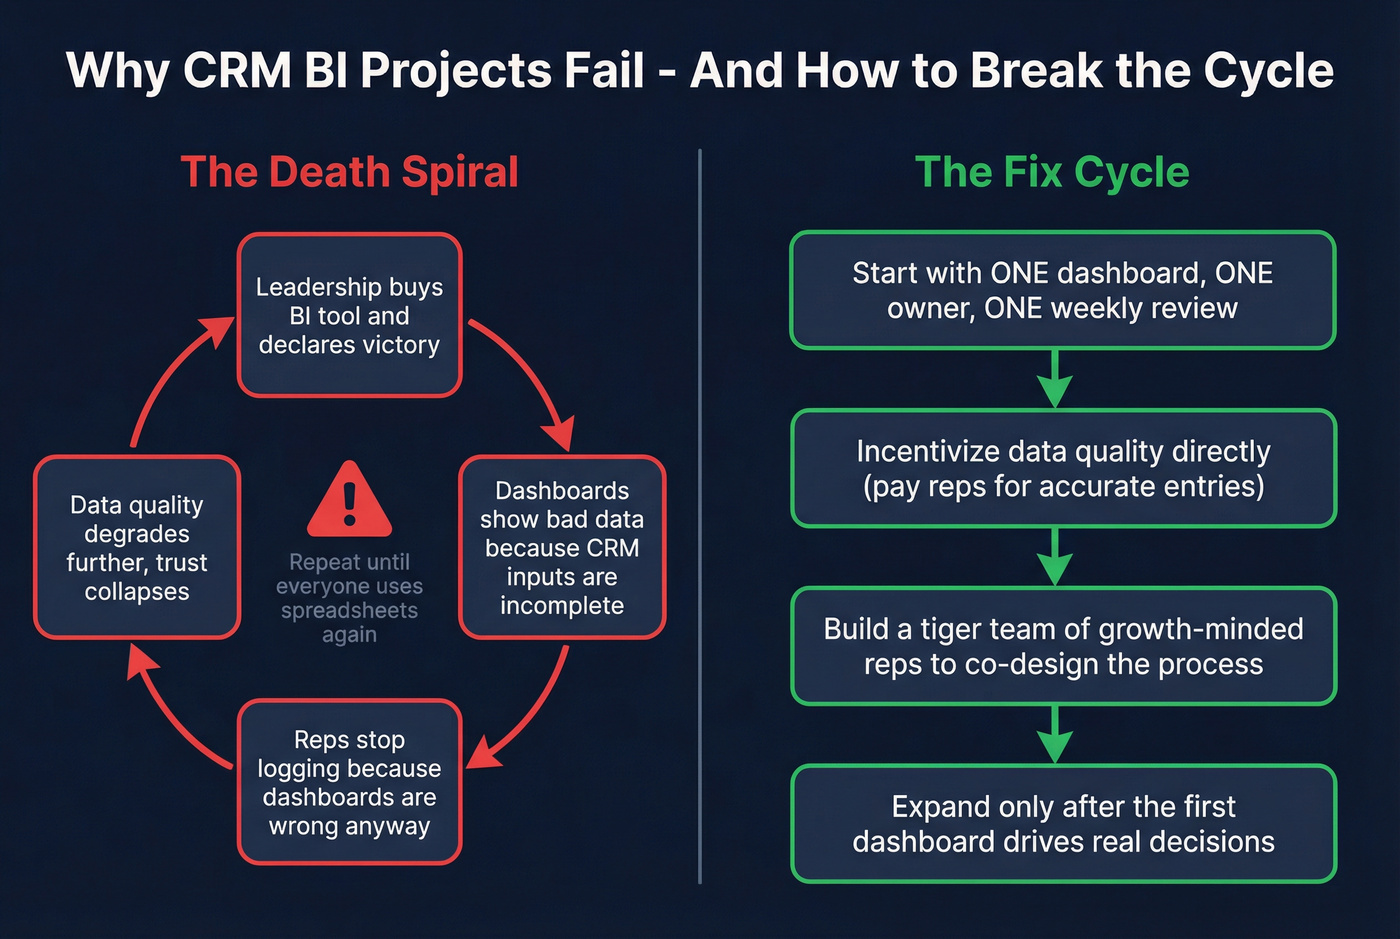
The failure pattern is predictable. Leadership buys a BI tool, connects it to the CRM, builds dashboards, and declares victory. Six months later, reps have stopped logging activities because "the dashboards are wrong anyway." The dashboards are wrong because reps stopped logging. Death spiral.
SparxIQ's framework nails the four pitfalls:
- "We turned it on - now it works." A tool isn't adoption. CRM starts empty; you have to define the process, the fields, and the expectations before anything useful comes out.
- One-and-done training. A two-hour onboarding session doesn't change behavior. Bite-sized workflow training over months does.
- No feedback loop. If nobody inspects the data and corrects old habits, the system degrades silently.
- Not involving frontline users. Build a tiger team of growth-minded reps who help design the process. If reps feel the system was done to them, they'll resist it.
The fix requires discipline, not complexity. Set your top three priorities for the first 6-12 months. Start simple - one dashboard, one owner, one weekly review cadence. Expand only after the first dashboard drives real decisions.
And incentivize data quality directly. One team we worked with paid reps $1 per accurate new email address entered into the CRM. Sounds trivial. It transformed their data completeness in a quarter.
Let's be honest: most teams don't have a BI problem. They have a data entry problem wearing a BI costume. Fix the inputs before you buy another dashboard tool.
Data Quality - The Real Bottleneck
Most CRM BI projects fail because teams build dashboards on top of bad data. You can have the best architecture, the cleanest semantic layer, and the most elegant Tableau workbooks - none of it matters if 30% of your email addresses bounce and half your job titles are two years old. In RevOps communities on Reddit, the most common complaint isn't about dashboards; it's that nobody trusts the underlying records enough to act on what the dashboards show. Without trustworthy records, leaders revert to gut instinct and spreadsheets.
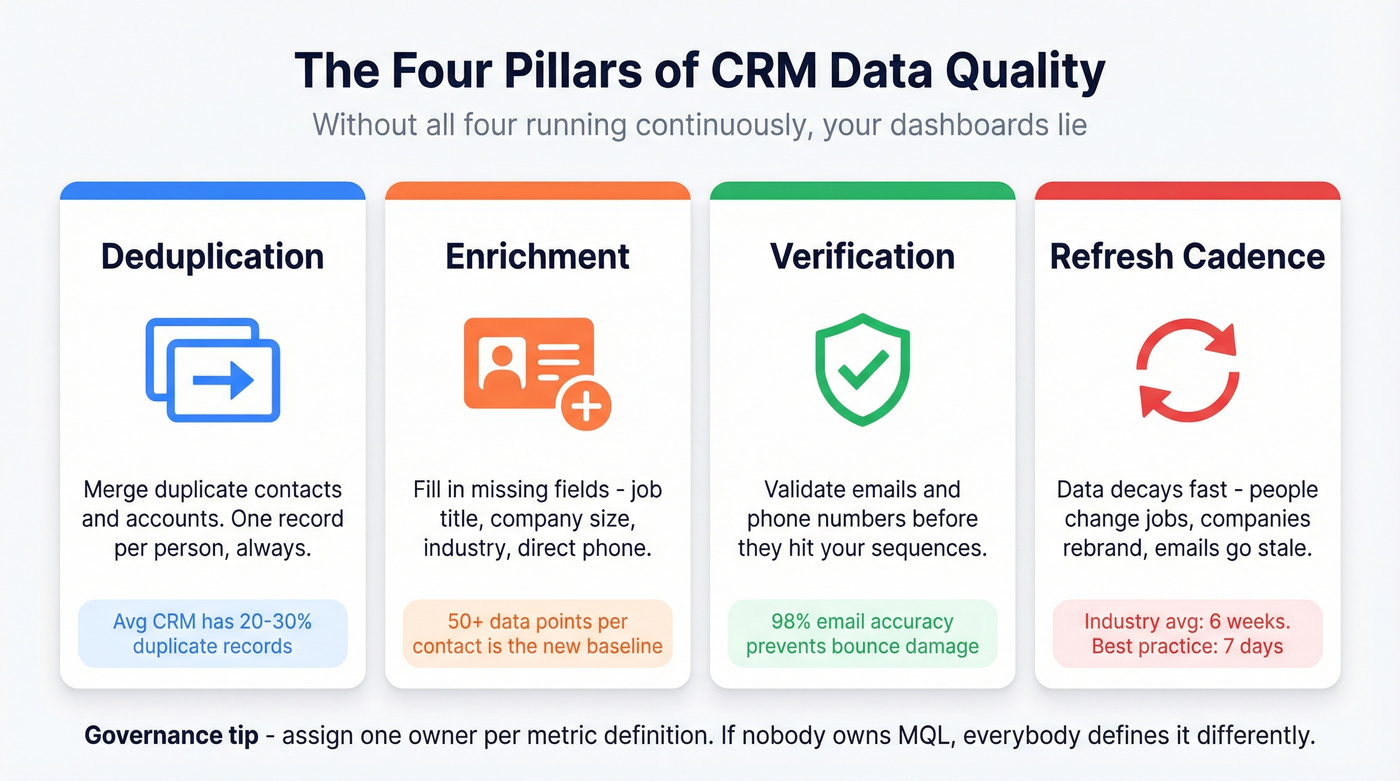
Data quality has four pillars: deduplication, enrichment, verification, and refresh cadence. You need all four running continuously, not as a one-time cleanup project. Governance means running regular audits across data quality, compliance (GDPR, CCPA), system gaps, and results metrics like churn rate and time-to-close. Assign one owner per metric definition. If nobody owns "MQL," everybody defines it differently, and your dashboards lie.
For the enrichment and verification layer, Prospeo handles this upstream - enriching CRM records with 50+ data points per contact at an 83% match rate, verifying emails at 98% accuracy, and refreshing data on a 7-day cycle compared to the 6-week industry average. Native Salesforce and HubSpot integrations mean enrichment runs inside your existing workflow, not as a side project.
BI Layer vs. Built-In CRM Analytics
Skip the dedicated BI layer if your CRM is your only data source and you have fewer than 20 reps. Built-in analytics will cover you.
For everyone else, it depends on how many data sources you're reconciling. CRM analytics vary wildly - Zoho CRM's Zia AI handles solid in-platform reporting, Apptivo includes extensive analytics and customizable dashboards, while Less Annoying CRM has limited reporting that won't satisfy a data-hungry RevOps team.
Use a dedicated BI layer when you need to reconcile CRM activity with finance, product usage, or support data under one governed model. Teams that want cross-departmental insights - not just sales dashboards - will outgrow built-in reporting quickly.
On the BI tool side, Power BI leads in adoption with 30M+ monthly users, and at around $10/user/month for Pro it's one of the cheapest serious options. But it comes with licensing confusion, a steep DAX learning curve, and heavy Microsoft ecosystem dependency that frustrates teams that aren't Microsoft-first. Tableau starts around $75/user/month and handles complex visualizations better. Looker is strongest if you're already on BigQuery. For context, CRMs run around $12-$25+/user/month and BI tools add $10-$100/user/month on top. Don't pay for infrastructure you won't use.
In 2026, more than 71% of small businesses report using a CRM system, and the global BI market is projected to grow from $96.6B to $196.5B by 2033. The tools are getting cheaper and more accessible. The question isn't whether you'll eventually need CRM BI - it's whether you need it now.
Your pipeline health dashboard is lying if 35% of your contact records bounce. Prospeo delivers 98% email accuracy and plugs directly into Salesforce and HubSpot - so every metric you build on top of CRM data actually reflects reality.
Accurate CRM intelligence starts at $0.01 per verified email.
CRM Business Intelligence FAQ
What's the difference between CRM analytics and business intelligence?
CRM analytics reports on data inside the CRM - deals, activities, pipeline. Business intelligence pulls from multiple sources into a governed model, letting you reconcile metrics across the entire business. If you only need sales dashboards, CRM analytics works. Cross-functional reporting demands a dedicated BI layer.
How often should CRM data refresh for reliable BI?
Weekly at minimum for contact and firmographic data; daily for pipeline and activity data. Stale records silently corrupt segmentation and attribution models. A 7-day refresh cycle for contact enrichment keeps the foundation current while your CRM handles activity data in real time.
What's the first dashboard to build?
Start with an exec forecast and pipeline coverage dashboard showing three metrics: total pipeline value vs. quota, weighted forecast, and pipeline aging by stage. Ship it, assign an owner, and add dashboards only when this one drives weekly decisions.
How do you fix bad CRM data before connecting BI?
Run a deduplication pass, then enrich and verify contacts in bulk. After the initial fix, set a 7-day refresh cadence so records don't decay again. The goal is continuous quality, not a one-time cleanup that erodes within months.