Deal Forecast Accuracy: Why Most Teams Get It Wrong and How to Fix It
Three committed deals just pushed to next quarter. Your Monday morning forecast call went from "we're at 94% of target" to "we're at 71%." The CFO wants to know what happened. The honest answer? Nothing happened - those deals were never as solid as the forecast said they were.
This is the norm, not the exception. Only 45% of sales leaders have high confidence in their own deal forecast accuracy. And [79% of sales organizations](https://www.forrester.com/blogs/thedefinitivewaytomeasureandgradesalesforecastaccuracy/) miss their forecast by more than 10%. The problem isn't your forecasting model. It's everything upstream of it.
The Short Version
Most forecast accuracy problems aren't math problems - they're data and behavior problems. Fix three things first: standardize your commit criteria, kill zombie deals weekly, and verify your pipeline contacts are actually reachable. Then layer in AI forecasting once you've got 500+ closed deals and clean CRM data.
What Deal Forecast Accuracy Actually Means
Let's get the definitions straight, because sloppy language causes sloppy forecasts.
Your pipeline is the portfolio of open opportunities. Your forecast is a time-bound prediction filtered and weighted from that pipeline. Pipeline tells you what exists. Forecast tells you what you think will close, when, and for how much.
Forecast accuracy measures the gap between that prediction and what actually happened. But teams get confused here because there are two distinct failure modes. Probability error means you predicted the wrong deals would close. Timing error means you predicted the right deals but got the close date wrong. Most forecast misses are timing errors - deals that slip, not deals that die. Tracking your deal slip rate separately from outright losses gives you a much clearer picture of where your forecasting actually breaks down.
One more distinction that trips people up. Stage is a process milestone like discovery complete, proposal sent, or negotiation. Forecast category is a confidence label: commit, best case, upside, pipeline. A deal can be in "negotiation" stage but still sit in "upside" forecast category if the procurement timeline is unclear. Mature forecasting requires managing both dimensions independently, and when teams conflate stage with forecast confidence, they systematically over-forecast deals that have progressed mechanically but lack genuine buyer commitment.
How to Measure It
Four metrics matter. Which one you use depends on what you're trying to diagnose.
Forecast Accuracy % is the simplest: (1 - |Forecast - Actual| / Actual) x 100. You forecast $1M, you close $900K, that's 90% accuracy. Clean and intuitive, but it hides directional bias.
MAPE (Mean Absolute Percentage Error) averages the absolute percentage errors across multiple periods. If your monthly errors are 10%, 15%, and 5%, your MAPE is 10%. This is the workhorse metric for tracking improvement over time.
sMAPE (Symmetric MAPE) normalizes using the average of forecast and actual, bounded between 0% and 200%. It handles situations where actuals are small or volatile - useful for new product lines or expansion revenue where the denominator swings wildly.
Forecast Bias tells you whether you're systematically optimistic or pessimistic. Positive bias means you're consistently over-forecasting (happy ears). Negative bias means reps are sandbagging. This is the metric that reveals cultural problems.
| Metric | Best For | Watch Out For |
|---|---|---|
| Accuracy % | Single-period snapshot | Hides direction of miss |
| MAPE | Multi-period trending | Distorted by small actuals |
| sMAPE | Volatile/small actuals | Less intuitive to explain |
| Bias | Cultural diagnosis | Doesn't show magnitude |
A worked MAPE example: Q1 you missed by 10%, Q2 by 15%, Q3 by 5%. Your MAPE is (10 + 15 + 5) / 3 = 10%. Track it quarterly and you'll see whether your process changes are actually working.
2026 Benchmarks
An Optifai benchmark study of 287 B2B companies gives us the clearest picture of where teams actually land.
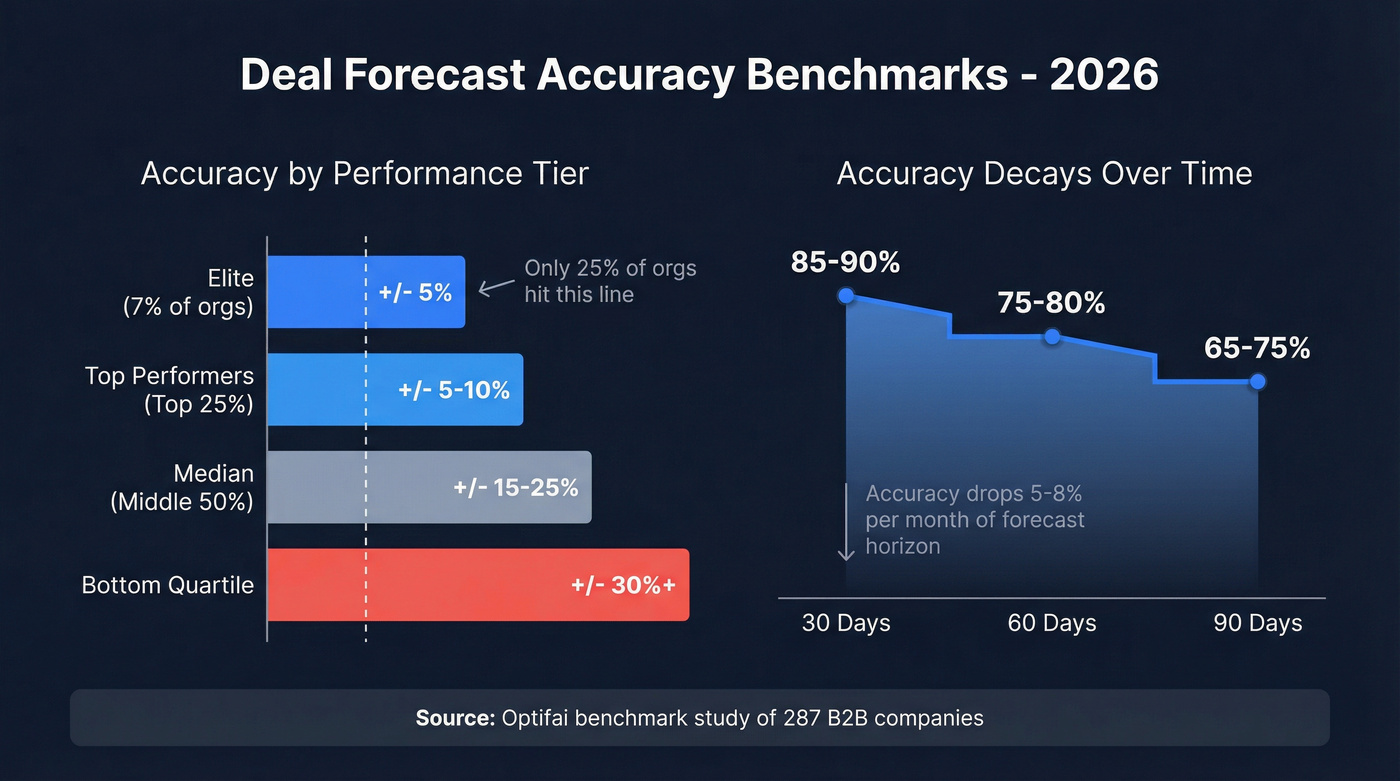
| Performance Tier | Variance Range | % of Orgs |
|---|---|---|
| Elite | ±5% | ~7% |
| Top performers | ±5-10% | Top quartile |
| Median | ±15-25% | Middle 50% |
| Bottom quartile | ±30%+ | Needs intervention |
Fewer than 25% of sales organizations achieve forecast accuracy within 10% of actual results. If you're in that range, you're already outperforming three-quarters of the market.
Accuracy also decays predictably with time horizon - about 5-8% per month.
| Horizon | Typical Accuracy |
|---|---|
| 30 days | 85-90% |
| 60 days | 75-80% |
| 90 days | 65-75% |
The practical implication: your "this month" forecast should be tight. Your "next quarter" forecast is inherently fuzzier, and that's fine - as long as you're using different methods for different horizons.
Half of forecast misses start with bad contact data - emails that bounce, mobiles that don't connect. Prospeo delivers 98% verified emails and 125M+ direct dials refreshed every 7 days, so your committed deals are built on contacts you can actually reach.
Stop forecasting deals you can't even contact. Start with verified data.
The 5 Forecast Accuracy Killers
We've seen these patterns wreck forecasts at companies of every size. Ask any RevOps leader what breaks their forecast and you'll hear the same themes. Each killer below has a diagnostic question you can use in your next deal reviews.
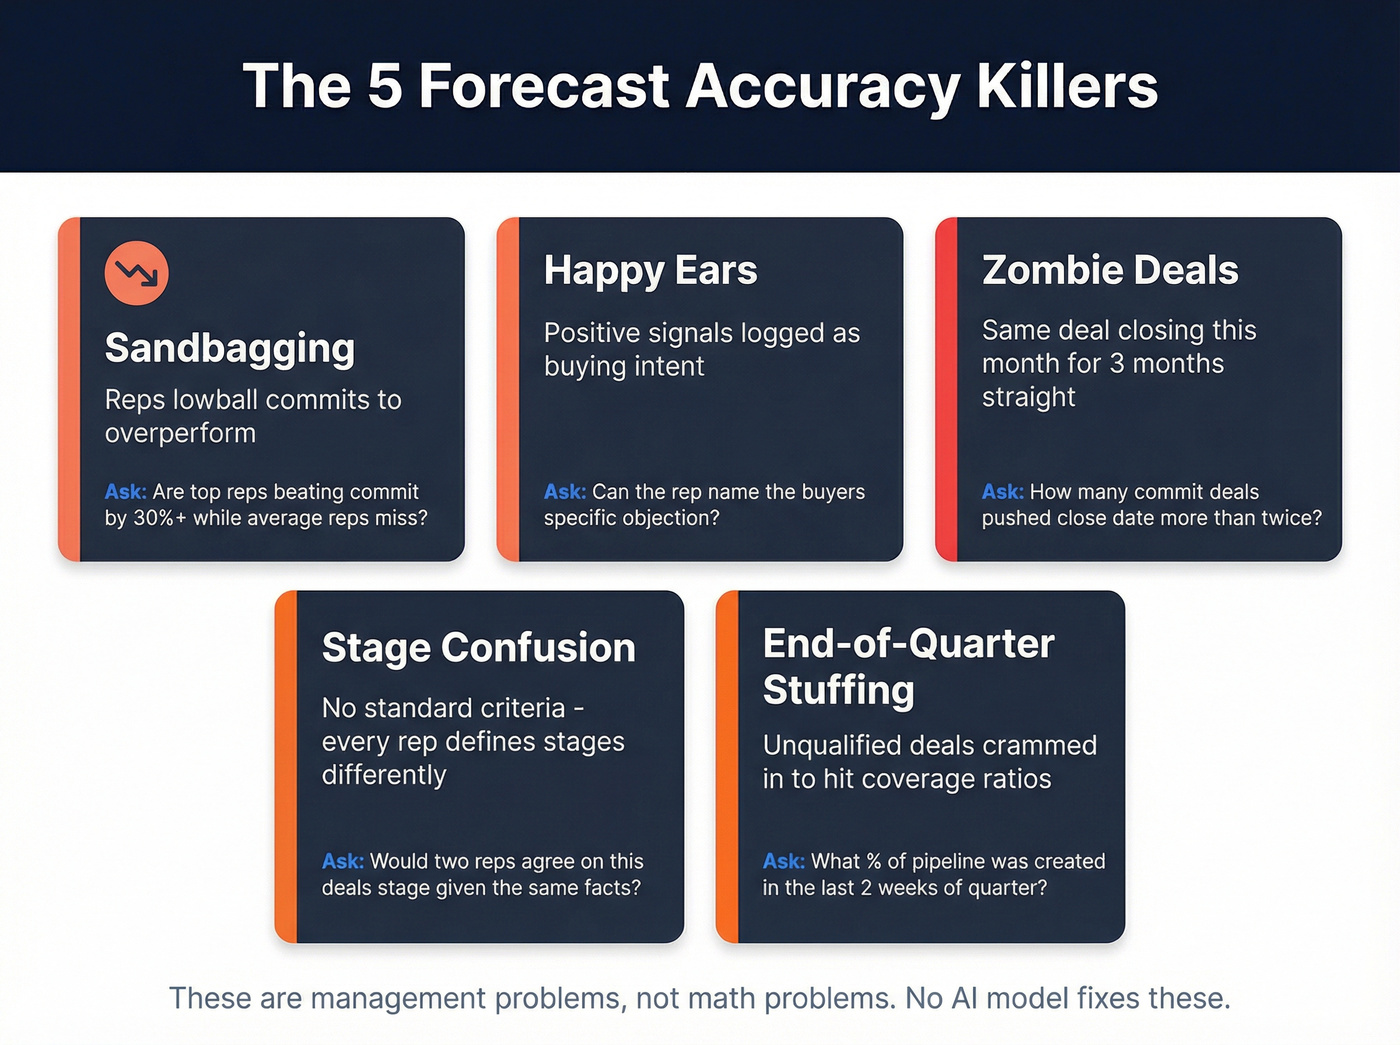
Sandbagging. Reps lowball their commits to overperform and look like heroes. The forecast looks conservative, but you can't plan headcount, marketing spend, or capacity around artificially deflated numbers. Diagnostic: "Are your top reps consistently beating commit by 30%+ while average reps miss?"
Happy ears. The prospect said "this looks interesting" and it got logged as "strong buying signal." We've all been there. Diagnostic: "Can the rep articulate the buyer's specific objection or concern - not just the positive signals?"
Zombie deals. The opportunity that's been "closing this month" for three consecutive months. Everyone knows it's dead, but nobody wants to kill it because it inflates pipeline coverage coverage. These zombies are the single biggest contributor to a high deal slip rate - they push quarter after quarter without ever actually closing. Diagnostic: "How many deals in commit have pushed their close date more than twice?"
Stage confusion. One rep's "discovery complete" is another rep's "qualified." Without standardized, objective criteria for each stage, your weighted pipeline math is built on sand. Diagnostic: "Can two different reps independently agree on what stage a deal is in, given the same facts?"
End-of-quarter stuffing. Reps cram pipeline in the last two weeks to hit coverage ratios, creating a surge of early-stage deals that inflate next quarter's forecast before anyone's qualified them. Diagnostic: "What percentage of your pipeline was created in the final two weeks of last quarter?"
Here's the thing - these aren't forecasting problems. They're management problems. No AI model fixes sandbagging. No formula fixes zombie deals. You fix these with process, definitions, and weekly discipline.
Why Deals Really Slip
Beyond behavioral killers, structural forces erode prediction accuracy at the deal level.
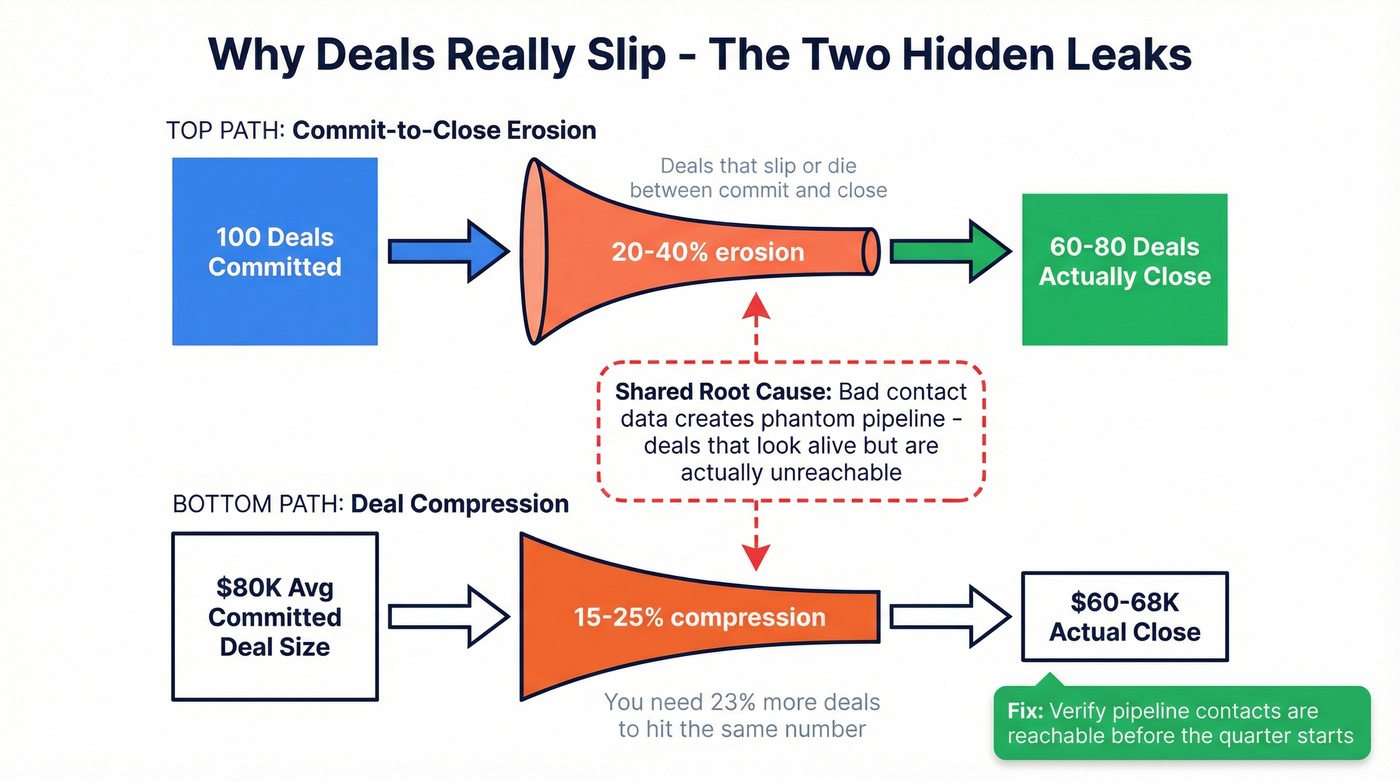
Commit-to-close erosion is the gap between what reps commit and what actually closes. Uncalibrated pipelines typically experience 20-40% erosion from initial commit to final close. That's not a rounding error - it's a structural leak.
Deal compression is the other hidden miss. Even when deals close, they often close smaller. Consistent 15-25% compression on deal size and margin means you can hit your deal count target and still miss revenue. If your average committed deal is $80K and it closes at $65K, you need 23% more deals to hit the same number.
Both erosion and compression share an upstream cause that rarely gets discussed in forecasting articles: bad contact data. When emails bounce and phone numbers are wrong, reps can't progress deals. Stalled deals become phantom pipeline - opportunities that look alive in the CRM but are actually unreachable. Those phantom deals inflate your forecast until they finally get killed, usually at the worst possible moment.
This is where data quality becomes a forecasting issue, not just a marketing issue. When your pipeline contacts are verified and reachable, deals progress on schedule instead of stalling because reps can't get through. Prospeo verifies emails at 98% accuracy on a 7-day refresh cycle, so you can confirm the people in your forecast are actually contactable before the quarter starts. It's the most overlooked fix for deal forecast accuracy: clean the data upstream and the downstream predictions improve automatically.
Forecasting Methods Compared
No single method works for every horizon or motion.
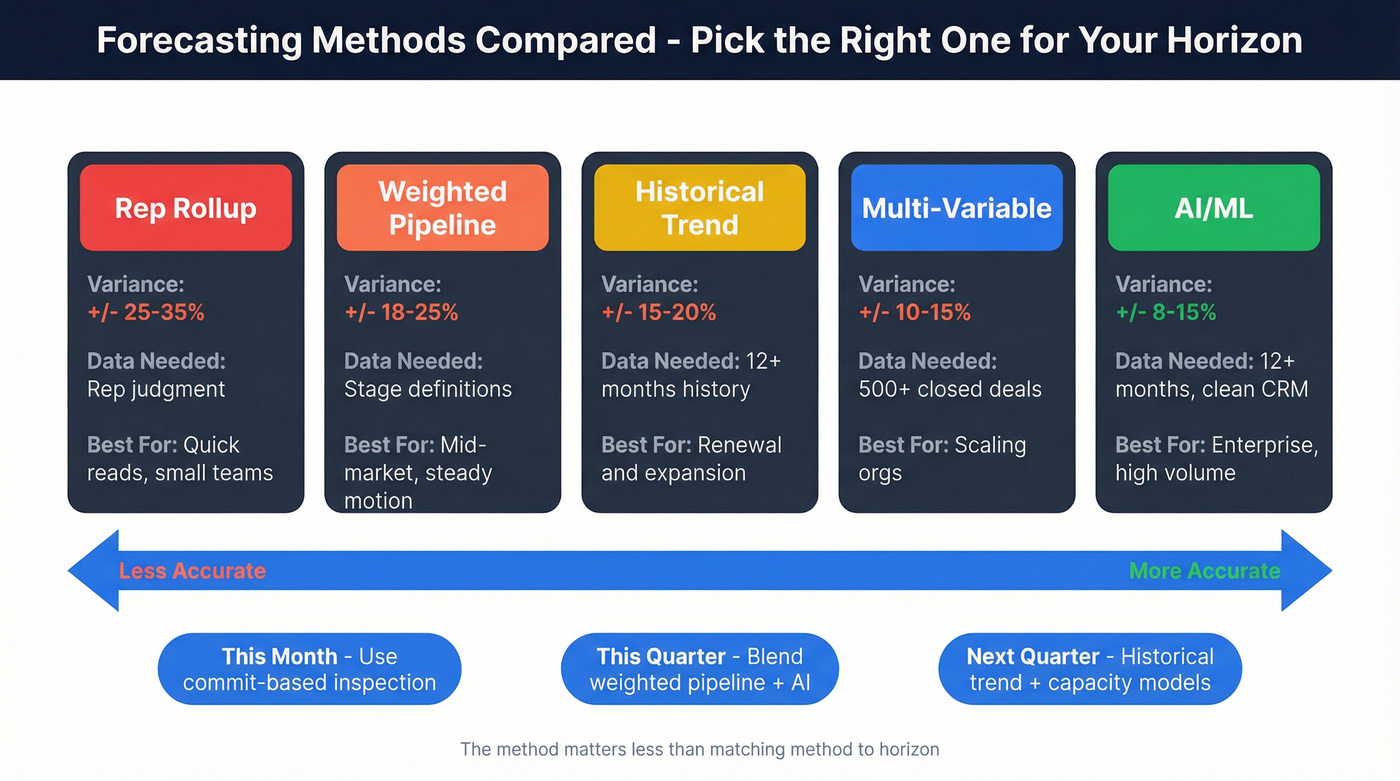
| Method | Typical Variance | Data Required | Best For |
|---|---|---|---|
| Rep rollup | ±25-35% | Rep judgment | Quick reads, small teams |
| Weighted pipeline | ±18-25% | Stage definitions | Mid-market, steady motion |
| Historical trend | ±15-20% | 12+ months history | Renewal/expansion |
| Multi-variable | ±10-15% | 500+ closed deals | Scaling orgs |
| AI/ML | ±8-15% | 12+ months, clean CRM | Enterprise, high volume |
The 500-deal threshold for multi-variable models is real. Below that, you'll get better results by tightening stage definitions and running a disciplined weighted pipeline.
No serious revenue team uses one method. Mature organizations layer multiple approaches and reconcile the outputs. Your "this month" forecast should be commit-based with deal-by-deal inspection. Your "this quarter" forecast should blend weighted pipeline with AI signals. Your "next quarter" forecast should lean on historical trend and capacity models. You can also add a top-down capacity model - estimating revenue from rep count, quota, and historical attainment - as a sanity check against your bottoms-up number.
The method matters less than the discipline of matching method to horizon and actually reconciling when they disagree.
How AI Improves Deal Predictions
AI forecasting works by ingesting signals that humans can't track at scale: CRM fields like stage, amount, and age in stage; engagement signals such as call frequency and proposals sent; competitor mentions in emails; historical win/loss patterns by industry and deal size; and market signals like seasonality.
The before/after numbers are compelling. Traditional forecasting methods typically produce ±12-15% variance. Predictive AI, in mature implementations, tightens that to ±3-5%. McKinsey's research found AI-driven forecasting reduces errors by 20-50%. AI also compresses forecast generation from 4-5 hours of manual assembly to under 30 minutes - freeing RevOps to analyze rather than aggregate.
Real-world examples back this up:
Siemens rolled out AI-assisted forecasting across 4,000+ sellers in 190 countries, achieving forecast submission rates above 70% - a massive behavioral shift at enterprise scale.
Omniplex Learning's CRO reported tightening forecast accuracy to within 5% after replacing spreadsheet-based processes with real-time AI visibility.
But here's what most AI vendors won't tell you: AI is the last step, not the first. If your average deal size is under $30K and you have fewer than 500 closed-won deals in your CRM, you'll get more forecast improvement from a weekly zombie-deal purge and verified contact data than from any AI tool on the market. The prerequisites are non-negotiable: 12+ months of historical data, 500+ closed deals with consistent data capture, and clean CRM hygiene. Deploy AI on dirty data and you'll get faster wrong answers. The AI learns your bad patterns and amplifies them.
Fix Your Forecast This Quarter
Five steps, in order. Don't skip to step five.
1. Standardize commit criteria with objective signals. "I feel good about this deal" isn't a commit criterion. "Budget confirmed, mutual close plan signed, legal review initiated" is. Write down three to five objective signals required for commit status and enforce them in every deal review.
2. Run weekly deal reviews and flag zombies ruthlessly. Any deal that's been "closing this month" for two or more months gets moved to pipeline or killed. No exceptions. This single habit eliminates the biggest source of forecast inflation and forces honest conversations about deal health.
3. Calibrate by rep. Every rep has a forecasting fingerprint. If Rep A consistently over-forecasts by 18%, discount their commits by 18%. This bias correction is simple arithmetic that dramatically improves aggregate accuracy - track each rep's historical accuracy and apply the adjustment automatically.
4. Clean your contact data. Run your pipeline contacts through verification before the quarter starts. Bounced emails and disconnected numbers are leading indicators of deals that will stall. We've seen teams cut their phantom pipeline by 15-20% just by verifying contacts in the first week of the quarter. (If you need a workflow, start with how to verify your pipeline contacts.)
5. Layer forecasting methods by horizon. This month: commit-based with deal inspection. This quarter: weighted pipeline plus AI signals. Next quarter: historical trend plus capacity model. Match the method to the uncertainty level.
Zombie deals linger because reps can't reach real decision-makers. Prospeo's 30+ search filters - including job changes, buyer intent, and org charts - help you validate whether your pipeline contacts are still in-seat and reachable at $0.01 per email.
Kill zombie deals faster with contacts that actually pick up.
FAQ
What's a good forecast accuracy percentage?
Top-performing B2B teams hold ±5-10% variance from actual results, placing them in the top quartile. Median organizations sit at ±15-25%. If you're consistently within 10%, you're outperforming roughly 75% of sales organizations.
How do you calculate forecast accuracy?
The simplest formula is (1 - |Forecast - Actual| / Actual) x 100. For multi-period tracking, use MAPE - average the absolute percentage errors across periods. A detailed walkthrough of these metrics is helpful if you're setting up dashboards for the first time.
Why does accuracy decay over longer horizons?
Accuracy drops 5-8% per month because more variables enter the picture - deal slippage, budget changes, champion turnover, competitive entries. At 30 days you're typically at 85-90%; at 90 days, 65-75%. Use commit-based methods for near-term and historical trend models for longer horizons.
Can AI really fix forecast accuracy?
AI reduces variance from ±12-15% to ±3-5% in mature implementations - but only with clean CRM data, 500+ closed deals, and 12+ months of history. Deploy AI on dirty data and you'll get faster wrong answers. Fix data quality and process first.
What's the fastest way to improve deal forecast accuracy?
Three quick wins produce results within a single quarter: standardize commit criteria with objective signals, kill zombie deals in weekly reviews, and verify your pipeline contacts are reachable. Skip this if you're already hitting ±10% variance - at that point, AI and multi-variable models are where your next gains come from.