Customer Acquisition Cost by Industry: 2026 Benchmarks
Your CEO asked what a "good" CAC looks like. You pulled up three articles, got three wildly different numbers, and now you're questioning whether anyone actually tracks this properly. The data on customer acquisition cost by industry exists - it's just scattered across sources that define CAC differently, cover different time windows, and weight channels their own way. Below: multiple datasets side by side, with the caveats that actually matter.
Quick version: In FirstPageSage's B2B dataset, combined average CAC ranges from $86 (eCommerce) to $1,143 (higher education). In their B2C dataset, organic CAC starts as low as $64 (eCommerce) and paid CAC reaches $506 (addiction treatment). These numbers are meaningless without context, though - your channel mix, company stage, and CAC definition change everything.
How to Calculate CAC Correctly
The formula looks simple: total sales and marketing spend divided by new customers acquired. A worked example: your team spent $150K on sales and marketing last quarter and closed 200 new customers. That's a $750 CAC.
Most teams get at least one thing wrong.
First, CAC isn't CPA. CPA measures the cost of any conversion event - a lead, a trial signup, an activation. CAC measures the cost of an actual paying customer. Conflating the two makes your numbers look better than they are.
Second, there's the time-lag problem. If your sales cycle runs 60+ days (the average B2B SaaS cycle is now 134 days), dividing this month's spend by this month's new customers produces garbage. You're attributing January's spend to customers who were actually acquired from October's pipeline. The fix is cohort-based attribution, which takes more work but gives you numbers you can actually trust.
Third, decide what "fully loaded" means for your company. As Maxio points out, no governing body defines CAC. Some companies count only ad spend. Others include salaries, tools, content production, and founder time. The consensus on r/microsaas is blunt: if you're only counting ad spend and ignoring the 20 hours a week you personally spend on sales, you're lying to yourself. Pick a definition, document it, and stick with it.
B2B CAC Benchmarks by Industry
The most comprehensive B2B dataset comes from FirstPageSage, covering 29 industries from January 2022 through August 2025. Their combined CAC is weighted 75% organic and 25% inorganic, which skews toward companies investing heavily in content. Keep that in mind when comparing to your own mix.
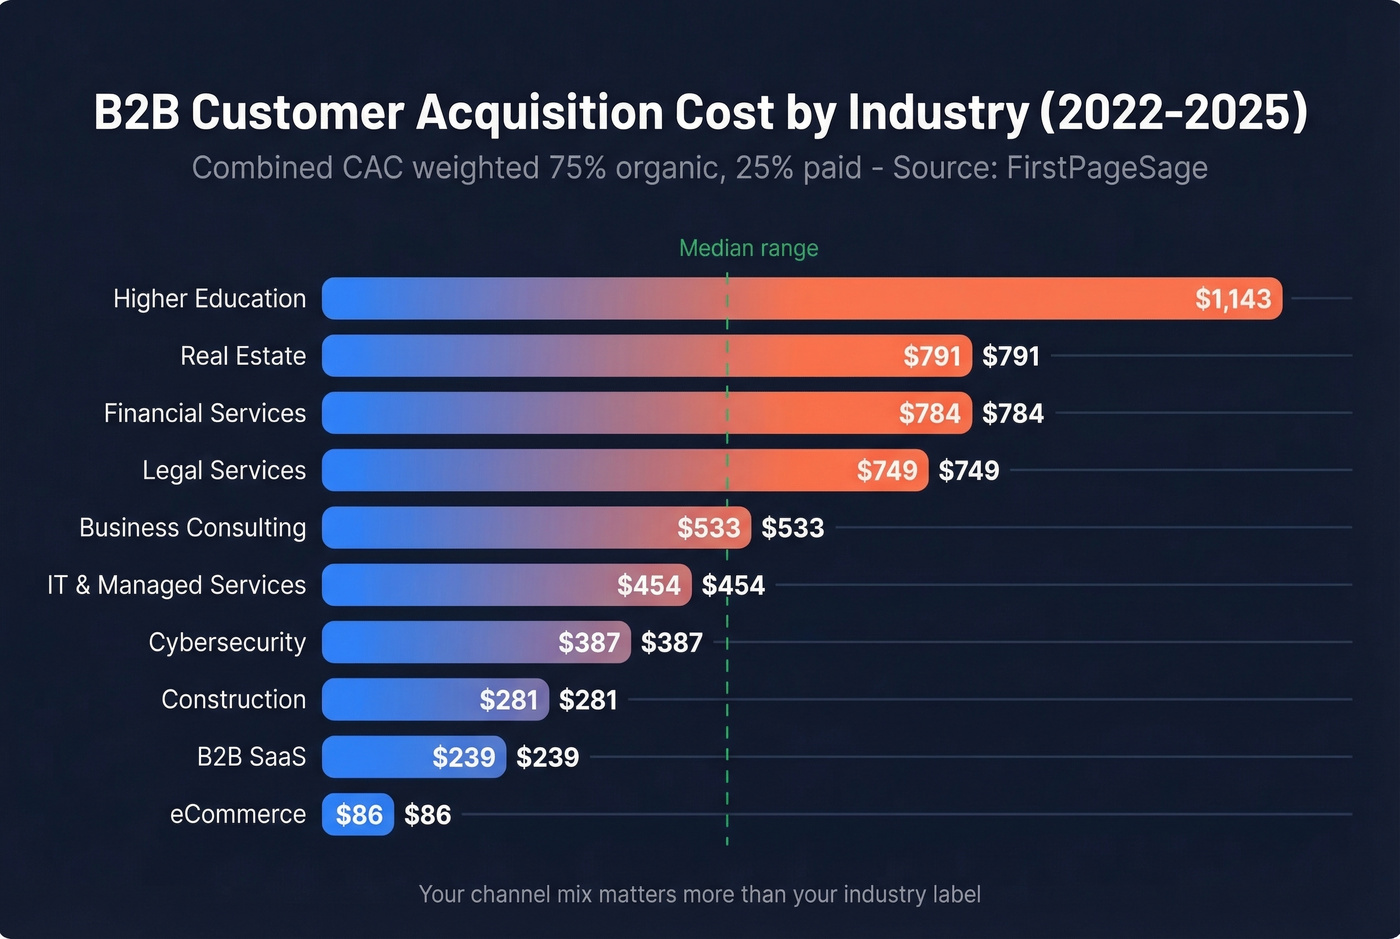
| Industry | Organic CAC | Paid CAC | Combined |
|---|---|---|---|
| eCommerce | $87 | $81 | $86 |
| B2B SaaS | $205 | $341 | $239 |
| Construction | - | - | $281 |
| Environmental Services | - | - | $362 |
| Cybersecurity | - | - | $387 |
| PCB Design & Manufacturing | - | - | $412 |
| IT & Managed Services | - | - | $454 |
| Transportation & Logistics | - | - | $510 |
| Engineering | - | - | $512 |
| Business Consulting | - | - | $533 |
| Medical Device | - | - | $565 |
| Commercial Insurance | - | - | $593 |
| Biotech | - | - | $613 |
| Legal Services | $584 | $1,245 | $749 |
| Financial Services | - | - | $784 |
| Oil & Gas | - | - | $783 |
| Real Estate | - | - | $791 |
| Higher Education | $862 | $1,985 | $1,143 |
Selected industries shown - full dataset covers 29 verticals at FirstPageSage.
The extremes tell the story. B2B eCommerce at $86 reflects short sales cycles and high-volume transactions. Higher education at $1,143 reflects long decision timelines, multiple stakeholders, and heavy content investment. Cybersecurity sits surprisingly low at $387 - strong inbound demand from security-conscious buyers keeps organic CAC down. Real estate at $791 is driven by high-touch sales processes and long procurement cycles involving multiple decision-makers.
Here's the thing: if your industry sits in the $400-$800 range, your channel mix matters more than your industry label.
B2C CAC Benchmarks by Industry
FirstPageSage's B2C dataset covers 103 clients from 2021-2025 across 20 industries. B2C acquisition costs run substantially lower than B2B - no surprise given shorter sales cycles and lower price points.
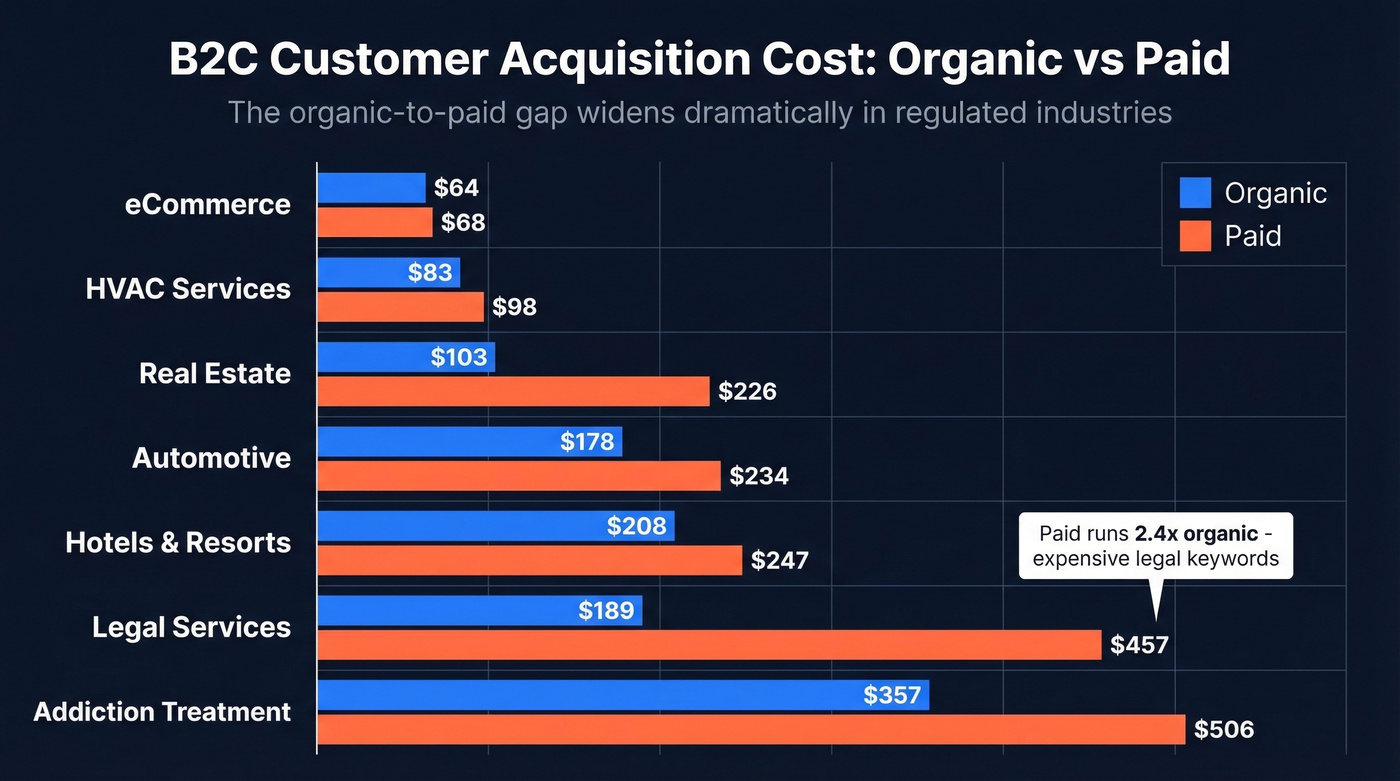
| Industry | Organic CAC | Paid CAC |
|---|---|---|
| eCommerce | $64 | $68 |
| HVAC Services | $83 | $98 |
| Real Estate | $103 | $226 |
| Automotive | $178 | $234 |
| Hotels & Resorts | $208 | $247 |
| Legal Services | $189 | $457 |
| Addiction Treatment | $357 | $506 |
Selected industries shown - full dataset covers 20 verticals.
The gap between organic and paid is tighter in B2C than B2B for most categories. Legal services is the exception, where paid CAC runs 2.4x organic - a reflection of brutally expensive legal keywords in Google Ads. For DTC subscription brands (meal kits, beauty boxes, supplements), expect CAC in the $50-$150 range based on typical category performance and Shopify merchant data.
eCommerce CAC Breakdown
For a second data point, Shopify published category-level CACs based on 2021 data from merchants with fewer than four employees - a small-merchant baseline:
| Category | CAC |
|---|---|
| Arts & entertainment | $21 |
| Health & beauty | $127 |
| Fashion & accessories | $129 |
| Home, furniture & garden | $129 |
| Electronics | $377 |
These are significantly lower than what a mid-size DTC brand would see today. Use them as a floor, not a target. Electronics at $377 is particularly telling - high AOV categories can absorb higher CAC, but margins get thin fast on paid channels.
Your CAC benchmark means nothing if half your outbound emails bounce. Teams using Prospeo cut bounce rates from 35% to under 4% - and triple pipeline output without adding headcount. At $0.01 per verified email with 98% accuracy, your cost-per-acquired-customer drops fast.
Stop inflating your CAC with bad data. Start with 75 free emails.
SaaS and Startup CAC Deep Dive
SaaS CAC varies wildly depending on what you sell and who you sell it to. The vertical-by-segment breakdown makes industry averages look almost useless:
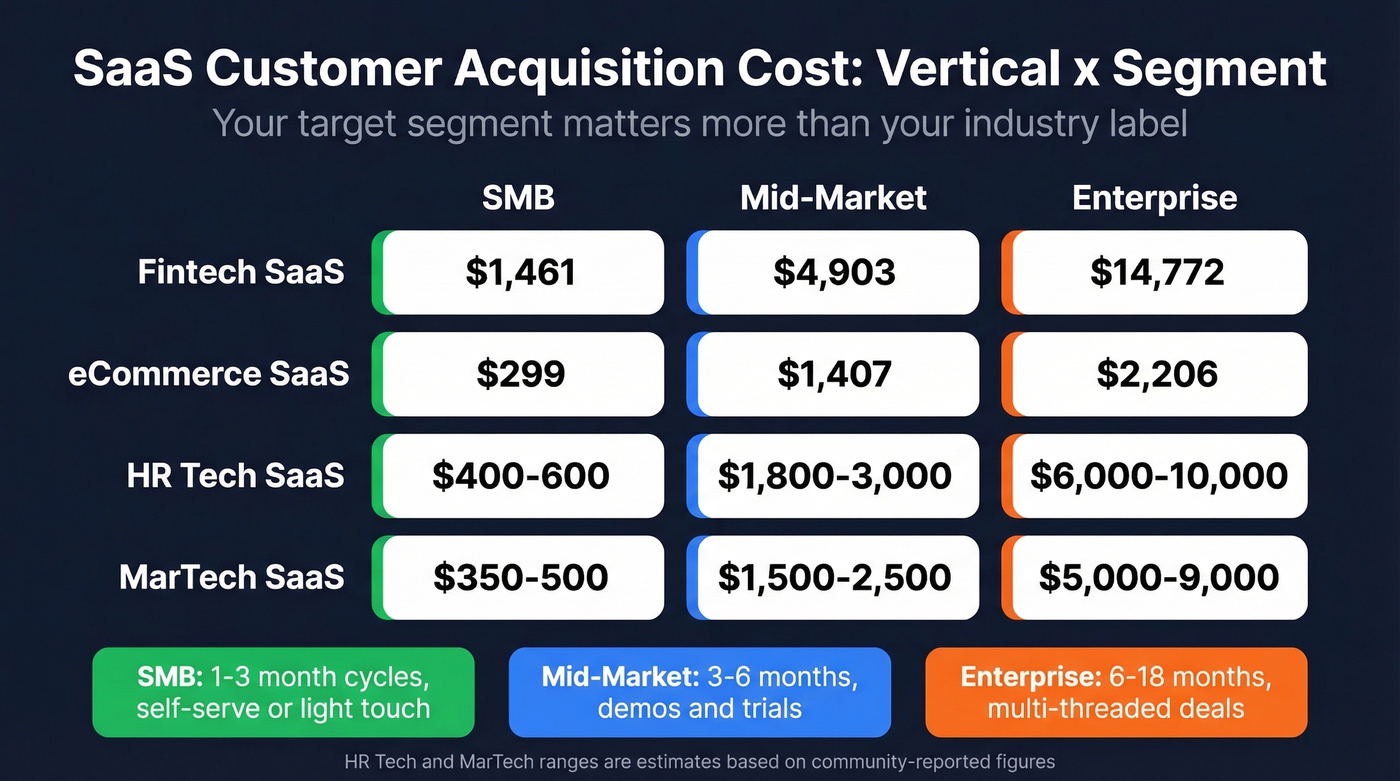
| Vertical | SMB | Mid-Market | Enterprise |
|---|---|---|---|
| Fintech SaaS | $1,461 | $4,903 | $14,772 |
| eCommerce SaaS | $299 | $1,407 | $2,206 |
| HR Tech SaaS | ~$400-$600 | ~$1,800-$3,000 | ~$6,000-$10,000 |
| MarTech SaaS | ~$350-$500 | ~$1,500-$2,500 | ~$5,000-$9,000 |
HR Tech and MarTech ranges are estimates based on market positioning and community-reported figures.
The median SaaS company spends $2.00 to acquire $1 of new ARR. Top-quartile performers get that down to roughly $1.00; bottom-quartile companies burn $2.82. That efficiency gap is the difference between a fundable company and one running out of runway.
If your annual contract value sits below $10K, you probably don't need enterprise-grade CAC. Most companies at that price point should optimize for self-serve conversion and low-touch sales - not build a 12-month enterprise sales motion that eats their margins alive. We've watched teams burn through entire seed rounds trying to run an enterprise playbook on a $5K ACV product. Don't be that team.
Your target segment matters more than your industry label:
- SMB targets ($100-$400 CAC): 1-3 month sales cycles. Self-serve or light-touch sales. Volume game.
- Mid-market targets ($400-$800 CAC): 3-6 month cycles. Demos, trials, procurement involvement.
- Enterprise targets ($800-$15,000+ CAC): 6-18 month cycles. Multi-threaded deals, security reviews, legal redlines.
CAC for B2B tech startups is up 40-60% since 2023. The drivers: more competition for the same buyers, rising ad costs, and longer evaluation cycles as budgets tighten.
Average CAC by Channel
Not all channels are created equal. The Optifai Sales Ops Benchmark 2025 covers 939 B2B companies across the first three quarters of 2025:
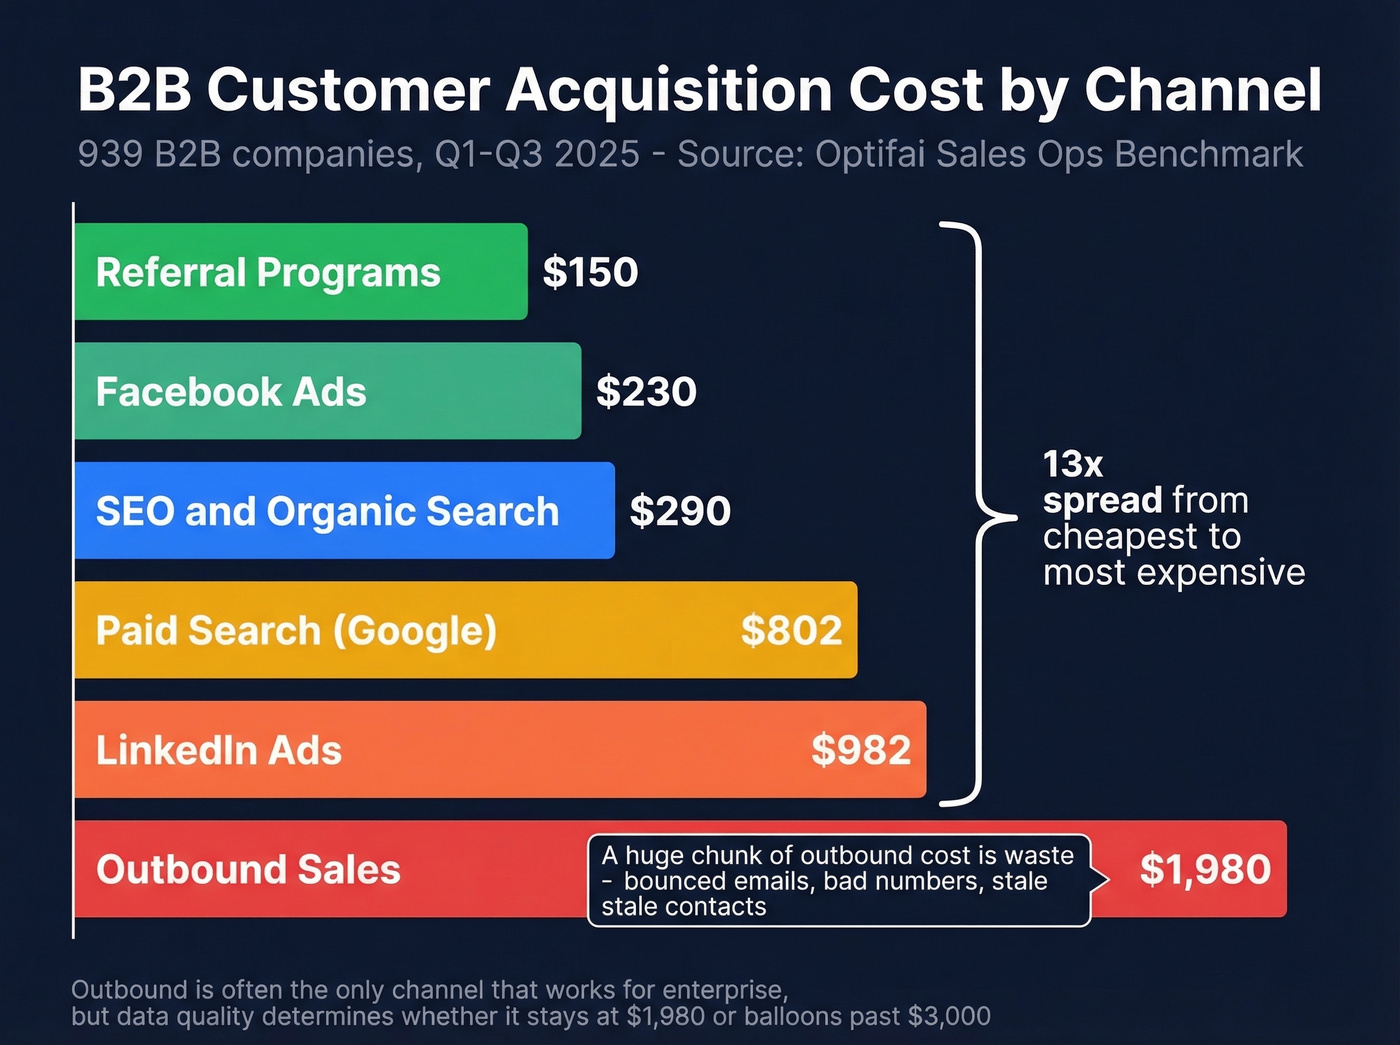
| Channel | Average CAC |
|---|---|
| Referral programs | $150 |
| Facebook Ads | $230 |
| SEO / Organic search | $290 |
| Paid search (Google) | $802 |
| LinkedIn Ads | $982 |
| Outbound sales | $1,980 |
The referral-to-outbound spread is 13x. That doesn't mean you should abandon outbound - for enterprise deals, it's often the only channel that works. But it does mean your data quality and targeting precision have an outsized impact on whether outbound CAC stays at $1,980 or balloons past $3,000.
A huge chunk of outbound cost is waste. Bounced emails, disconnected phone numbers, reps chasing contacts who left the company months ago. If half your outbound emails bounce, you're burning half your budget before a single conversation happens - effectively doubling your cost per qualified conversation. In our experience, fixing data quality is the single fastest lever for reducing outbound CAC. Tools like Prospeo, with 98% email accuracy and a 7-day data refresh cycle, cut that waste at the source so reps spend time selling instead of debugging bad contact data.

Why CAC Keeps Rising (2023-2026)
Everything got more expensive, and buyers got slower.
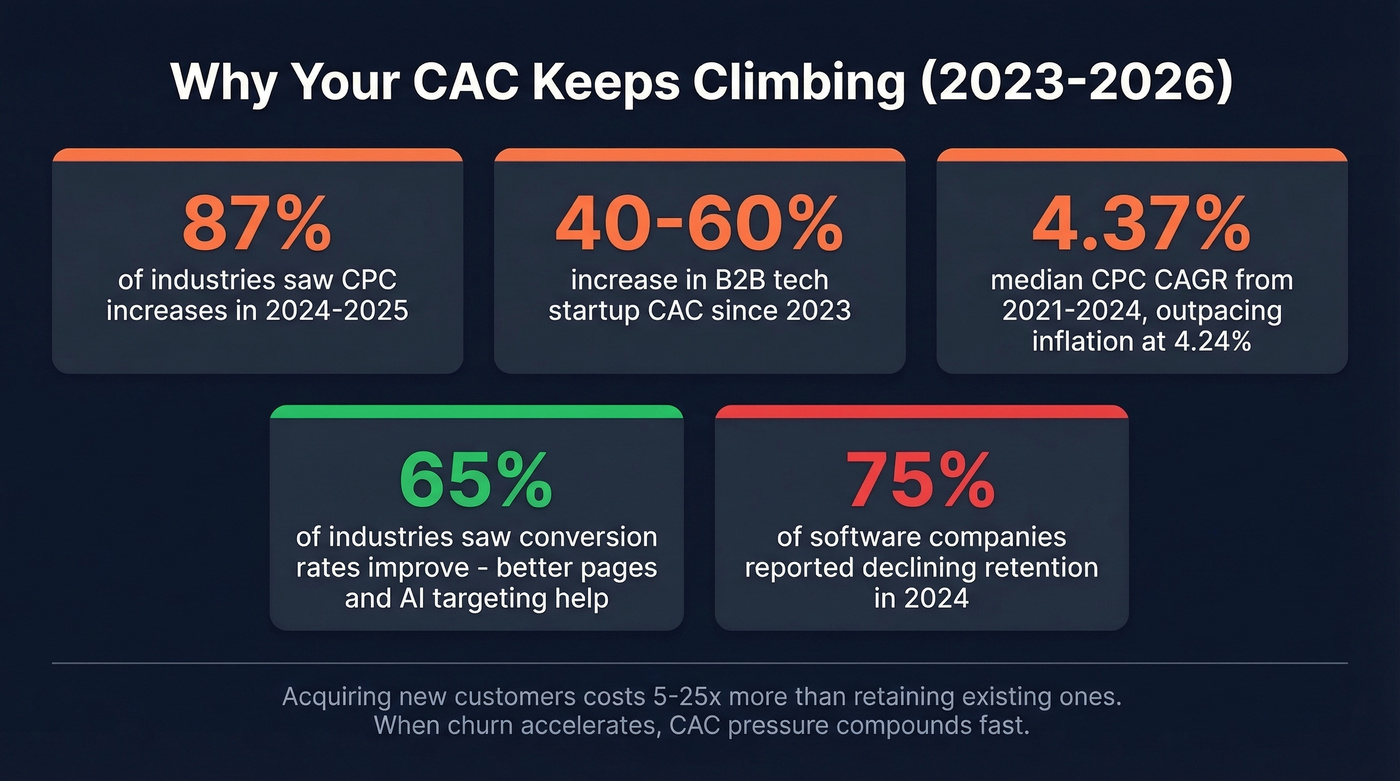
If you're comparing your current numbers to 2022 benchmarks, expect a 30-60% increase depending on your vertical and channel mix. WordStream's 2025 benchmarks (16,000+ campaigns, April 2024-March 2025) found CPC increased in 87% of industries. The median CPC CAGR from 2021-2024 was 4.37%, outpacing the five-year average U.S. CPI of 4.24%. You're not imagining it: ad costs are rising faster than inflation.
Some verticals got hit harder than others. Travel keyword CPCs grew at a 16.72% CAGR. Legal hit 14.25%. If you're in either space, your paid search clicks are up roughly 50-60% in three years.
The silver lining: conversion rates improved in 65% of industries. Better landing pages, smarter targeting, and AI-powered optimization are partially offsetting CPC increases. One widely cited figure is a 37% CAC reduction from AI-driven campaigns - selection bias likely inflates that number (early AI adopters tend to be more sophisticated overall), but even a 15-20% improvement from better targeting pays for itself.
On the retention side, 75% of software companies reported declining retention in 2024. Acquiring new customers costs 5-25x more than retaining existing ones, so when churn accelerates, CAC pressure compounds fast. We've seen teams break this cycle by tightening ICP definition and investing in onboarding - reducing churn by even 5% can increase profits 25-95%.
How to Reduce Your CAC
1. Check your LTV:CAC ratio first. The minimum viable ratio is 3:1. Most healthy B2B SaaS companies target 4:1 to 7:1. A $1,200 CAC is perfectly fine if your LTV is $15,000 and payback is under 12 months. A $200 CAC is terrible if customers churn in 60 days.
2. Measure payback period. The average private SaaS company takes 23 months to pay back CAC. One case study from EverCMO showed a team cutting payback from 11 months to 6 months in 90 days - a 28% CAC reduction - by aligning RevOps metrics and running a focused execution sprint.
3. Fix data quality before scaling outbound. Bad contact data doesn't just waste money - it damages your domain reputation, making every subsequent email more expensive. Snyk's team of 50 AEs cut bounce rates from 35-40% to under 5% after switching to verified data, driving a 180% increase in AE-sourced pipeline. When your data is accurate, every dollar of outbound spend works harder. If you’re auditing list hygiene, start with email bounce rate benchmarks and remediation.
4. Shift spend toward lower-CAC channels. Referral programs ($150 CAC) and SEO ($290) cost a fraction of paid search ($802) or outbound ($1,980). Community-led acquisition is another underrated play - r/microsaas founders regularly report $200-$400 CAC through engaged communities and word-of-mouth. The catch: these channels take longer to build. Start investing now.
5. Shorten sales cycles with better qualification. Every extra week in your pipeline adds cost. Intent data, tighter ICP definition, and ruthless disqualification of bad-fit prospects all help. Skip this if your sales cycle is already under 30 days - at that speed, your time is better spent on conversion rate optimization than pipeline acceleration.
If you’re running outbound, tightening your sales prospecting techniques and using the right SDR tools can reduce wasted touches without cutting volume.
Enterprise CAC hitting $14K+ per customer? The biggest lever isn't your ad budget - it's reaching the right decision-makers on the first attempt. Prospeo's 125M+ verified mobiles deliver a 30% pickup rate, and 30+ filters like buyer intent and headcount growth let you skip the noise entirely.
Reduce your CAC by connecting with real buyers, not dead leads.
FAQ
What's a good CAC for SaaS?
SMB SaaS typically runs $200-$500 per customer; enterprise SaaS can hit $800-$15,000+ with 6-18 month sales cycles. The number that actually matters is your LTV:CAC ratio - aim for 3:1 or better with payback under 12 months. A high CAC with strong retention beats a low CAC with 60-day churn every time.
Why do CAC benchmarks vary across sources?
No standard definition exists for what costs to include. Some sources count only ad spend; others include salaries, tools, and overhead. FirstPageSage weights 75% organic / 25% paid, while Shopify's data covers sub-four-employee merchants. Always check methodology before comparing - reviewing multiple datasets, as we've done above, gives a more reliable range than any single source.
How can outbound teams reduce CAC quickly?
Start with data quality - bounced emails and wrong numbers are pure waste that burns budget and damages sender reputation. Teams switching to verified data sources typically cut bounce rates below 5%, which alone can reduce cost per qualified conversation by 30-50%. Layer in intent signals and tighter ICP filters to compress spend further without reducing volume.