Data-Driven Sales Management: Benchmarks, Cadence, and Playbook
69% of B2B sales reps missed quota last year](https://www.claap.io/blog/sales-metrics). Not because they lacked dashboards - most teams are drowning in dashboards. They missed because nobody connected the data to decisions that changed rep behavior. That's what data-driven sales management actually solves, and it's simpler than the enterprise software vendors want you to believe.
What It Actually Means
It's not "we have a CRM" or "we built a Tableau dashboard." It means decisions default to what the data says - you don't override metrics with gut feel unless you have a documented reason.
A Forrester TEI study modeled 3.3x ROI, 12% higher close rates, and a 40% increase in selling activity for orgs that actually operationalized their data. Most teams claim to be data-driven but practice data-informed at best. Data is one input among many, and the loudest voice in the room still wins.
The Metrics That Matter (With Benchmarks)
Pick 5-7 metrics that map to your sales motion and ignore everything else until those are clean.
| Metric | Benchmark Range | Best-in-Class |
|---|---|---|
| Win rate | 20-30% | 35-40%+ |
| Pipeline coverage | 3-4x quota | 5x if win rate is low |
| Sales cycle | 3-6 months (B2B) | Varies by ACV |
| Speed-to-lead | Under 5 min (8-21x higher conversion) | 35-50% of deals go to first responder |
| Outreach to meeting | 2-3% cold / 15-20% warm | - |
| Meeting to opportunity | 25-40% | 40%+ |
| Qualified conversations/day | SDR: 15-20, AE: 8-12 | - |
| Ramp time | 3-6 months | Under 3 months |
| Sales efficiency ratio | 3:1+ | 5:1+ |
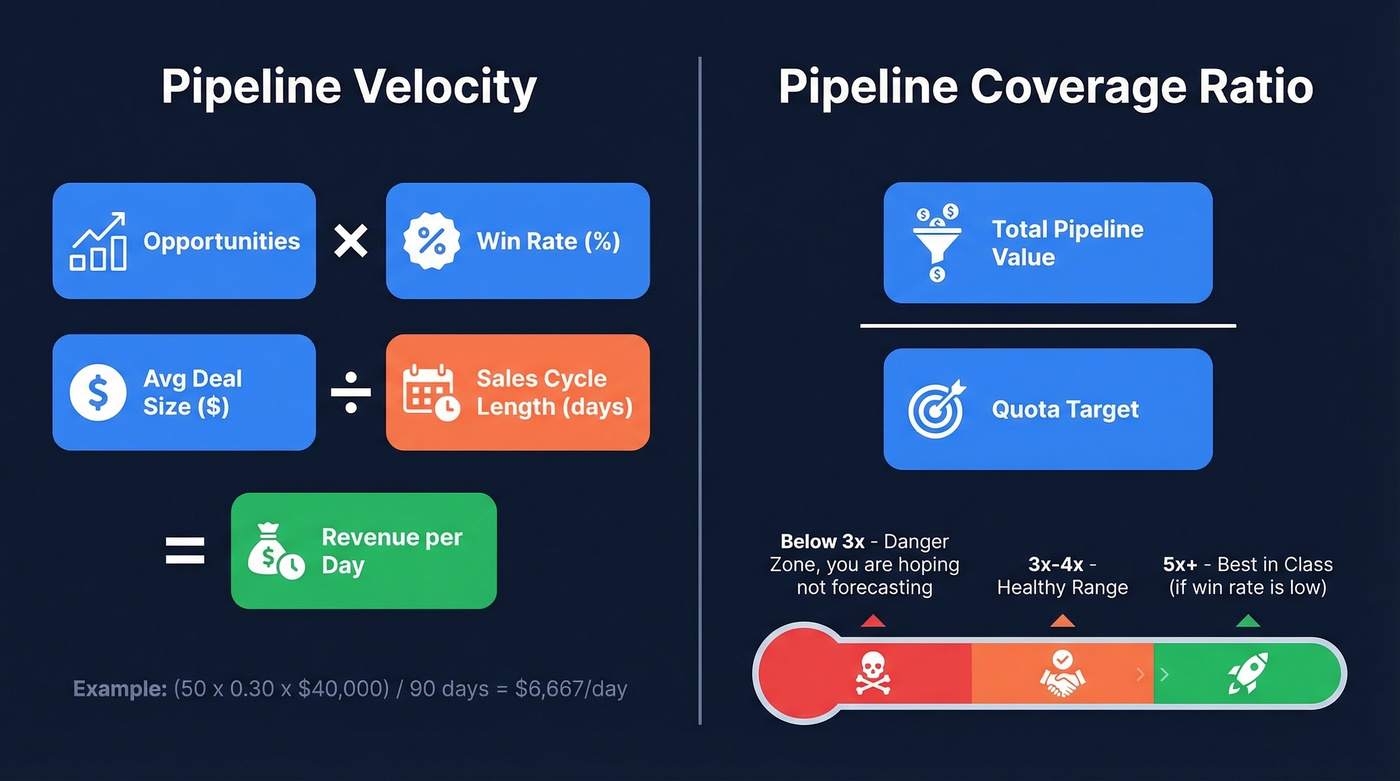
Two formulas worth memorizing. Pipeline velocity = (Opportunities x Win Rate x Avg Deal Size) / Sales Cycle Length. Pipeline coverage = Pipeline Value / Quota Target. A coverage ratio above 3:1 signals healthy pipeline - below that, you're hoping, not forecasting.
The speed-to-lead row deserves special attention. One practitioner shared that leads not contacted within 7 days had roughly a 5% conversion rate - after tightening follow-up cadence, their team saw conversion jump 35%. No new tool, no new hire. Just faster response built on data they already had.
Why Your Forecast Is Probably Wrong
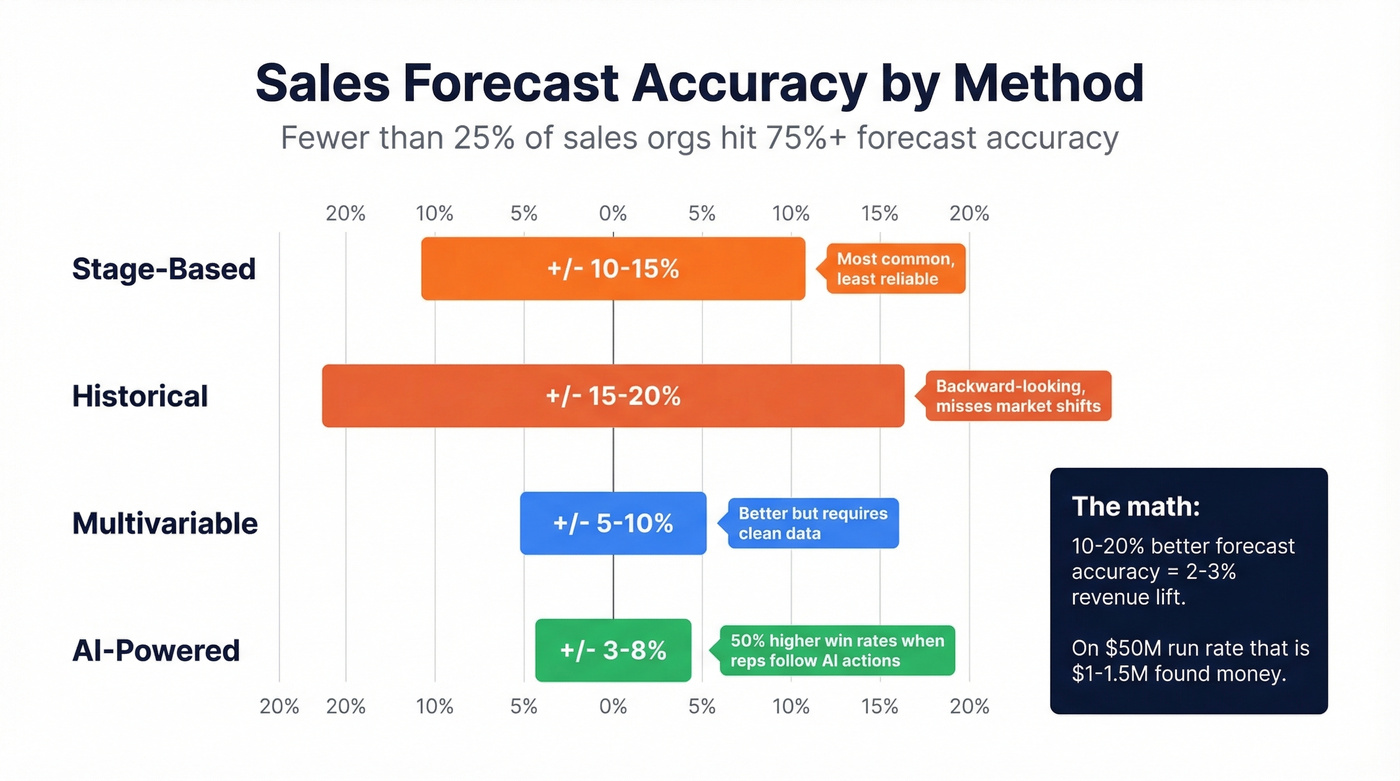
Fewer than 25% of sales orgs achieve 75%+ forecast accuracy. That's a staggering number when you consider how much headcount planning, cash flow management, and board reporting depends on the forecast being right.
| Forecasting Method | Typical Accuracy |
|---|---|
| Stage-based | +/-10-15% |
| Historical | +/-15-20% |
| Multivariable | +/-5-10% |
| AI-powered | +/-3-8% |
The AI numbers are real. Gong Labs analyzed over 1M deals across 1,418 sales orgs and found win rates jumped 50% when reps completed all AI-recommended action items. These recommendations - surfaced automatically based on deal signals - are what separate modern forecasting from spreadsheet guesswork.
Industry benchmarks suggest that improving forecast accuracy by 10-20% yields a 2-3% revenue increase. On a $50M run rate, that's $1-1.5M you're leaving on the table.
The Operating Cadence That Holds It Together
An analytics-rich org without a cadence is just a team with nice charts. We've seen this pattern across dozens of sales orgs: the data exists, but nobody built the rhythm to act on it.
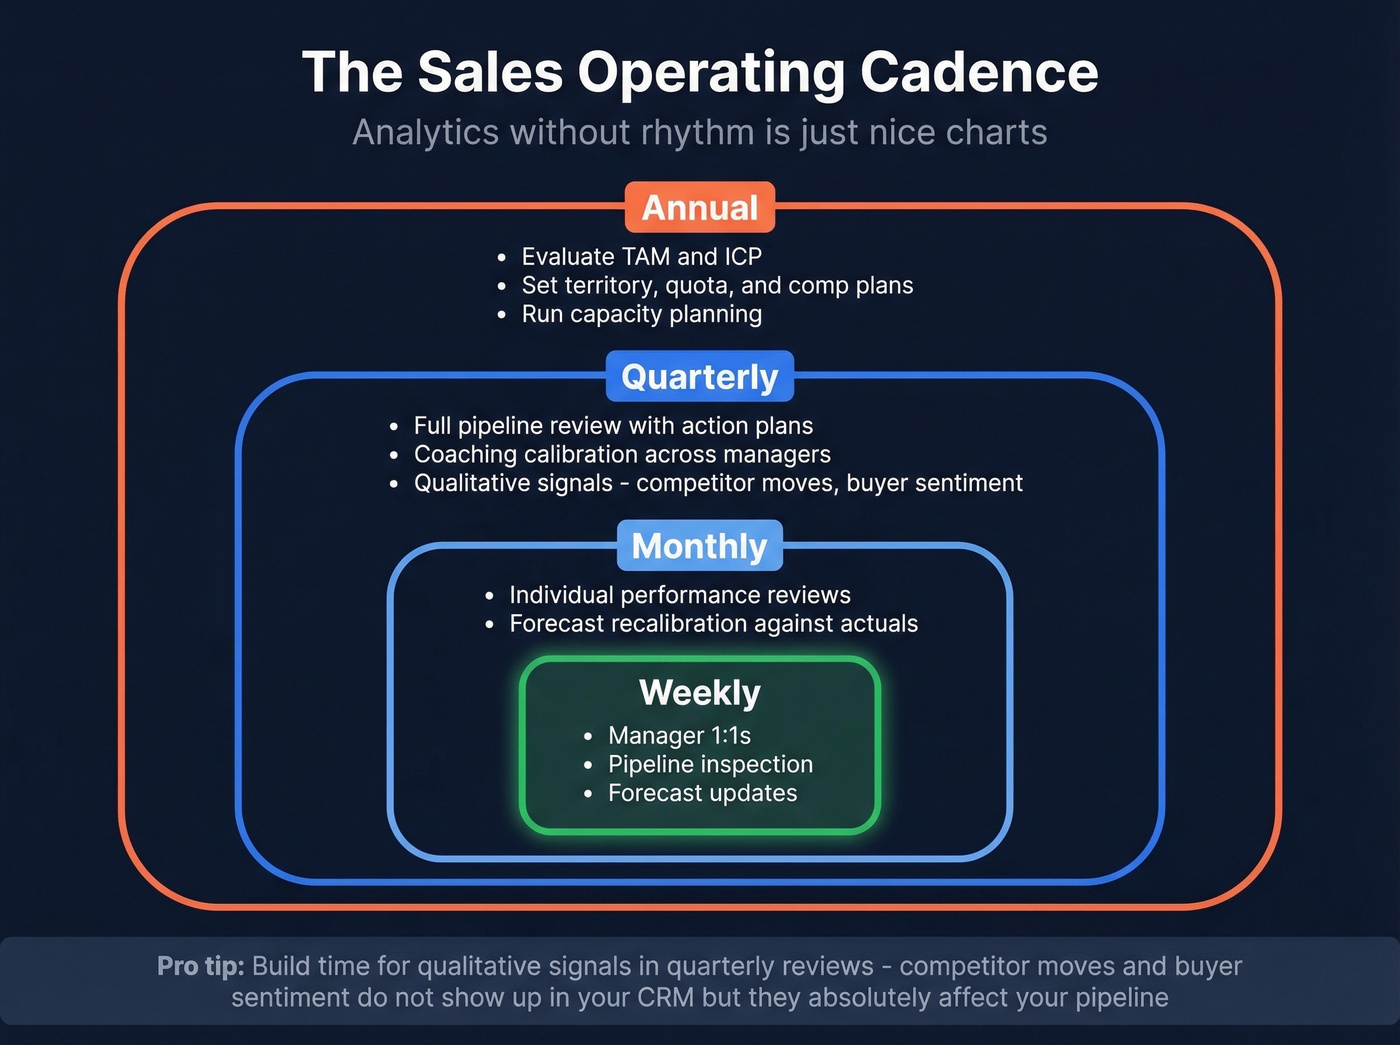
- Annual: Evaluate TAM/ICP. Set territory, quota, and comp plans. Run capacity planning.
- Quarterly: Full pipeline review with action planning. Capacity recalibration. Coaching calibration across managers - use this time to identify winning patterns that top performers share.
- Monthly: Individual performance reviews. Forecast recalibration against actuals.
- Weekly: Manager 1:1s. Pipeline inspection. Forecast updates.
One thing most cadence frameworks miss: qualitative signals matter alongside hard metrics. Competitor moves, buyer sentiment shifts, market perception changes - these don't show up in your CRM but absolutely affect your pipeline. Build time for them in quarterly reviews.
You just read that most reps ignore dashboards because they don't trust the underlying data. That trust problem starts with contact data. Prospeo's 5-step verification delivers 98% email accuracy and 30% mobile pickup rates - refreshed every 7 days, not every 6 weeks. Clean data in, clean decisions out.
Data-driven sales management starts with data you can actually trust.
Diagnosing a Broken Sales Org
It's Monday morning. You open your pipeline dashboard and see $2.4M in coverage against a $600K quota. Looks healthy. Then you dig in: 40-60% of those deals haven't moved stages in weeks. Your top two reps carry 70% of attainment. Stage definitions differ by rep - one AE's "discovery" is another's "negotiation." Sound familiar?
Red flags to watch for:
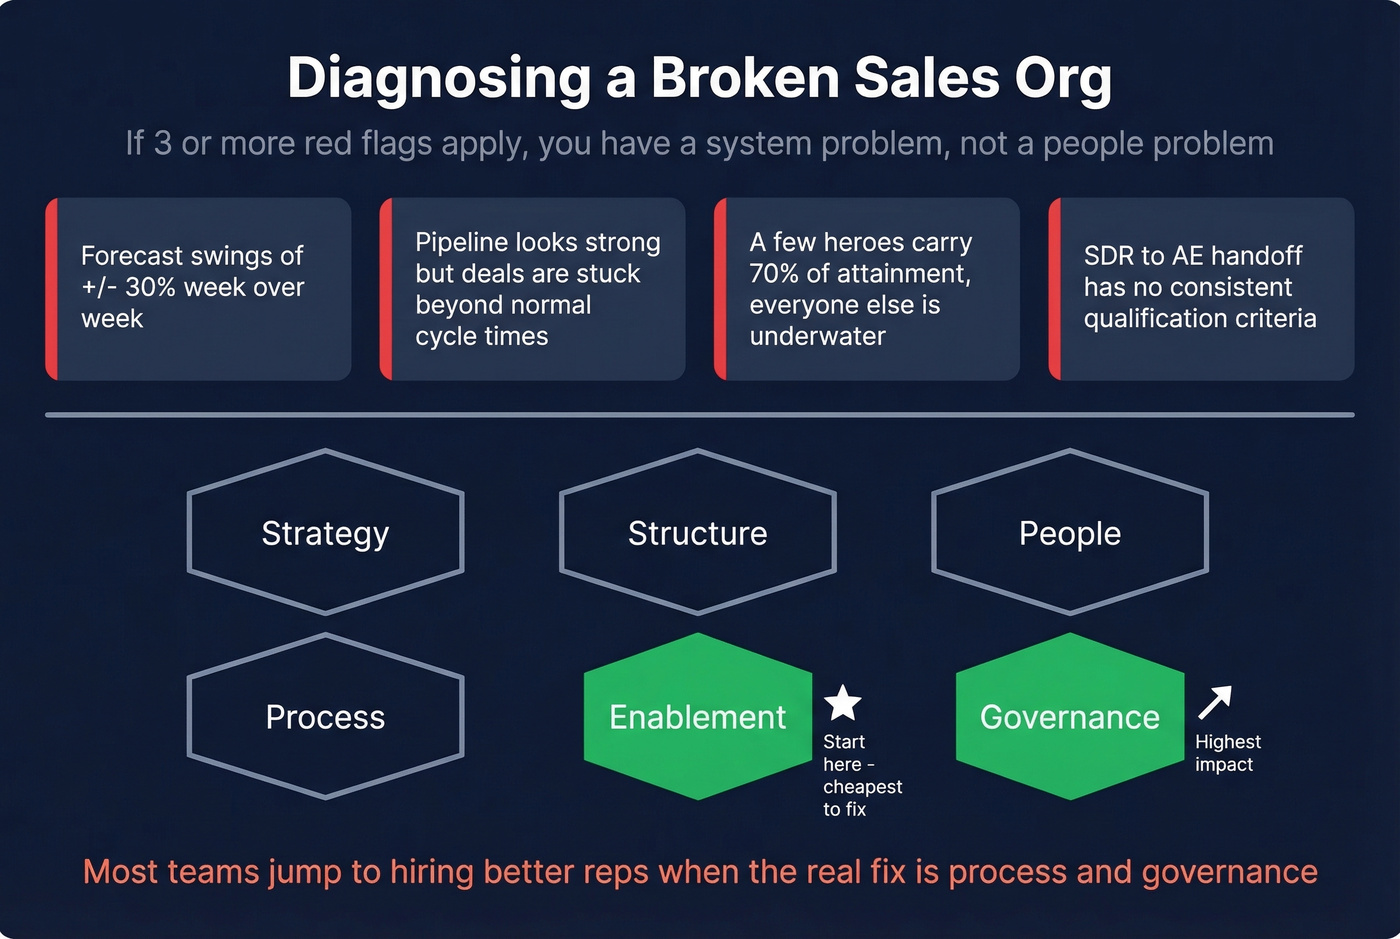
- Forecast swings of +/-30% week over week
- Pipeline coverage looks strong but deals are stuck beyond normal cycle times
- Attainment is lumpy - a few heroes, everyone else underwater
- SDR-to-AE handoff has no consistent qualification criteria
If three or more apply, you don't have a people problem. You have a system problem.
Most teams jump straight to "hire better reps" when the real issue is process and data governance. A useful diagnostic covers six levers: Strategy, Structure, People, Process, Enablement, and Governance. Start with the last two - they're cheapest to fix and have the highest impact.
Why Sales Analytics Programs Fail
The problem isn't usually the data. It's the decision model sitting on top of it. BYU research identifies four pitfalls that map directly to sales orgs: assuming more data is better, not asking the right questions, failing to connect data across silos, and focusing on the wrong metrics entirely.
A Forbes piece tells the story of a manager who offloaded leased railcars based on solid data but failed to factor future demand - costing millions. Good data, wrong decision model.
Tool fatigue compounds the problem. When teams layer analytics platforms on top of disconnected data sources, they get conflicting dashboards instead of clarity. The consensus on r/sales tends to agree: most reps ignore dashboards entirely because they don't trust the underlying data, and honestly, they're often right not to.
Here's the thing: if your average deal size is under $25K, you probably don't need an enterprise analytics stack. You need five clean metrics, a weekly cadence, and contact data you can trust. Everything else is procrastination disguised as strategy.
The 90-Day Implementation Plan
Phase 1: Align and Understand (Weeks 1-4)
Audit CRM data quality. Enforce stage exit criteria so "opportunity" means the same thing for every rep. Define your 5-7 core KPIs and assign ownership. This is also where you set smarter sales goals using historical close rates and pipeline velocity - not arbitrary round numbers from the board.
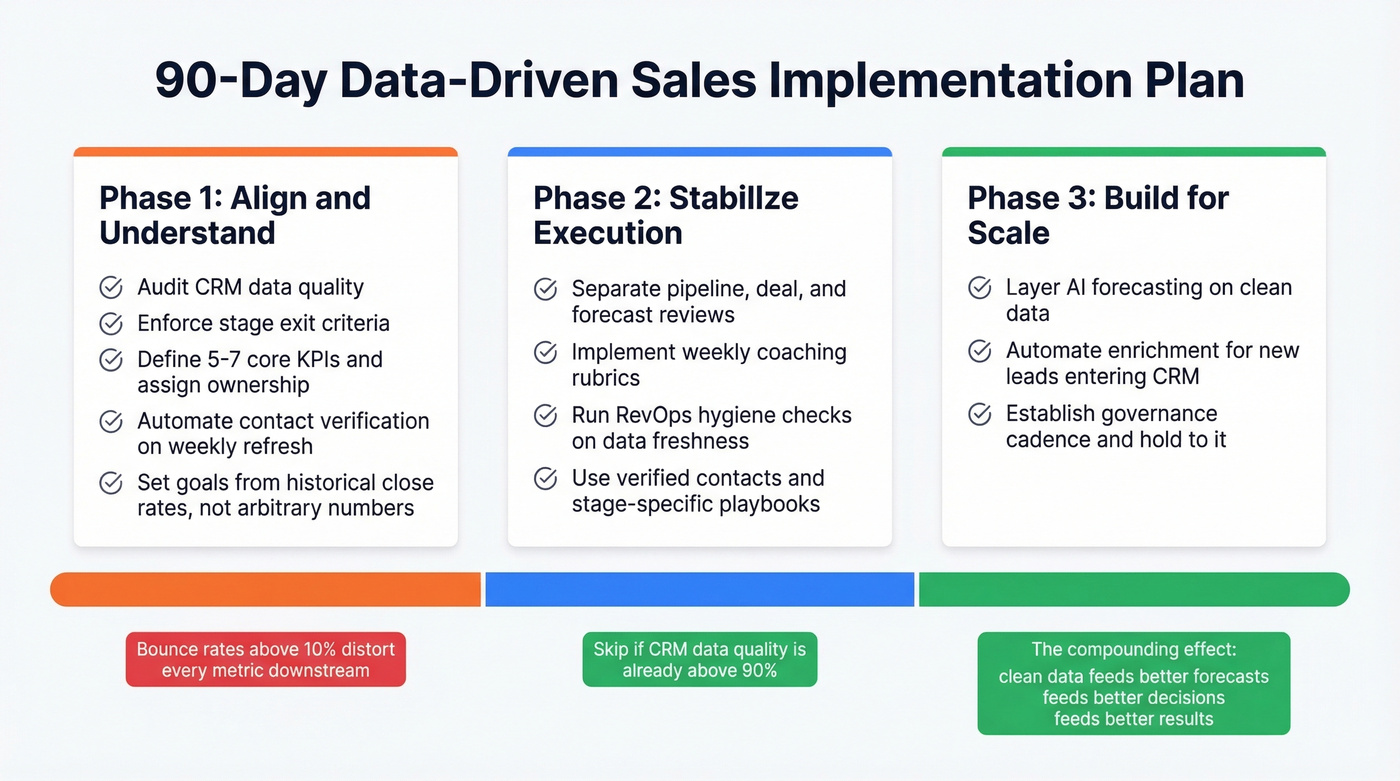
Automate contact verification and enrichment so your CRM stays clean on a weekly refresh cycle, not a quarterly manual scrub. We've found that bad contact data is the single most common reason pipeline metrics look wrong - bounce rates above 10% distort every conversion metric downstream.
Phase 2: Stabilize Execution (Weeks 5-8)
Separate pipeline reviews, deal reviews, and forecast reviews into distinct meetings. Implement weekly coaching rubrics. Get RevOps running hygiene checks on data completeness and freshness. At this stage, reps should be using verified contact data and stage-specific playbooks to drive consistent execution across the team.
Skip this phase if your CRM data quality is already above 90% completeness - jump straight to Phase 3 and start layering intelligence on top.
Phase 3: Build for Scale (Weeks 9-12)
Layer AI forecasting on top of your now-clean data. Automate enrichment workflows so new leads enter the CRM verified. Establish the governance cadence from the earlier section and hold to it. This is where the compounding effect kicks in - clean data feeds better forecasts, which feed better decisions, which feed better results.
Tools That Enable Data-Driven Sales
No tool fixes a broken process, but the right stack makes a good process scalable. Roughly 73% of sales orgs struggle to extract meaningful insights fast enough - and the bottleneck is usually data quality, not analytics horsepower.
| Tool | Category | Starting Price |
|---|---|---|
| Prospeo | Data Quality and Enrichment | Free tier; ~$0.01/email |
| Salesforce | CRM | $25/user/mo |
| HubSpot | CRM | Free; Sales Hub from ~$20-$25/user/mo |
| Pipedrive | CRM | $14/user/mo |
| Gong | Conversation Intelligence | ~$1,200-$1,800/user/year |
| Tableau | Analytics / BI | $15/user/mo |
| Zoho Analytics | Analytics | $24/mo |
Let's be honest about where most data-driven sales programs actually break down. Your SDR team booked 47 meetings last month. Only 8 converted - and 3 were disqualified because the contact had left the company months ago. This is the "garbage in" problem, and it's more common than anyone admits. Enterprise analytics platforms cost $25K-75K/year. Fixing your contact data with a tool like Prospeo - which runs 98% email accuracy on a 7-day refresh cycle across 143M+ verified emails - costs a fraction of that and has a bigger impact on your metrics.
If you’re comparing vendors, start with a shortlist of data enrichment services and validate accuracy on your own sample.
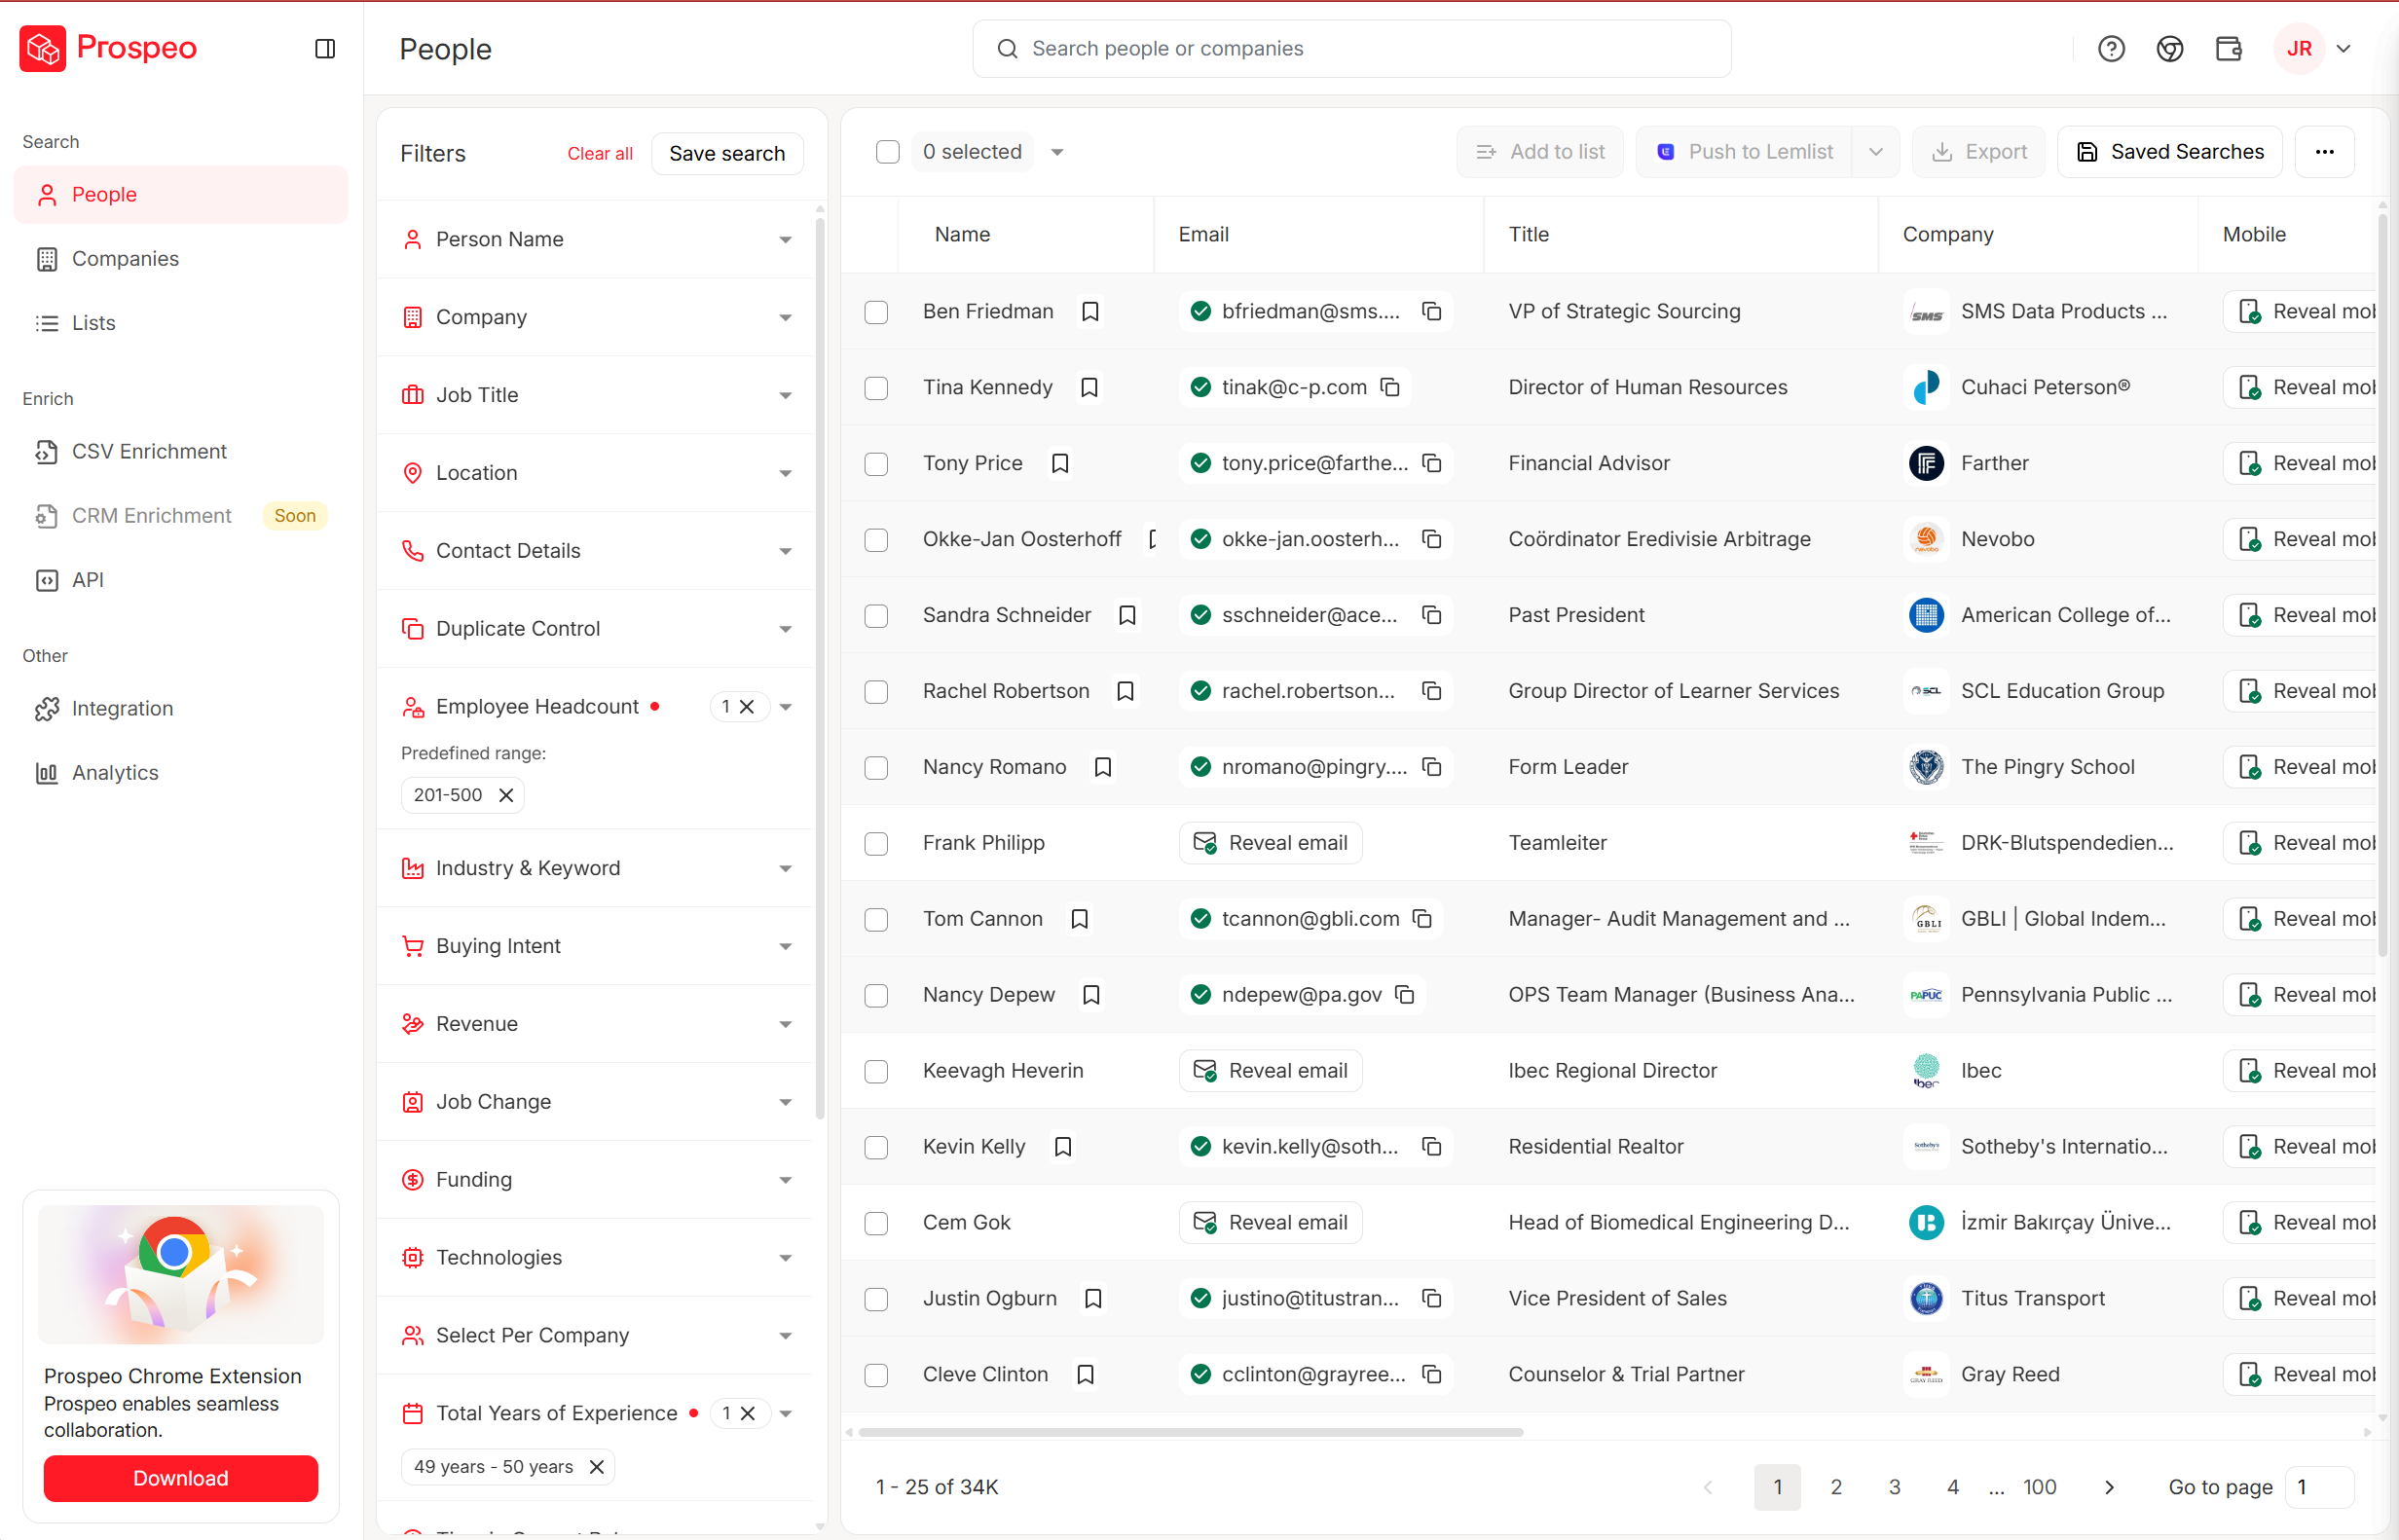
Your 90-day plan won't survive Phase 1 if your CRM is full of stale contacts. Prospeo enriches your pipeline with 50+ data points per contact at a 92% match rate - plus intent signals across 15,000 topics so your reps prioritize buyers who are actually in-market.
Stop diagnosing a broken org with broken data. Enrich your CRM today.
FAQ
What's the difference between data-driven and data-informed sales management?
Data-driven means decisions default to what the data says - you need a documented reason to override it. Data-informed means data is one input among many, and intuition still drives the final call. Most teams claim the first but practice the second.
How many KPIs should a sales team track?
Five to seven, max. Track pipeline coverage, win rate, cycle length, conversion rates, and forecast accuracy consistently before adding more. Dashboard overload kills adoption faster than bad data.
How does data improve sales conversations?
When reps enter calls armed with verified contact details, firmographic context, and deal-stage history, they replace generic pitches with tailored messaging. They can reference specific pain points, cite relevant case studies, and adjust pricing discussions - all because the data told them what matters to that buyer before the call started.
What's the fastest way to improve sales data quality?
Start with contact data. If your CRM is full of stale emails and dead phone numbers, every downstream metric is unreliable. Automate verification and enrichment on a weekly refresh cycle so the most common source of dirty pipeline data gets fixed before it reaches your dashboard or your forecast.