Demand Generation Funnel Metrics: What to Track, What to Ignore, and What Good Looks Like
You built the dashboard. Fourteen cards, six charts, a waterfall that updates every hour. Nobody looks at it - not the CRO, not the board, not even your own team. The problem isn't a lack of demand generation funnel metrics. It's that most dashboards track activity instead of outcomes, and the gap between the two is where revenue forecasts go to die.
Measurement is hard because 92% of buyers already have a vendor in mind when they start researching, the average B2B buying cycle runs 10.1 months, and 95% of your addressable market isn't buying right now. Most of the journey happens before your CRM knows a contact exists - across 18+ touchpoints and four to five channels. The metrics that matter aren't the ones measuring what you can see. They're the ones that predict what's coming.
What You Need (Quick Version)
Short on time? Track these three and ignore everything else until they're dialed in:
- Pipeline velocity - combines opportunities, deal size, win rate, and cycle length into one number that tells you whether the engine is accelerating or stalling.
- MQL-to-SQL conversion rate - the handoff metric. If this is broken, nothing downstream matters.
- CAC payback period - how long it takes to recoup acquisition cost. Twelve months is strong. Eighteen-plus is a problem.
Pair these with qualitative signals. Have sales record "how did you hear about us?" on every discovery call. CRM attribution misses the dark funnel. Humans don't.
B2B Marketing Funnel Metrics by Stage
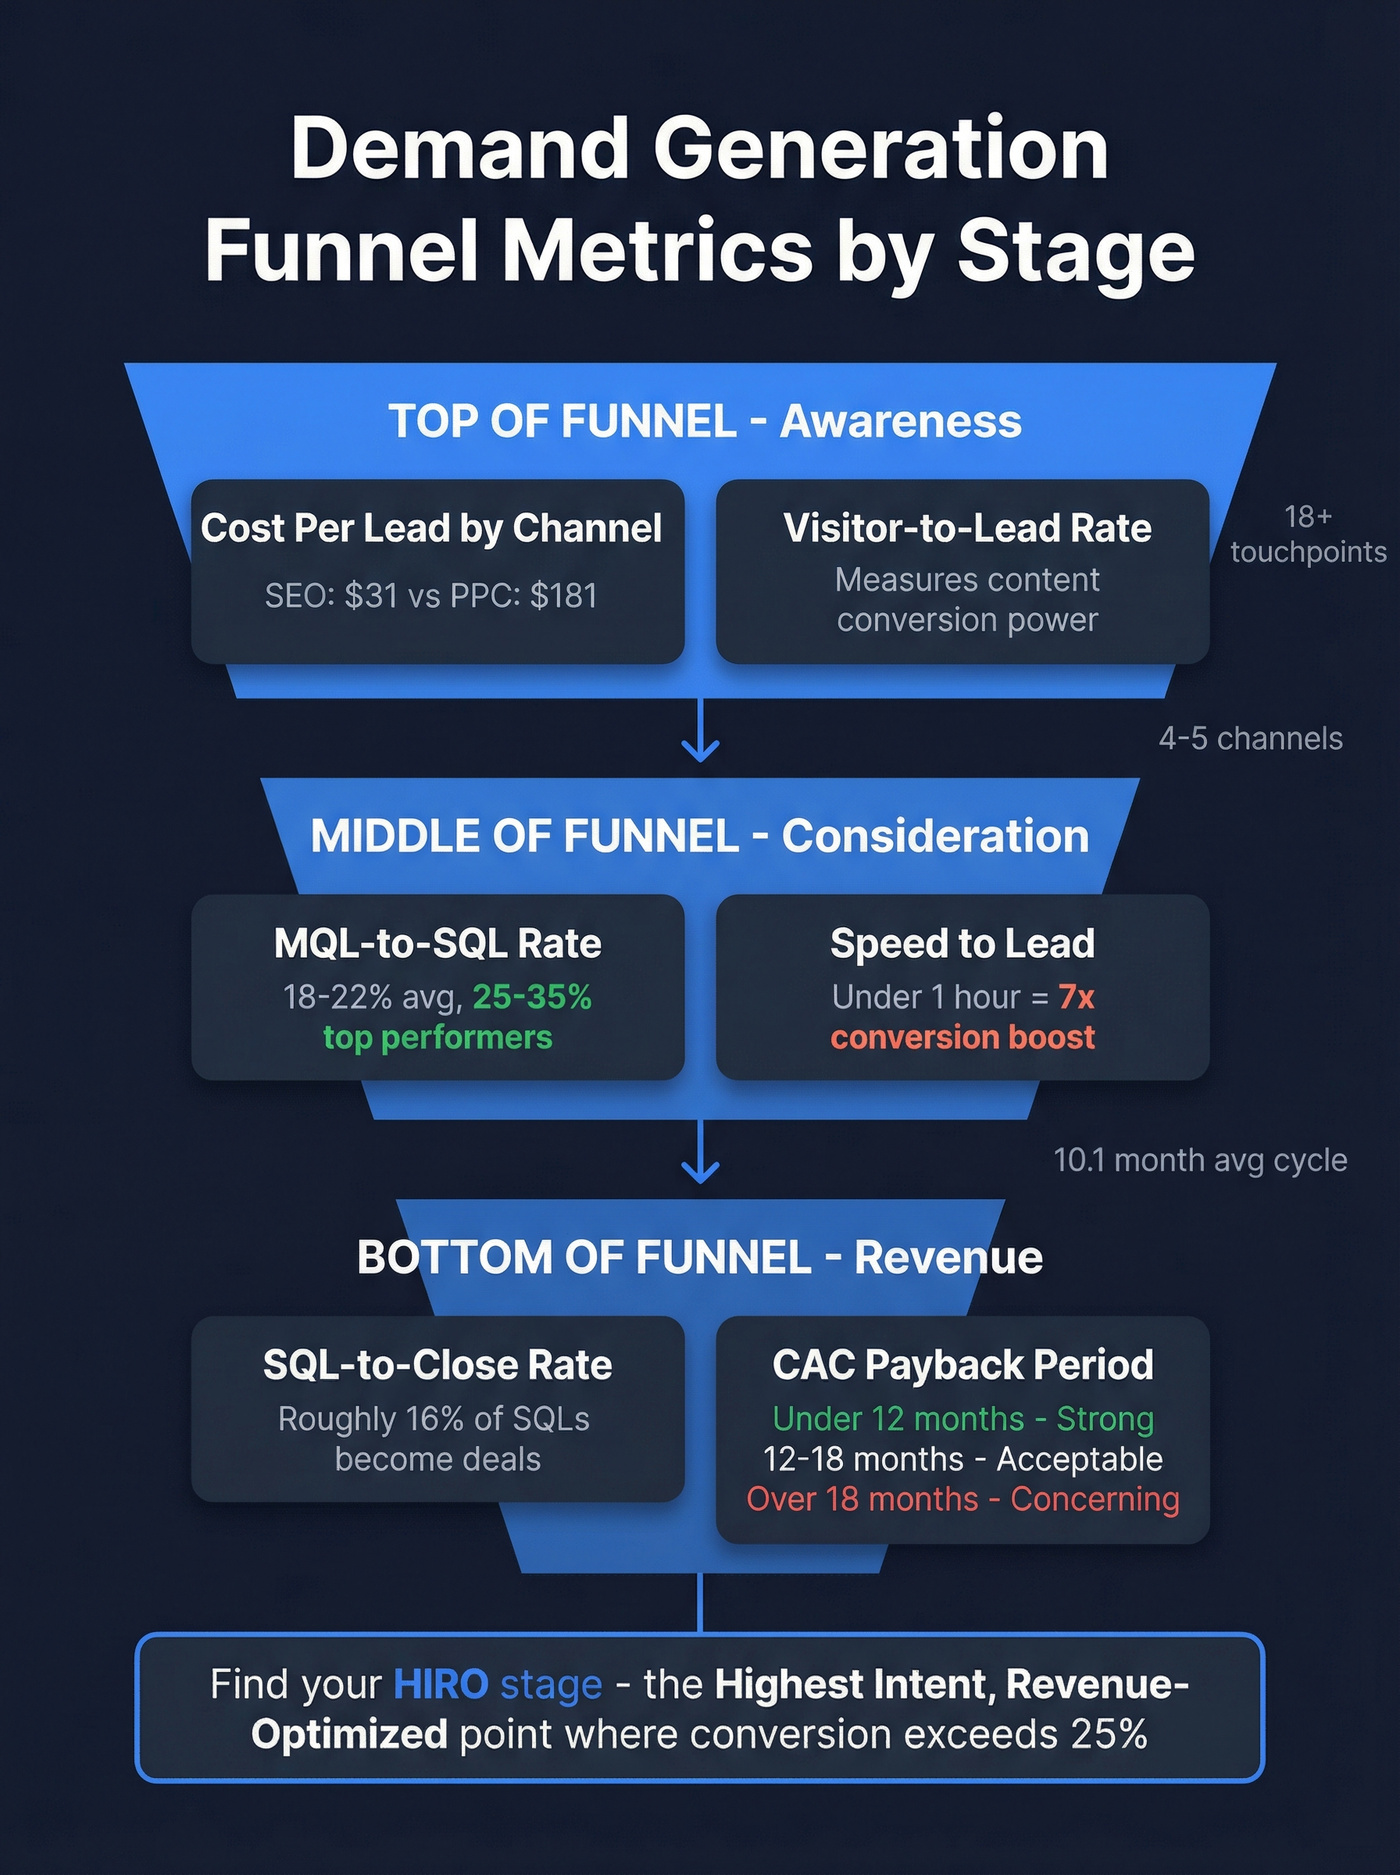
Top of Funnel (Awareness)
Two numbers matter here: cost per lead by channel and visitor-to-lead conversion rate. CPL tells you where your budget is efficient. Visitor-to-lead tells you whether your B2B content actually converts traffic. Getting these top-of-funnel metrics right is critical because every downstream number depends on the quality of what enters the pipeline.
| Channel | CPL | MQL-to-SQL Rate |
|---|---|---|
| SEO | $31 | ~51% |
| $53 | ~46% | |
| Webinars | $72 | ~30% |
| Content marketing | $92 | - |
| PPC | $181 | ~26% |
| Trade shows | $811 | - |
SEO leads cost a fraction of PPC and convert to SQLs at roughly double the rate. If you're over-allocating budget to paid search while under-investing in content, these numbers should make you uncomfortable.
Middle of Funnel (Consideration)
MQLs are a vanity metric unless you track what happens after the handoff. The average MQL-to-SQL conversion sits at 18-22% across B2B SaaS. Top performers hit 25-35%. Below 10%? The problem is usually one of three things: your lead scoring is too loose, your ICP definition is off, or sales isn't following up fast enough.
Speed-to-lead matters more than most teams realize. Responding to high-intent MQLs within the first hour can increase conversion probability up to 7x. Yet most teams measure response time in days, not minutes.
Here's the nuance: Gartner found that buyers who use digital tools alongside a rep are 1.8x more likely to complete a high-quality deal. The handoff isn't just about speed - it's about meeting the buyer where they already are in their research. For account-based motions, track AQA-to-SQA rate. Above 20% signals strong intent and good targeting. Below that, your account selection criteria need work.
Bottom of Funnel (Revenue)
SQL-to-opportunity conversion averages ~42% for small-to-mid B2B SaaS teams. Opportunity-to-close averages ~39%. Multiply those together and roughly 16% of SQLs become closed-won deals. That's normal - don't panic if your numbers land in that range.
The metric that ties it together at the bottom is CAC payback period:
- Under 12 months - strong. You're recovering acquisition cost quickly and can reinvest.
- 12-18 months - acceptable, especially for enterprise deals with high LTV.
- Over 18 months - concerning. Either your CAC is inflated or your deal sizes are too small to justify the spend.
Let's be honest about something most demand gen content won't say: total pipeline volume is a distraction. We've found it far more useful to identify what we call the HIRO stage - the Highest Intent, Revenue-Optimized point in your funnel where conversion rates exceed 25%. Find that stage, optimize everything upstream to feed it, and you'll move revenue faster than chasing MQL volume ever will.
You just read that 60% of brands don't measure the cost of bad data - and it corrupts every funnel metric downstream. Prospeo's 5-step verification delivers 98% email accuracy and sub-4% bounce rates, so your CPL, MQL-to-SQL rates, and pipeline velocity reflect reality, not noise.
Stop optimizing a funnel built on dirty data.
Pipeline Velocity: The One Metric That Matters
Pipeline Velocity is the single most important metric in your demand gen toolkit. If you track only one number, track this one.
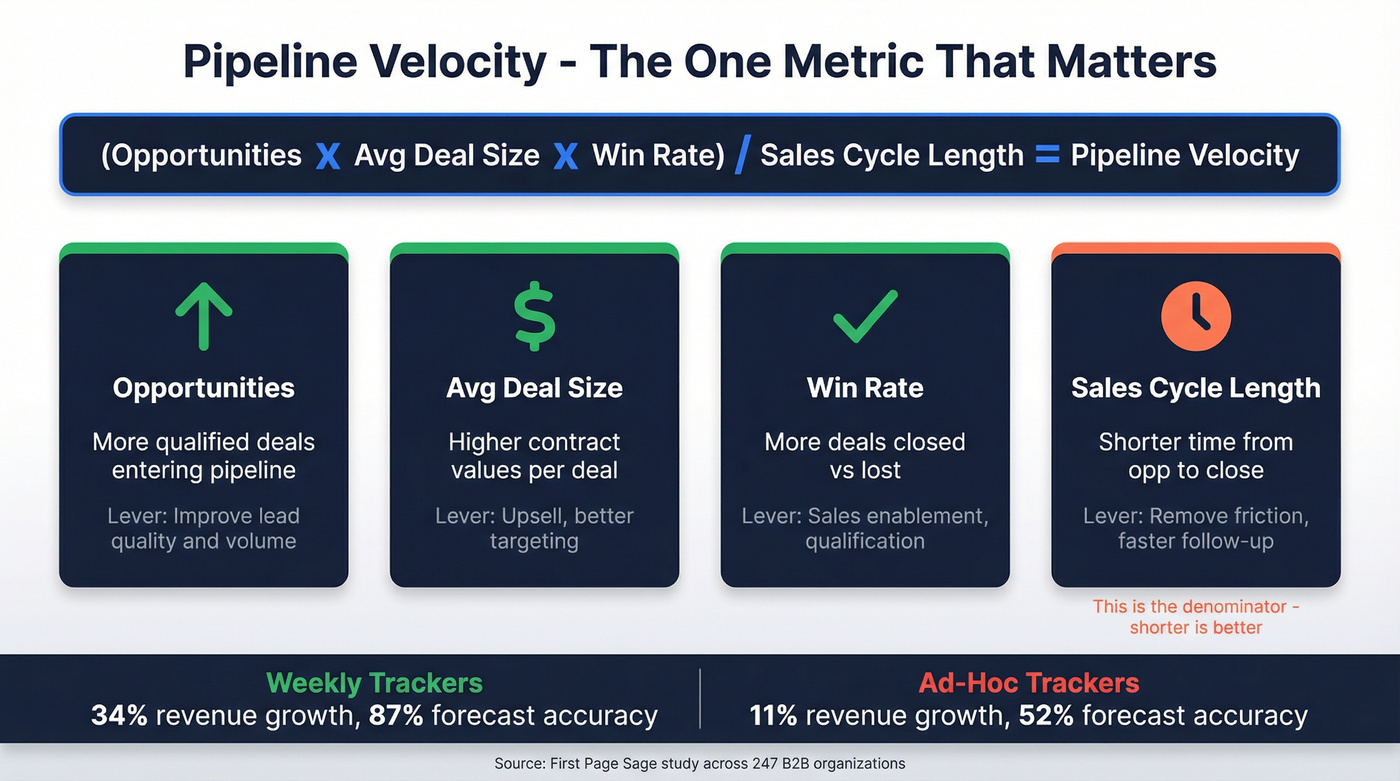
Pipeline Velocity = (# of Opportunities x Avg Deal Size x Win Rate) / Avg Sales Cycle Length
What makes it powerful is that it combines four levers into one diagnostic. A drop in velocity tells you something's broken. The formula tells you which lever to pull. Among all marketing pipeline metrics, velocity is unique because it's forward-looking - it tells you where revenue is headed, not where it's been.
Benchmarks from a First Page Sage study across 247 B2B organizations:
| Industry | Deal Size | Win Rate | Cycle (days) | Velocity ($/day) |
|---|---|---|---|---|
| SaaS & Tech | $12,400 | 22% | 67 | $1,847 |
| Financial Services | $31,200 | 18% | 89 | $2,134 |
| Healthcare | $18,700 | 25% | 72 | $1,523 |
| Manufacturing | $47,800 | 19% | 124 | $1,289 |
| Real Estate | $89,300 | 16% | 147 | $2,456 |
Tracking frequency matters too. Companies that measure pipeline velocity weekly see 34% revenue growth rates and 87% forecast accuracy. Ad-hoc trackers? 11% growth and 52% accuracy. The discipline of looking at the number regularly forces the conversations that move it.
Velocity is a leading indicator, not a trailing one. A declining velocity is an early warning sign of future revenue misses - by the time closed-won numbers drop, it's already too late to fix the inputs.
Attribution: Pick a Model and Commit
The consensus on r/analytics is blunt: multi-touch attribution confidence is cratering. Privacy changes, fragmented journeys, and dark-funnel activity are making models less reliable, not more. And yet 60% of consumers take six or more actions before buying - so last-click attribution is basically fiction.
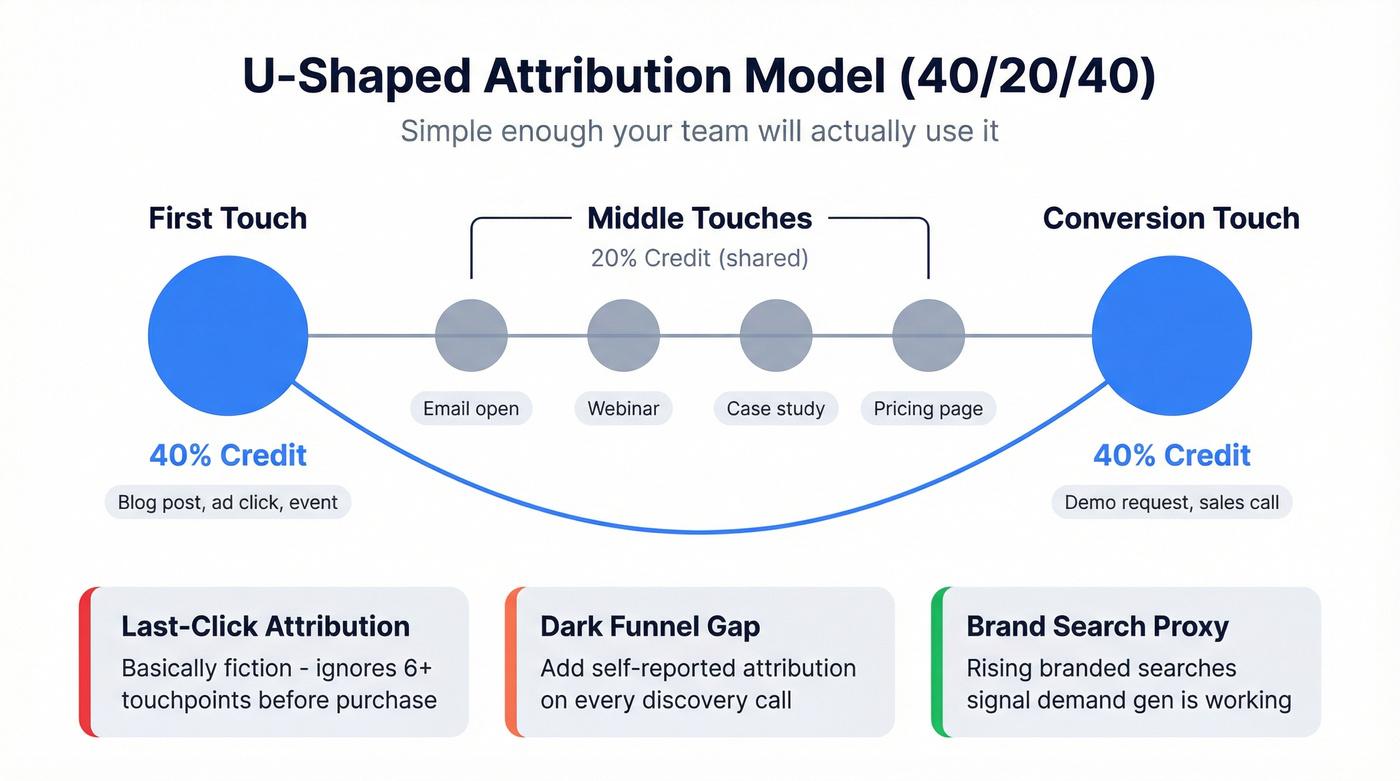
Start with U-shaped attribution (40/20/40). It's not perfect, but it's better than last-click, and it's simple enough your team will actually use it. First touch gets 40% credit, conversion touch gets 40%, everything in between shares 20%.
Complement any attribution model with self-reported attribution on every discovery call. Also track branded search volume as a dark funnel proxy: rising brand searches are one of the strongest signals that your demand gen is working, even when no click gets attributed.
Mistakes That Corrupt Your Metrics
Three measurement mistakes we see repeatedly.
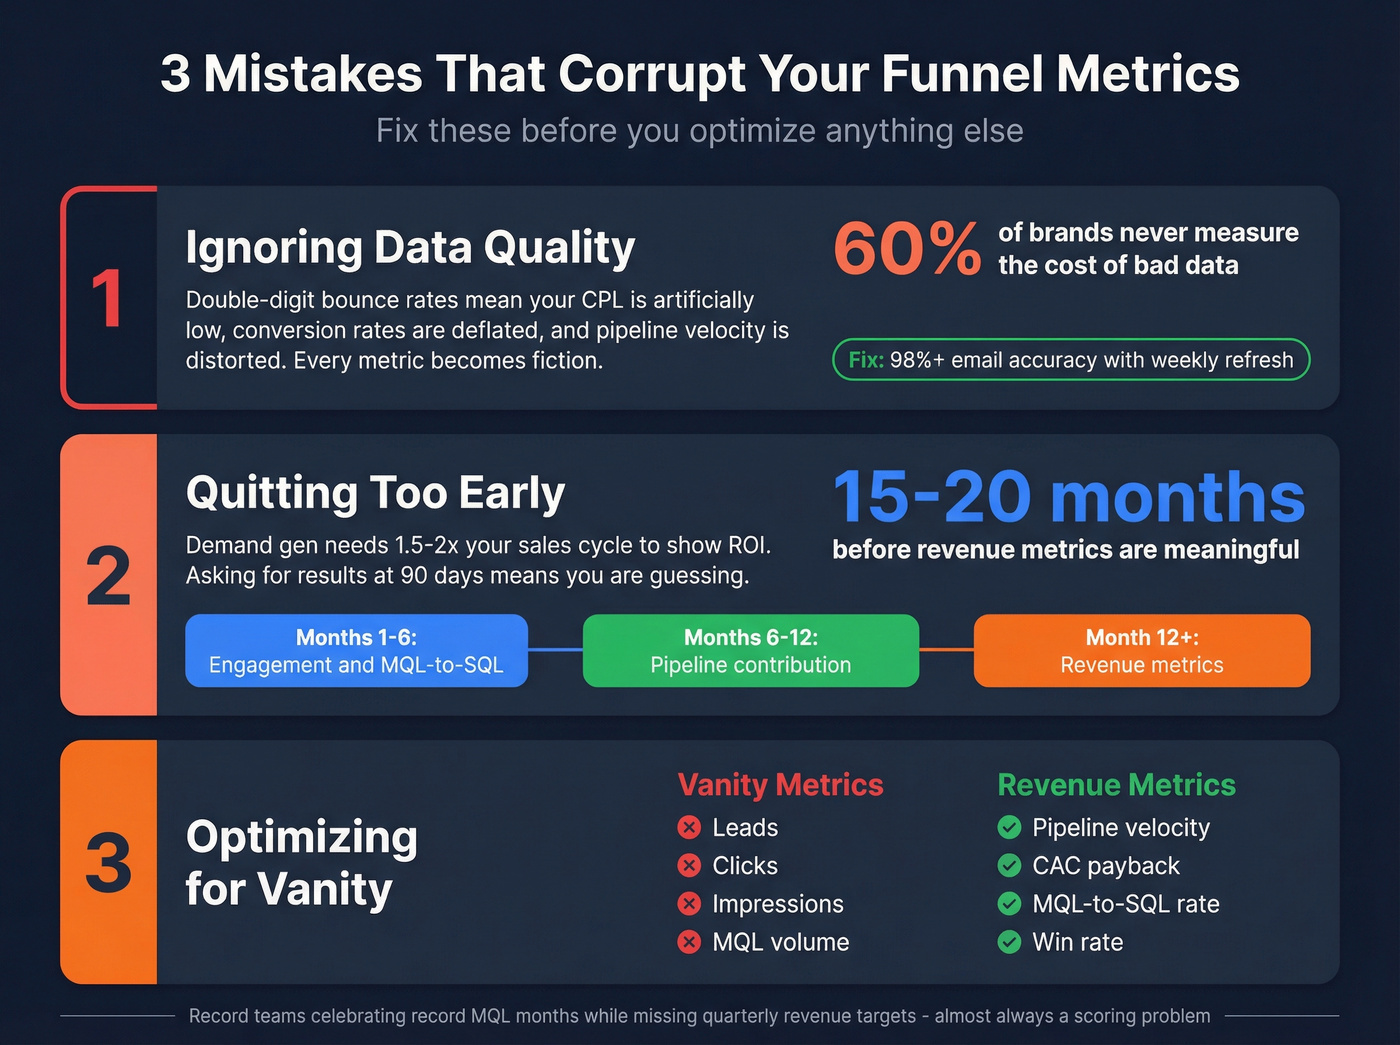
Ignoring data quality. 60% of brands don't measure the financial cost of poor-quality data. Your funnel metrics are only as accurate as your contact data. If your bounce rate is in the double digits, your CPL is artificially low, your conversion rates are deflated, and your pipeline velocity is distorted. This is where clean data infrastructure pays for itself - tools like Prospeo, with 98% email accuracy and a 7-day refresh cycle, keep the numbers you're tracking tied to real prospects instead of dead records. Without that foundation, every number on this page is fiction.

Quitting too early. Demand gen programs need 1.5-2x your average sales cycle before revenue metrics are meaningful. For a 10-month B2B cycle, that's 15-20 months. If leadership is asking "what's the ROI?" after 90 days, the answer is: you don't know yet, and anyone who says otherwise is guessing. Use a maturity model - track engagement and MQL-to-SQL rates in months 1-6, pipeline contribution in months 6-12, and revenue-tier metrics only after 12+ months.
Optimizing for vanity. Leads, clicks, impressions - these feel good in a weekly report but tell you nothing about revenue. The teams that win track pipeline velocity and CAC payback, not MQL volume. Strong B2B marketing funnel metrics always tie back to revenue impact, not activity volume. We've watched teams celebrate record MQL months only to miss their quarterly number because none of those leads were in-market. It's a frustrating pattern, and it's almost always a scoring problem.
Pipeline velocity depends on four levers - and the fastest one to fix is opportunity volume. Prospeo gives you 300M+ profiles with 30+ filters including buyer intent, job changes, and headcount growth, so you feed your funnel with in-market buyers instead of cold names.
Accelerate pipeline velocity at $0.01 per verified email.
FAQ
What are the most important demand generation funnel metrics?
Pipeline velocity is the single most diagnostic metric - it combines opportunities, deal size, win rate, and cycle length into one number that predicts revenue before it hits the books. Track it weekly alongside MQL-to-SQL conversion rate and CAC payback period for a complete picture.
How long before demand gen metrics show revenue impact?
Expect 1.5-2x your average sales cycle before revenue-tier numbers are meaningful. For a 10-month B2B cycle, that's 15-20 months. Use a tiered maturity approach: engagement metrics first, then pipeline contribution, then revenue attribution after month 12.
How does bad contact data affect funnel metrics?
Stale or unverified emails inflate your lead count while deflating conversion rates at every stage - making your entire dashboard unreliable. Verifying contacts with 98%+ accuracy on a weekly refresh cycle means your metrics reflect actual pipeline rather than phantom contacts that never had a chance of converting.
What's a good MQL-to-SQL conversion rate benchmark?
The B2B SaaS average sits at 18-22%, while top-performing teams hit 25-35%. Below 10% typically signals loose lead scoring, misaligned ICP definitions, or slow sales follow-up. Measure speed-to-lead alongside conversion rate - responding within one hour can boost probability up to 7x.