Email Click-Through Rate Benchmarks by Industry: 2026 Data From 7 Sources
You just pulled your quarterly email report and your CTR is 2.1%. Is that good? Terrible? Somewhere in between? The answer depends entirely on which benchmark report you're reading - and most of them don't agree with each other. We've pulled the actual data from seven sources and reconciled it so you can stop guessing and start comparing against numbers that actually mean something.
The Quick Version
The average email CTR across all industries lands between 2-4%, but the exact number shifts depending on who's reporting and how they define "click-through rate."
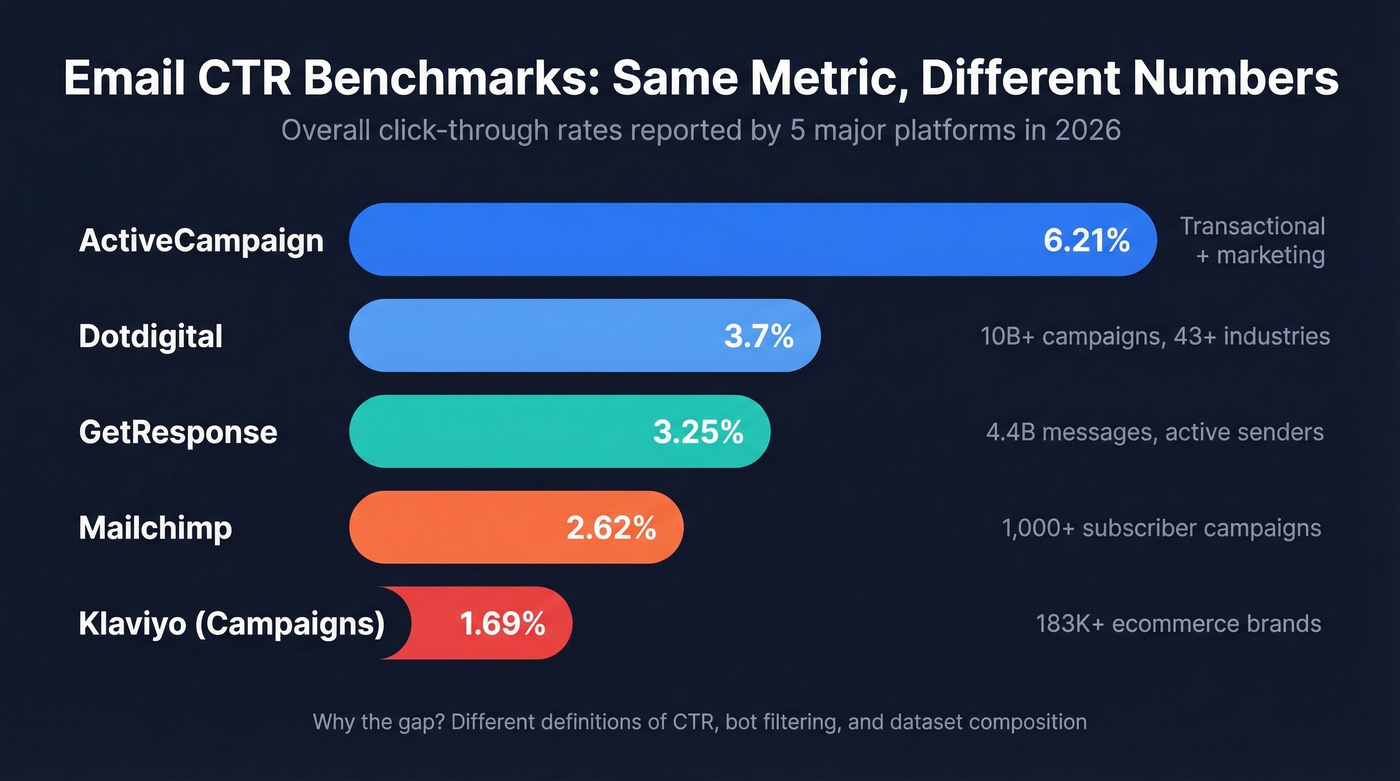
| Source | Overall CTR | Dataset |
|---|---|---|
| Mailchimp | 2.62% | Campaigns sent to at least 1,000 subscribers |
| Klaviyo | 1.69% (campaigns) / 5.58% (flows) | 183K+ ecommerce brands |
| GetResponse | 3.25% | 4.4B messages (active senders with 500+ contacts) |
| Dotdigital | 3.7% | 10B+ campaigns across 43+ industries, 5 continents |
| ActiveCampaign | 6.21% | 2026 customer campaigns (transactional + marketing) |
Automated flows deliver 3.3x higher CTR than campaigns. Email type matters more than industry. And if your CTR sits below 2%, list quality and deliverability are usually the first things to fix.
Why Every Report Disagrees
The gap between Klaviyo's 1.69% and ActiveCampaign's 6.21% isn't random. It's definitional chaos.
A HubSpot Community accepted solution defines "click-through rate" as clicks divided by opens - which most other platforms call CTOR (click-to-open rate). Mailchimp's own documentation says click rate and click-through rate are "technically the same metric," then describes click rate in a way that relates to opens elsewhere on the same page. When major platforms can't even agree on what "CTR" means, any cross-platform benchmark comparison turns into apples-to-oranges fast.
Then there's the bot problem. Klaviyo stopped including bot and machine clicks in reporting around September 2024, and practitioners saw sharp CTR drops overnight - not because their emails got worse, but because the measurement changed. If your CTR "dropped" in late 2024, check whether your ESP updated its filtering before you rewrite your subject lines.
Dataset composition matters too. Klaviyo skews ecommerce. GetResponse focuses on active senders with 500+ contacts. ActiveCampaign includes transactional emails, which naturally get higher engagement. We've seen teams panic over a "below average" CTR that was actually above average for their specific email type and audience. Knowing which dataset you're comparing against is half the battle.
CTR Data by Industry
Most "by industry" tables are platform-specific. Here are two solid ones from ESPs that publish industry breakdowns.
Mailchimp Click Rate Benchmarks
- Nonprofits: 3.27%
- Education + Training: 3.02%
- Business + Finance: 2.78%
- Ecommerce: 1.74%
- All Users (overall): 2.62%
ActiveCampaign Click Rate Benchmarks
ActiveCampaign reports an overall 6.21% average click rate across 2026 campaigns (including transactional and marketing):
- Blogger/Author: 7.73%
- Media/Publishing: 7.32%
- Consulting/Agency: 7.05%
- Online Training/Education: 6.38%
- E-Commerce/Retail: 5.07%
- Accounting/Financial: 4.40%
If you're above 3%, you're in solid shape for most lists. Dotdigital's 2026 Global Benchmark Report lines up with that, showing a 3.7% overall email CTR across 10B+ campaigns. Use these figures as directional guides, not absolute targets.
CTR by Email Type
Your email type matters more than your industry. Full stop.
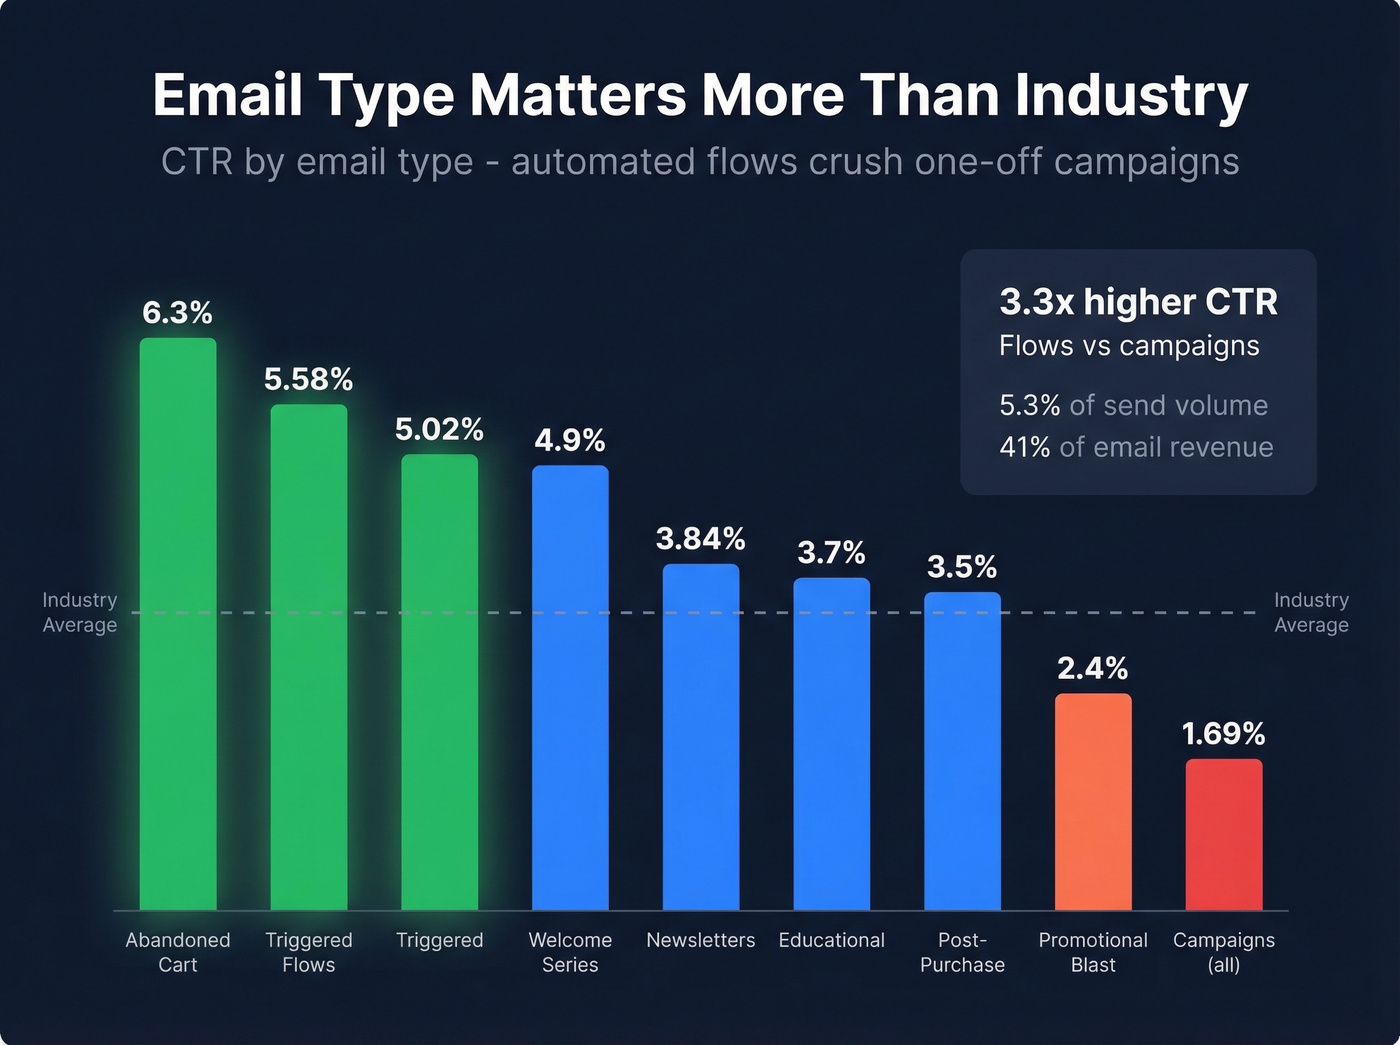
| Email Type | CTR | Source |
|---|---|---|
| Abandoned Cart | 6.3% | Enflow Digital |
| Welcome Series | 4.9% | Enflow Digital |
| Triggered | 5.02% | GetResponse |
| Newsletters | 3.84% | GetResponse |
| Educational | 3.7% | Enflow Digital |
| Post-Purchase | 3.5% | Enflow Digital |
| Promotional Blast | 2.4% | Enflow Digital |
| Campaigns (all) | 1.69% | Klaviyo |
The Klaviyo data tells the clearest story: flows deliver 5.58% CTR versus 1.69% for campaigns - a 3.3x gap. Flows represent just 5.3% of send volume but generate roughly 41% of total email revenue. Klaviyo also reports that AI product recommendations lift click rates to 3.75% on average, with top performers hitting 8.79%. If you're only sending campaigns and wondering why your CTR is low, that's your answer.
Flows beat campaigns 3.3x on CTR - but only if your emails actually land. Prospeo's 5-step verification catches spam traps, honeypots, and catch-all domains that tank deliverability. 98% accuracy means under 2% bounce rates from day one.
Fix your list quality first. Everything else follows.
B2B Email CTR
B2B lists are smaller and more targeted, which changes the math entirely.
A practical B2B range is 2.0-4.0% CTR. HubSpot's benchmarks put B2B open rate around 39.5%, with an average CTOR of 5.3% across all industries. Top-quartile B2B programs can hit 10%+ CTR, but those are highly segmented sequences to warm audiences, not cold outbound blasts. A 500-person ABM list and a 50,000-person newsletter aren't comparable, even if both are "B2B email."
B2B click rates tend to sit higher than B2C because of that tighter targeting - fewer recipients, but each one is more likely to care about what you're sending.
Trends and Regional Splits
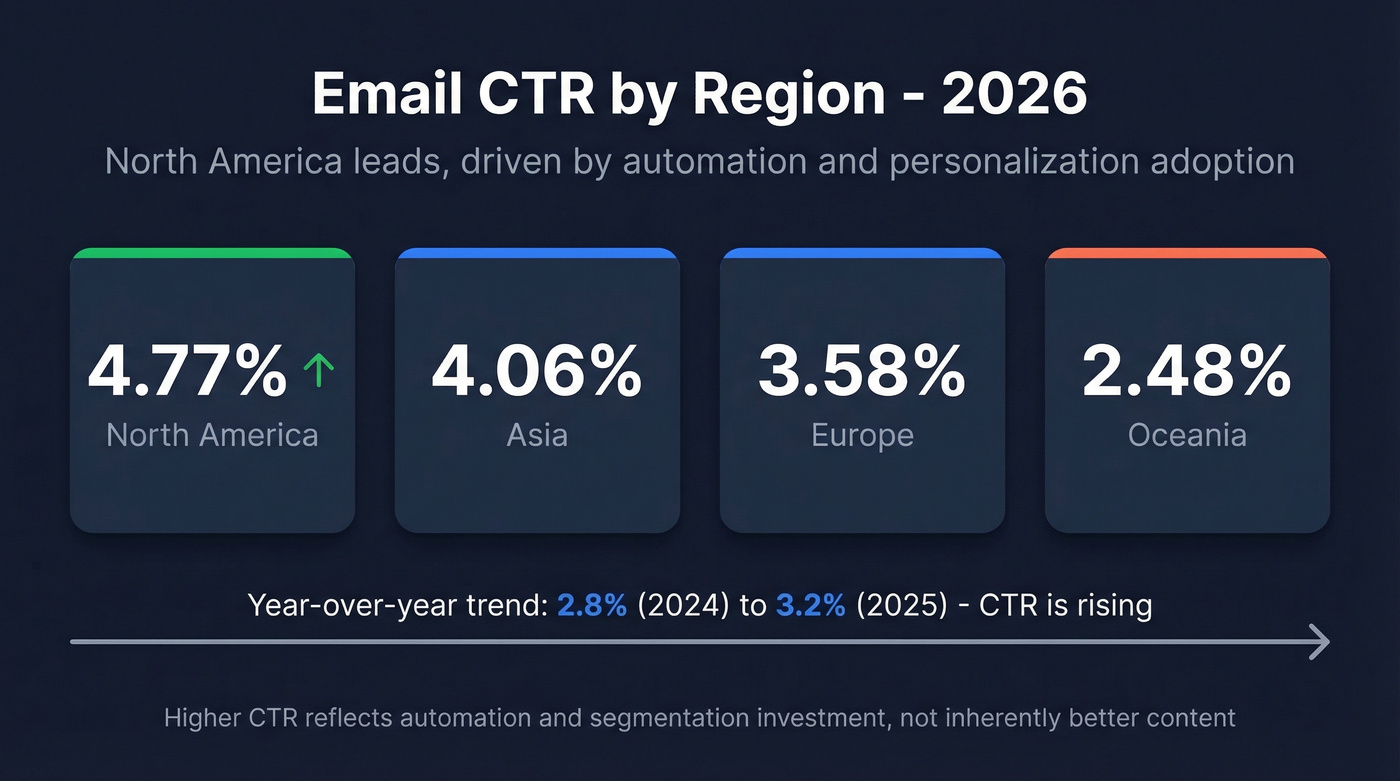
Year-over-year, CTR is trending up. One benchmark table shows 2.8% to 3.2% from 2024 to 2025, driven by better automation and tighter list hygiene.
Regional splits show meaningful variation:
| Region | CTR |
|---|---|
| North America | 4.77% |
| Asia | 4.06% |
| Europe | 3.58% |
| Oceania | 2.48% |
North America's higher CTR reflects more aggressive personalization and automation adoption, not inherently better content. In our experience, teams that invest in triggered flows and real-time segmentation consistently outperform those relying on batch-and-blast, regardless of where they're sending.
Beyond CTR
The consensus on r/DigitalMarketing is that CTR is becoming a vanity metric. They're not wrong.
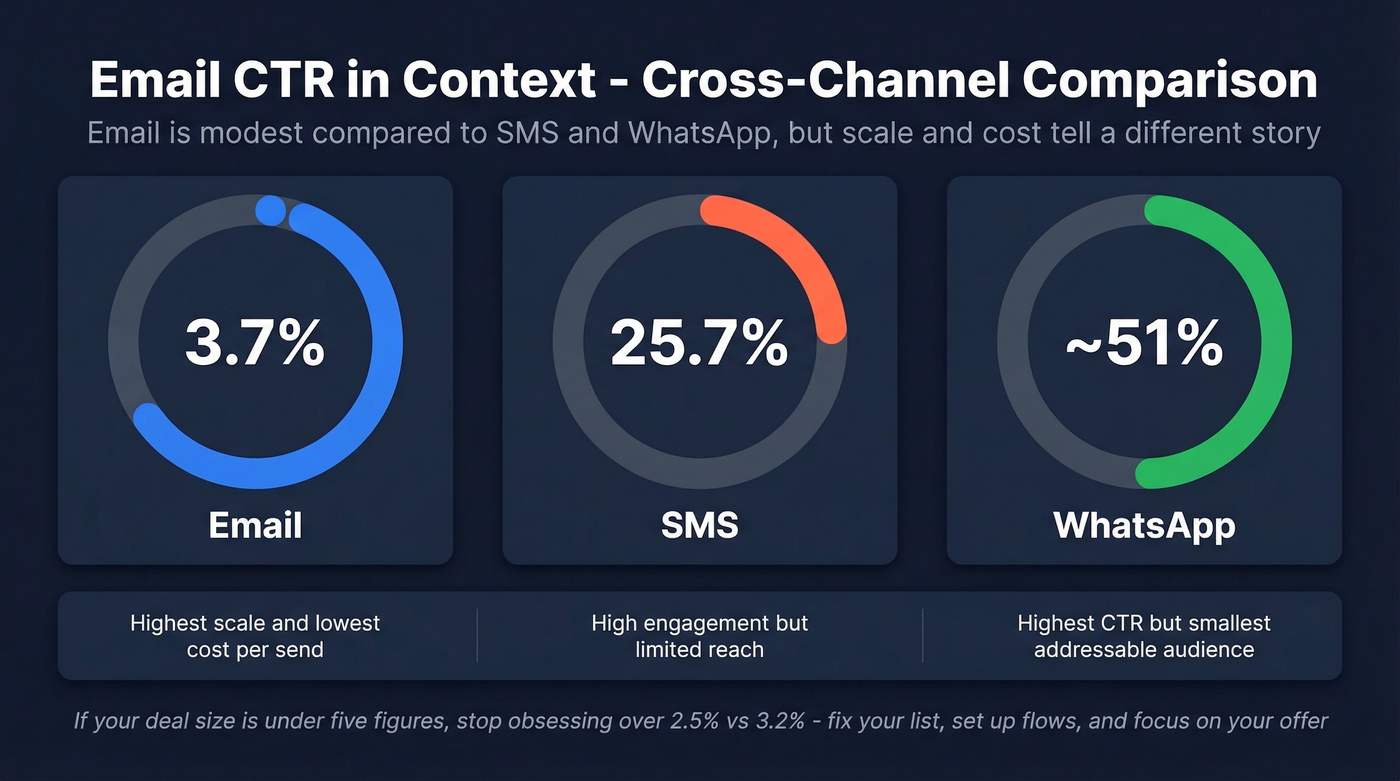
CTOR is a better signal for content quality because it strips out deliverability and subject-line performance - it only measures whether people who opened actually clicked. Revenue per email is the ultimate benchmark. And for cross-channel context, email's 3.7% CTR looks modest next to SMS at 25.7% and WhatsApp at roughly 51%.
Here's the thing: if your average deal size is under five figures and you're obsessing over CTR differences between 2.5% and 3.2%, you're optimizing the wrong thing. Fix your list quality, set up three automated flows, and spend the rest of your time on your offer.

How to Improve Your CTR
Four changes that actually work:
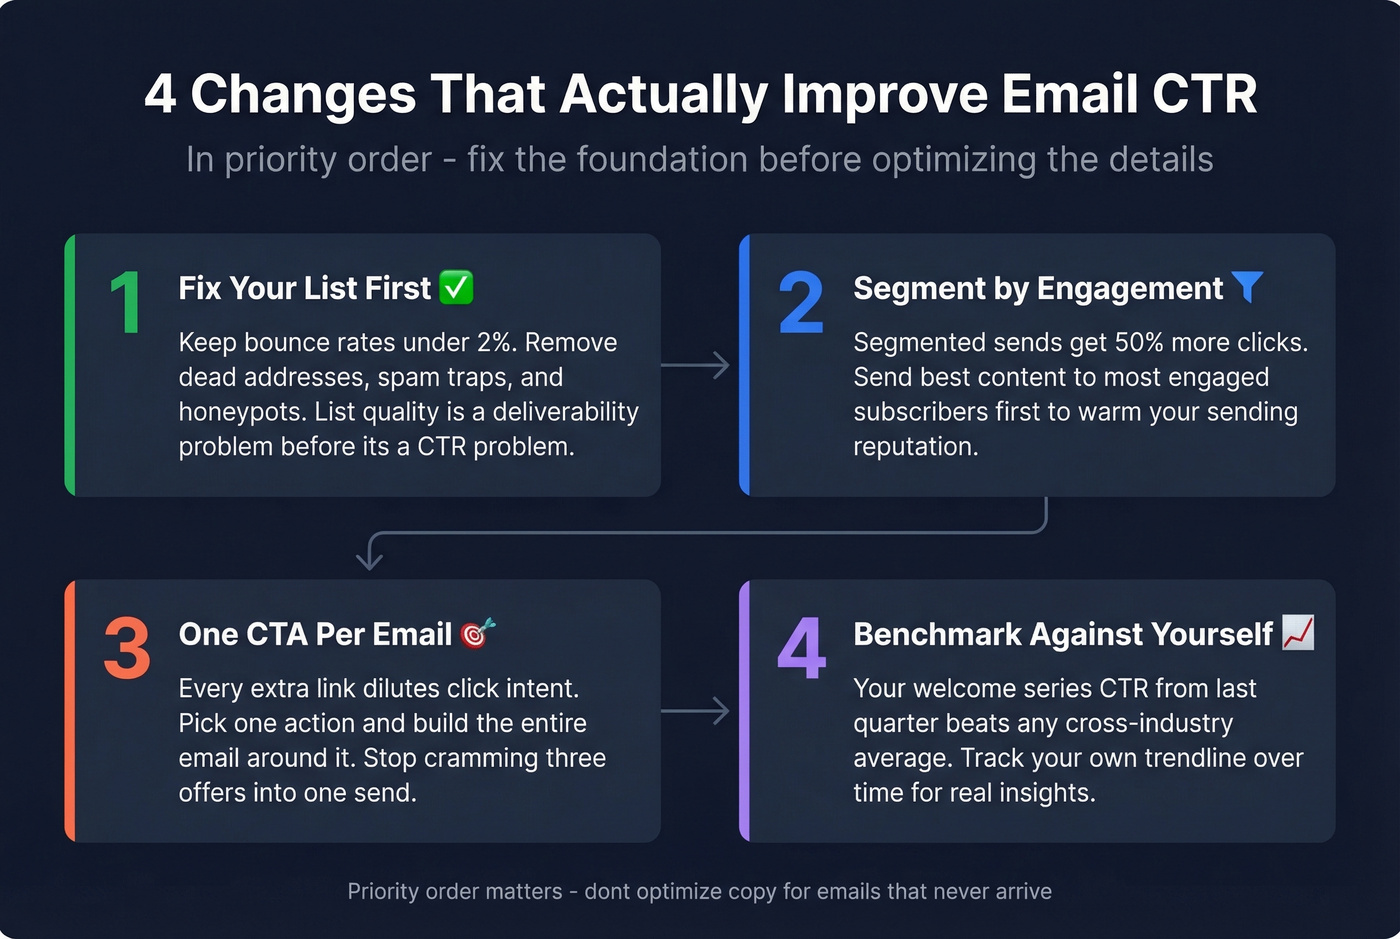
Fix your list before your copy. Bounce rates under 2% are a common marker of healthier email programs. If you're consistently above that, list hygiene becomes a deliverability problem fast. Prospeo's 5-step email verification - including catch-all handling, spam-trap removal, and honeypot filtering - catches dead addresses that other tools miss. Start there. If you want the full breakdown, see our email deliverability guide and email bounce rate benchmarks.
Segment by engagement, not just demographics. Detailed segmentation leads to 50% more clicks than unsegmented sends. Send your best content to your most engaged subscribers first, and let their opens and clicks warm up your sending reputation before you hit the full list. (If you're doing this for outbound, pair it with an Ideal Customer Profile so your segments actually map to revenue.)
One CTA per email. Every additional link dilutes click intent. Pick the one action you want and build the entire email around it. This sounds obvious, but we still see teams cramming three different offers into a single send and wondering why nothing gets clicked. For examples and rules, use this email call to action playbook.
Benchmark against your own history. Your welcome series CTR from last quarter is a better target than any cross-industry average. Track your own trendline - your own email click-through rate benchmarks over time will always be more actionable than external reports. If you need a clean definition, start with the click-through rate formula and compare it to standard email open rate ranges.
B2B CTR benchmarks assume your emails reach real inboxes. Bad data kills deliverability before your content gets a chance. Prospeo refreshes 300M+ profiles every 7 days - not every 6 weeks - so you're never emailing dead addresses.
Stop optimizing copy for emails that never arrive.
FAQ
What's a good email CTR by industry?
A good CTR falls between 2-5% for most industries, but email type matters more than vertical. Automated flows average 5-6% while promotional blasts land around 1-3%. Nonprofits and education consistently outperform ecommerce by 1-2 percentage points across major ESP datasets.
Why does my CTR differ from published benchmarks?
Benchmark sources define CTR differently - clicks divided by delivered versus clicks divided by opens - and filter bot clicks inconsistently. ActiveCampaign reports 6.21% while Klaviyo reports 1.69% for the same metric name. Always check how a source calculates its numbers before comparing to your own.
What's the difference between CTR and CTOR?
CTR equals clicks divided by emails delivered. CTOR equals clicks divided by emails opened. CTOR isolates content quality from deliverability and subject-line performance, making it more useful for optimizing email body copy and CTA placement. A typical CTOR benchmark is 5-10%.
How does list quality affect email CTR?
Bad data tanks deliverability before anyone sees your content. If your bounce rate exceeds 2%, inbox placement drops and CTR follows. Teams using verified contact data - like Prospeo's 98%-accuracy email database - report bounce rates under 4% and measurably higher engagement across their campaigns.