Email Deliverability Statistics: What the 2026 Data Actually Says
Every email that lands in spam is a conversation that never happens. Send 10,000 emails at 98% inbox placement and you reach 9,800 people. Drop to 85% and you're at 8,500 - 1,300 missed inbox views, roughly 26 lost conversions at a 2% rate. With 376.4 billion emails sent daily and 4.59 billion users worldwide, every inbox is more crowded than it was last year.
That's the backdrop. Here's what the numbers actually look like.
Global Inbox Placement Rates
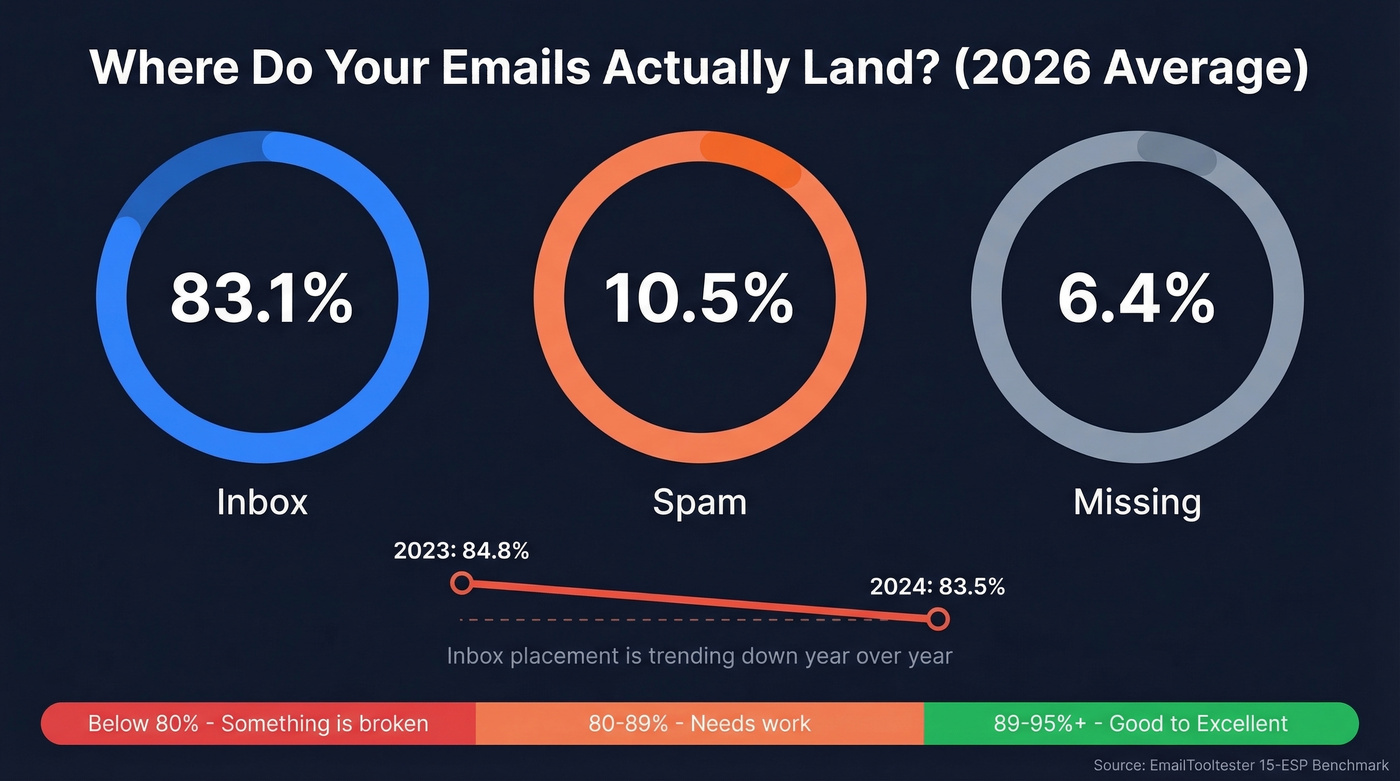
Per EmailTooltester's 15-ESP benchmark, the average marketing email inbox placement rate sits at 83.1%. Nearly 1 in 6 emails never reaches the inbox.
| Metric | Rate |
|---|---|
| Inbox | 83.1% |
| Spam | 10.5% |
| Missing | 6.4% |
The trendline isn't encouraging - inbox placement slid from 84.8% to 83.5% between 2023 and 2024. For benchmarking your own programs: above 89% is good, above 95% is excellent, and below 80% means something's broken.
That 83% average is misleading for well-run programs, though. It's dragged down by senders who skip authentication and never clean their lists. When you're reviewing deliverability benchmarks for your own domain, compare against your vertical rather than the global number.
Deliverability by ISP
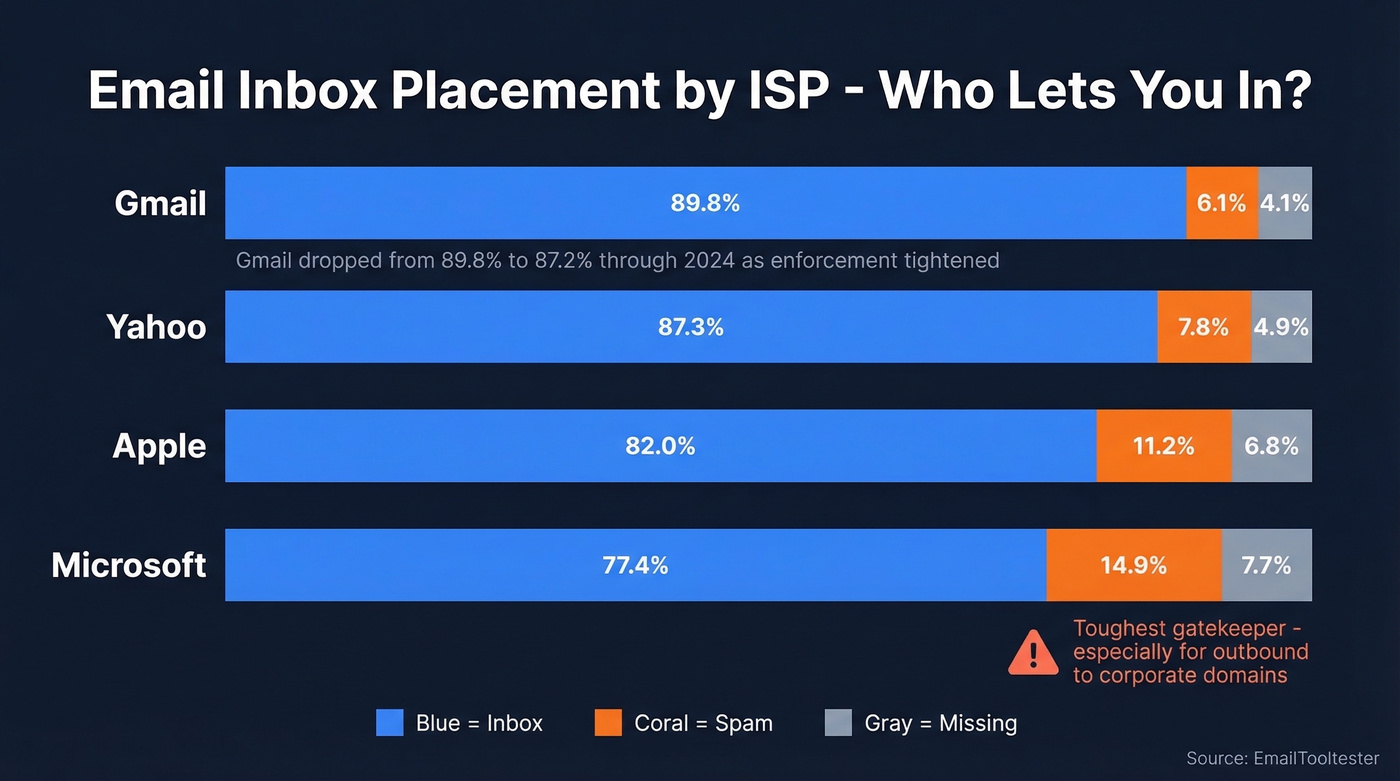
Microsoft is the toughest gatekeeper by a wide margin.
| ISP | Inbox | Spam | Missing |
|---|---|---|---|
| Gmail | 89.8% | 6.1% | 4.1% |
| Yahoo | 87.3% | 7.8% | 4.9% |
| Apple | 82.0% | 11.2% | 6.8% |
| Microsoft | 77.4% | 14.9% | 7.7% |
If you're running outbound into corporate domains, expect lower inbox rates - especially on Microsoft. Gmail's numbers look better on paper, but they've been trending down: inbox placement dropped from 89.8% to 87.2% over the course of 2024 as bulk-sender enforcement and engagement filtering tightened.
We've seen teams with perfect authentication still struggle on Outlook, especially since Microsoft tightened its filtering in May 2025. And keep in mind that Gmail's tab system means even "delivered" emails can land in Promotions rather than Primary, adding another layer of visibility loss that doesn't show up in these stats.
By Region and Industry
Geography and vertical matter more than most senders realize.
| Region | Inbox Rate |
|---|---|
| Europe | 91.1% |
| Latin America | 88.0% |
| Asia Pacific | 87.9% |
| North America | 86.7% |
| Industry | Inbox Rate |
|---|---|
| Transportation | 97.2% (best) |
| Real Estate | 80.1% (worst) |
Country-level variation is even more dramatic: Germany hits 97.5% while India sits at 71.0%. If you're running global campaigns, segment your deliverability tracking by region. A single aggregate number hides massive differences.
Regional deliverability gaps disappear when your data is clean. Prospeo's 5-step verification - with catch-all handling, spam-trap removal, and honeypot filtering - keeps bounce rates under 4% regardless of ISP or geography. 98% email accuracy, refreshed every 7 days.
Fix your deliverability at the source - start with verified data.
Why Inbox Placement Keeps Dropping
The spam numbers are staggering: nearly 45% of all global email traffic is spam, per Kaspersky's 2026 telemetry. Users encountered 144 million malicious email attachments last year - up 15% year-over-year. The average user now manages 1.86 email accounts and receives 82-120 emails per day. That's the environment ISPs are reacting to.
Gmail's enforcement escalation, which ramped up in November 2025, introduced permanent bulk sender classification for anyone sending 5,000+ daily emails to personal Gmail accounts. Non-compliant senders face temporary rate limiting or permanent rejection codes. Only 49% of senders actually made changes to comply with the new requirements, per a Mailgun survey of 1,100+ senders.
The spam complaint rate benchmark is the real tripwire. Keep it under 0.1%, because hitting 0.3% means your traffic gets filtered and you lose access to Gmail's mitigation support until you maintain sub-0.3% for seven consecutive days.
These aren't temporary policy experiments. With email volume projected to hit 392.5 billion daily sends by the end of 2026, ISPs have every incentive to keep raising the bar.
The DMARC Enforcement Gap
DMARC adoption looks great on paper - until you look at enforcement levels. EasyDMARC's research shows 93.8% of Fortune 500 companies have valid DMARC records, with 62.7% at p=reject. Among Inc. 5000 companies, adoption drops to 76.2% and only 15.2% enforce with p=reject.
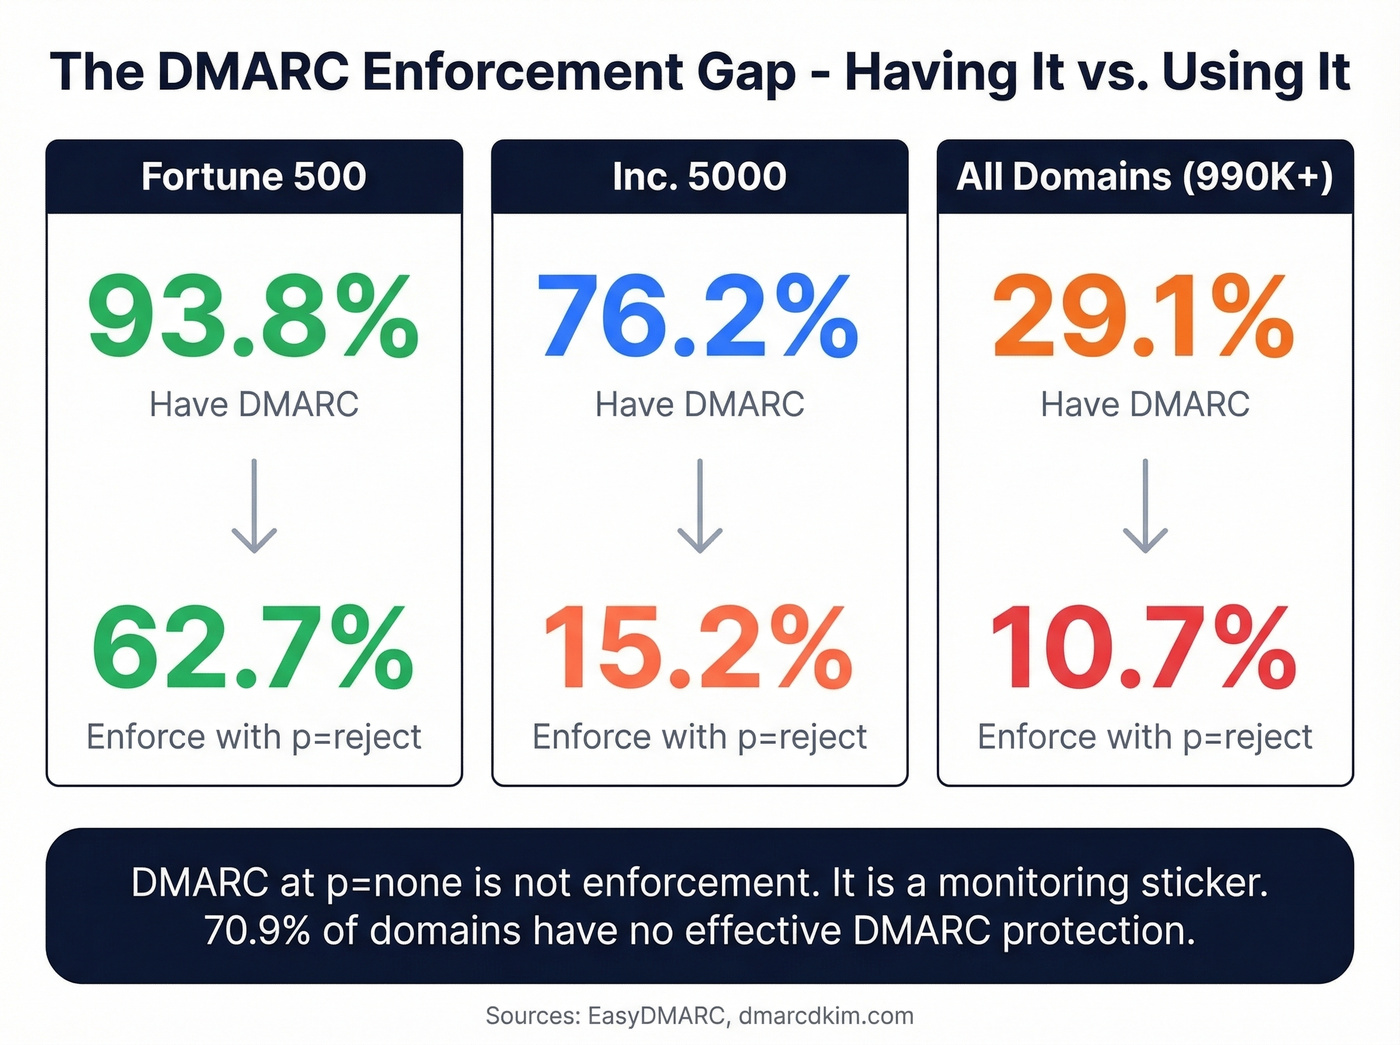
A March 2026 snapshot of 990,000+ domains paints the clearest picture: 70.9% have no effective DMARC protection. Only 10.7% run full enforcement. Strict policy adoption crept up just 1.3 percentage points over six months.
Let's be honest: DMARC at p=none isn't enforcement. It's a monitoring sticker. The gap between having DMARC and enforcing it is where most organizations sit, and it's giving them false confidence. If your domain is still at p=none, you're monitoring - not enforcing - and spoofing risk stays high.
If you're still getting your authentication stack in order, start with the basics (and verify each piece): SPF syntax, DKIM signing, and DMARC alignment. This Email Deliverability Guide and DMARC Alignment breakdown will help you close the gap.
What Senders Get Wrong
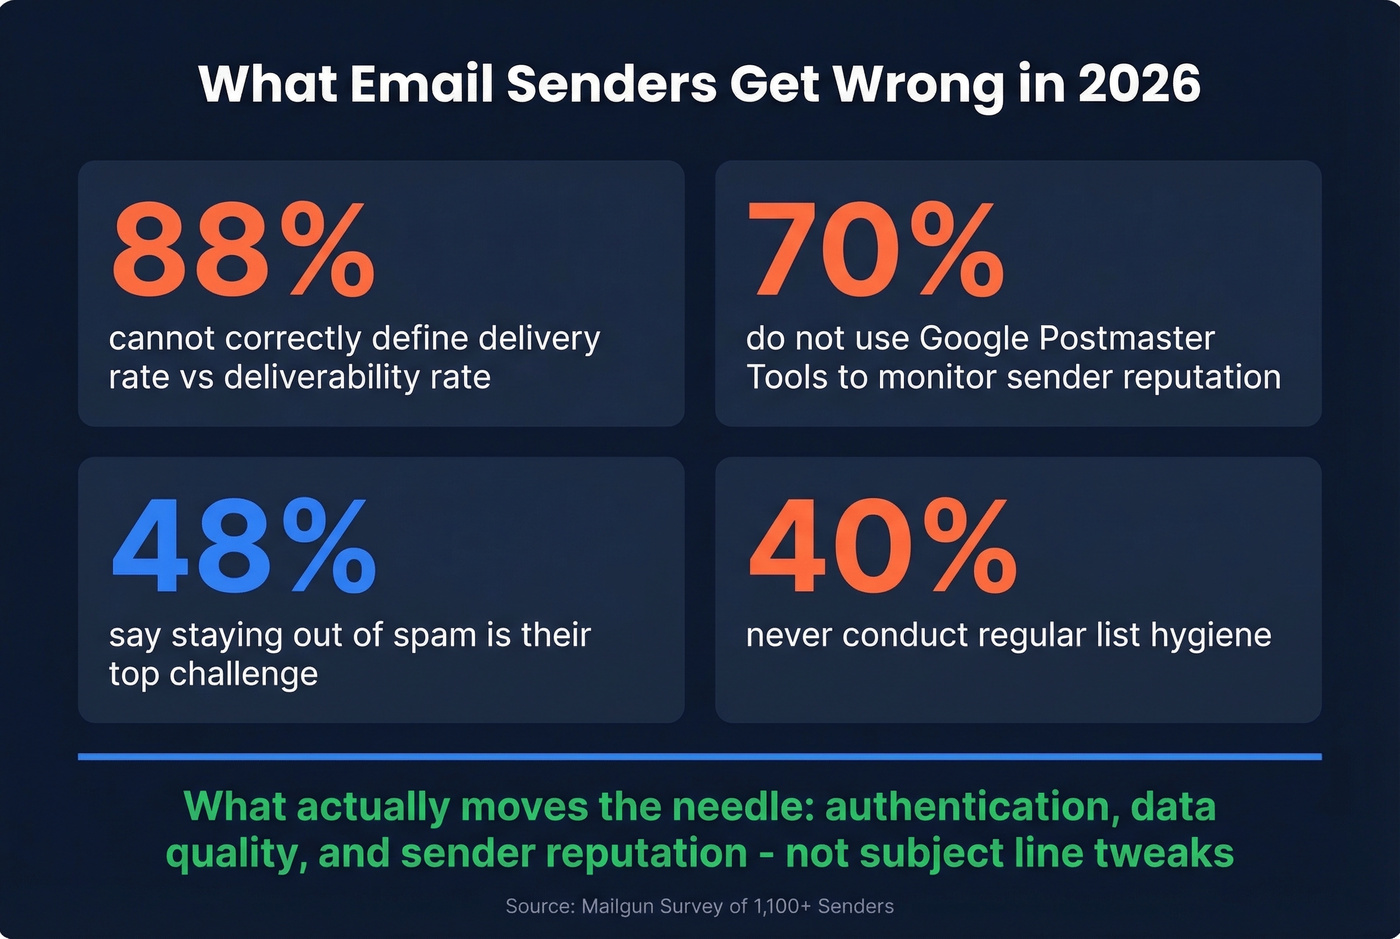
The biggest deliverability problems start before you hit send. Mailgun's survey of 1,100+ senders found that 88% can't correctly define "delivery rate" versus "deliverability rate." Seven in ten don't use Google Postmaster Tools to monitor sender reputation. And while 48% say staying out of spam is their top challenge, only 60% regularly conduct list hygiene.

Here's the thing: stop obsessing over subject lines and start obsessing over your data. What actually moves the needle in 2026 is infrastructure - authentication, data quality, and sender reputation. Bad contact data (bounces, spam traps, honeypots) is a major upstream cause of reputation damage that tanks inbox placement downstream.
If you want a clean way to think about it, treat bounces as a leading indicator and deliverability as the lagging one. Track your email bounce rate like a hawk, and build a repeatable process for spam trap removal before every send.
In our experience, teams that verify their lists before every send see the biggest deliverability gains. Not the ones A/B testing emoji in subject lines. Stack Optimize built to $1M ARR running client campaigns through Prospeo-verified lists: 94%+ deliverability, under 3% bounce rate, zero domain flags across all clients. That's what clean data does at scale.
88% of senders can't define deliverability correctly, and 70% never check sender reputation. The teams winning in 2026 aren't optimizing subject lines - they're eliminating bad data before it hits send. Stack Optimize proved it: $0 to $1M ARR, 94%+ deliverability, zero domain flags - all on Prospeo-verified lists at ~$0.01/email.
Every bounced email damages your domain. Stop sending blind.
Cold vs. Marketing Email
Authenticated opt-in programs typically run 85-95%+ inbox placement. Cold outreach is a different animal - more volatile, especially on Microsoft domains. The consensus on r/b2bmarketing is that even with full SPF/DKIM/DMARC, proper warmup, and link rotation, sustaining 90%+ deliverability on cold is genuinely difficult in 2026.
If you're doing outbound, you also need to manage volume and ramp carefully. Use an email velocity framework, and make sure you understand the bulk email threshold rules that trigger stricter filtering.
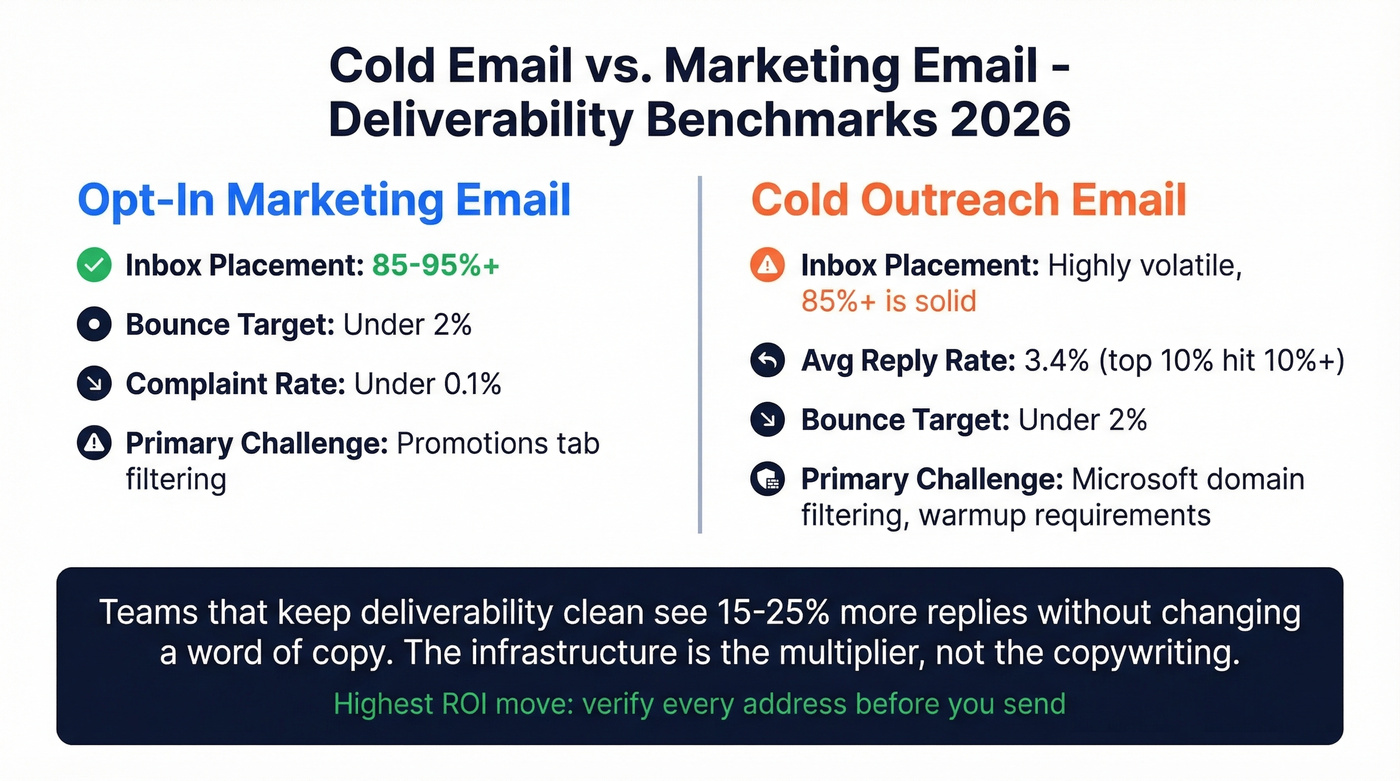
Practitioner benchmarks tell the story: average cold email reply rate sits around 3.4%, with top 10% performers hitting 10%+. Teams that keep deliverability clean - bounces under 2%, complaints near zero - see 15-25% more replies without changing a word of copy. The infrastructure is the multiplier, not the copywriting.
Skip the "deliverability tools" that only monitor after the damage is done. The highest-ROI move is preventing bounces and spam-trap hits before you send, which means verifying every address on your list against live mailbox data. If you need a deeper stack view, compare options in our guide to email reputation tools and what an email spam checker can (and can't) catch.
FAQ
What's a good email deliverability rate?
For opt-in marketing programs, target 95%+ inbox placement. For cold outreach, 85%+ is solid and puts you well above average. The 83.1% industry benchmark is dragged down by senders who skip authentication and ignore list hygiene.
What's the difference between delivery rate and deliverability rate?
Delivery rate means the receiving server accepted the email without bouncing it. Deliverability rate means it actually landed in the inbox, not spam or a junk folder. Per Mailgun's research, 88% of senders confuse the two - a costly misunderstanding, because you can have a 99% delivery rate and still have 20% of your mail sitting in spam.
How do I check my sender reputation?
Use Google Postmaster Tools (free) to monitor domain reputation, spam complaint rates, and authentication pass rates on Gmail. For broader protection, verify your contact list before every send to flag spam traps and invalid addresses, and keep bounces under 2%. That combination - monitoring plus prevention - is what separates senders who maintain 95%+ inbox placement from everyone else.