Email Open Rate Average in 2026: Benchmarks That Actually Matter
Ask five email marketers for the email open rate average and you'll get five different answers. That's not a coincidence - it's the core problem with benchmarks right now. Every ESP measures differently, Apple's Mail Privacy Protection (MPP) fabricates opens at scale, and nobody agrees on whether to use mean or median.
Let's reconcile every major source, explain why they disagree, and find the number that actually matters for your list.
The quick version: The cross-platform average sits between 31% and 43% depending on the source. That range exists because ESPs measure different populations with different methodologies, and most benchmarks aren't fully MPP-adjusted. Three things to know right now:
- The reconciled range across major ESPs is 31-43%, with most clustering around 35-40%.
- Apple MPP can nearly double reported open rates in some datasets - your "true" engaged opens are much lower.
- Click-to-open rate (CTOR) is the metric that actually matters in 2026. Opens alone are measuring noise.
Every Major Benchmark Compared
We haven't seen another page that puts these numbers side by side with the context you need to interpret them. So we built one.
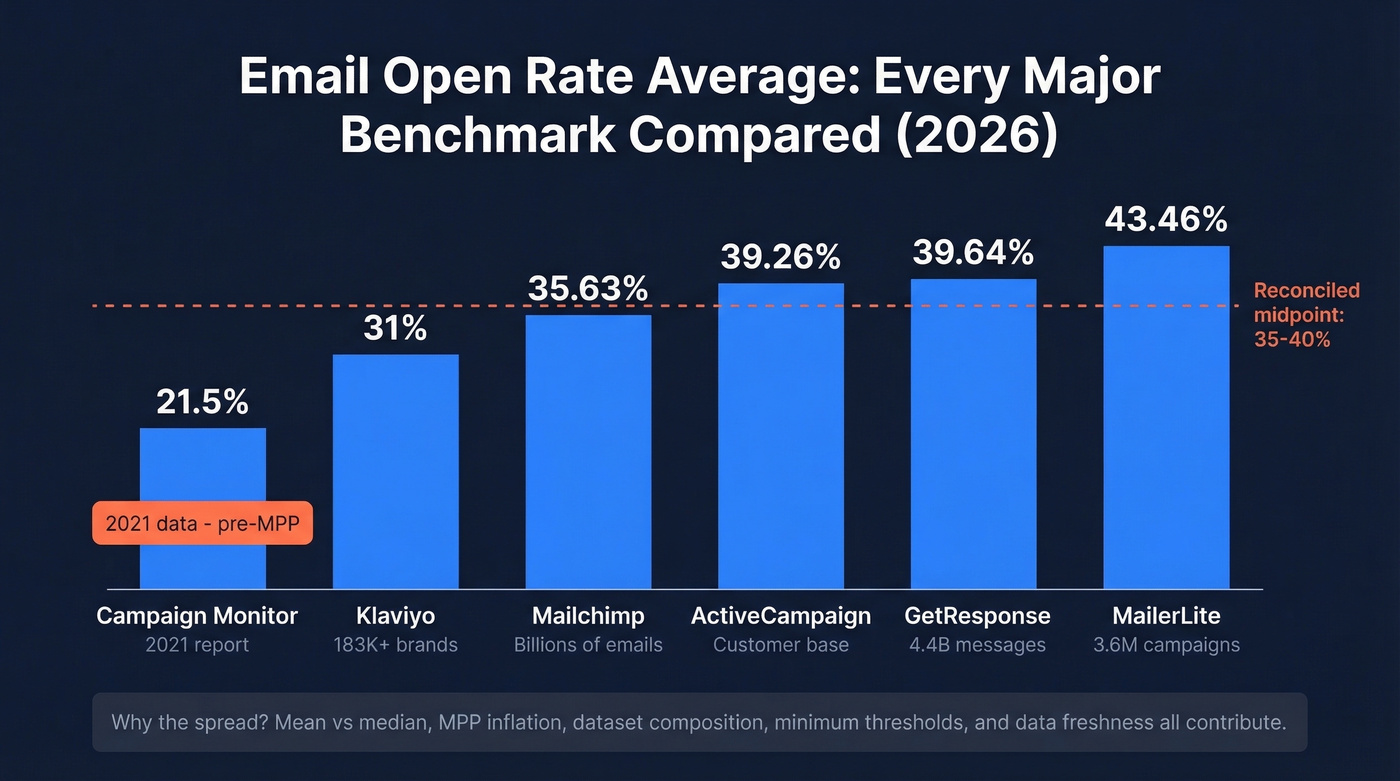
| Source | Avg. Open Rate | Dataset | Period | Notes |
|---|---|---|---|---|
| MailerLite | 43.46% | 3.6M campaigns | Dec 2024-Nov 2025 | Median; MPP inflates opens |
| GetResponse | 39.64% | 4.4B messages | Not specified | Collected before Bot Detector launch |
| ActiveCampaign | 39.26% | Customer base | Jan 1-Dec 10, 2025 | Average; not MPP-adjusted |
| Mailchimp | 35.63% | Billions of emails | Updated Dec 2023 | Average unique open rate; 1,000+ subscriber minimum |
| Klaviyo | 31% | 183,000+ brands | 2026 benchmarks | E-commerce-heavy dataset |
| Campaign Monitor | 21.5% | Cross-industry | 2021 (2022 report) | Pre-MPP adoption at scale |
The spread from 21.5% to 43.46% isn't noise - it's methodology. Every one of these numbers is "correct" for its dataset. The question is which dataset resembles yours.
Why Every Source Disagrees
Six factors explain almost all the variation.
Mean vs. median. MailerLite uses median, which resists outlier distortion. A handful of accounts with 90%+ rates - tiny lists, transactional sends - pull averages up. That alone explains a big chunk of the gap between platforms publishing very different numbers from similarly large datasets.
Dataset composition. Some ESPs skew SMB, others skew e-commerce, others skew cross-industry. Different sender mixes, different benchmarks.
Minimum thresholds. Mailchimp only includes campaigns sent to 1,000+ subscribers, filtering out micro-lists that tend to inflate averages.
MPP handling. Most benchmarks aren't fully MPP-adjusted. Some acknowledge it with a disclaimer. Others don't mention it at all, which is worse.
Bot inflation. GetResponse notes their 39.64% benchmark was collected before their Bot Detector feature - meaning bots likely inflated reported opens alongside MPP. That's two layers of artificial inflation baked into one number.
Data freshness. Campaign Monitor's 21.5% comes from 2021, before MPP adoption hit critical mass. ActiveCampaign's 39.26% covers sends through December 2025. You're comparing different eras of email measurement.
Open Rates by Industry
Industry benchmarks are useful directionally, but the same MPP and methodology caveats apply to every one of them.
MailerLite's full industry range spans 30.1-55.71% across all verticals. ActiveCampaign's customer-base industry averages:
| Industry | Open Rate (ActiveCampaign) | Open Rate (MailerLite Range) |
|---|---|---|
| Media/Publishing | 43.16% | 40-56% |
| Non-profit | 42.68% | 38-50% |
| Software/Tech | 36.20% | 30-42% |
| E-Commerce/Retail | 35.66% | 31-40% |
If you're in e-commerce and seeing 35% opens, you're roughly at the average for your vertical. If you're a non-profit at 35%, you're underperforming your peers by a meaningful margin.
Here's a better way to benchmark yourself: Average your last 10 campaigns, throw out the highest and lowest, and compare the remaining eight-campaign average to your industry median above. That number is a more honest benchmark than any cross-platform figure.
The Apple MPP Problem
Apple MPP is the single biggest distortion in email open rates, and most benchmarks pretend it doesn't exist.
When an Apple Mail user has MPP enabled, Apple's servers pre-download email content - including the tracking pixel - regardless of whether the subscriber actually opens the email. The result: fabricated opens that look identical to real ones in your ESP dashboard. There's no reliable way to distinguish them at the individual level.
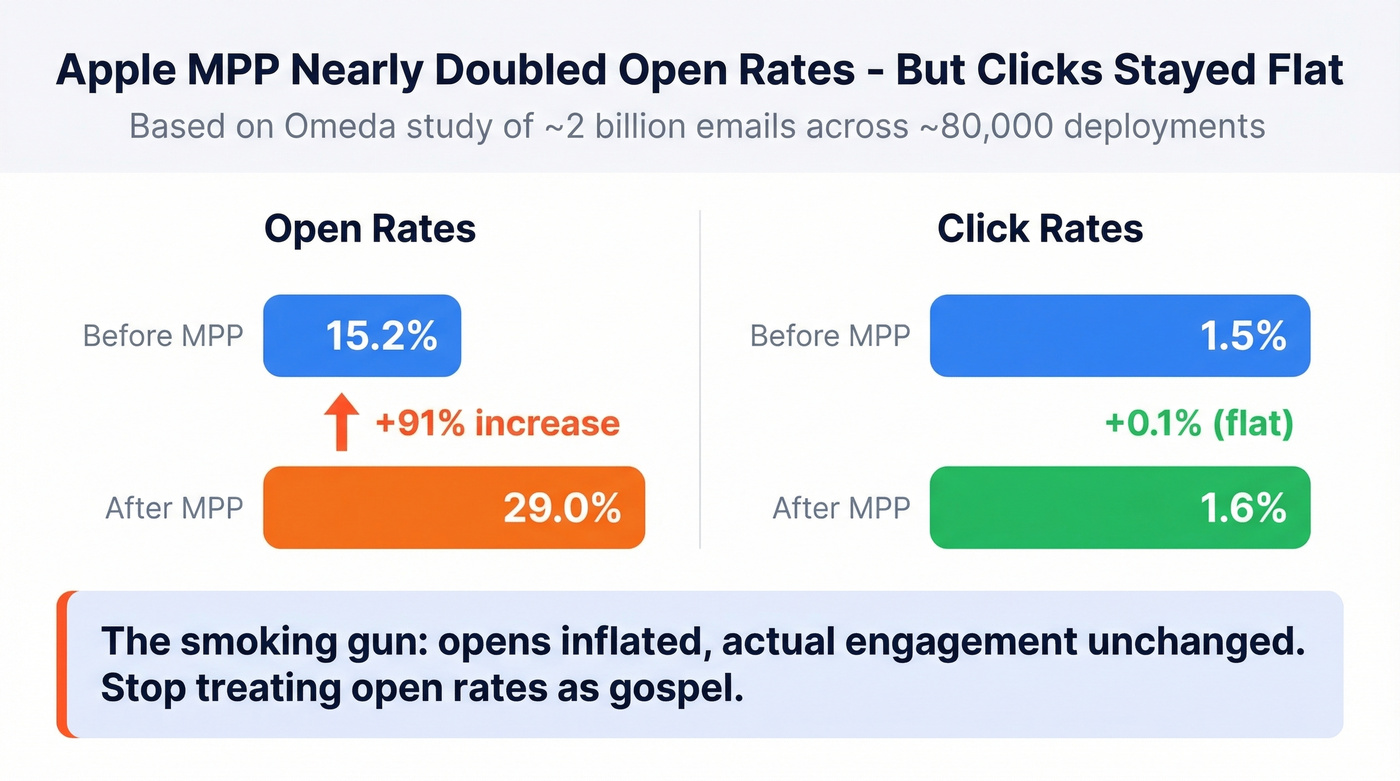
The most rigorous before/after analysis comes from Omeda, who studied approximately 2 billion emails across ~80,000 deployments. Unique open rates jumped from 15.2% to 29.0% - nearly doubling. Total open rates went from 22.6% to 40.5%. Meanwhile, unique click rates stayed essentially flat at ~1.5-1.6%, and total click rates held around 2.3-2.4%.
That's the smoking gun. Opens inflated, actual engagement unchanged.
Klaviyo's guidance is blunt: by 2023, over half of email globally was already subject to MPP. And here's the uncomfortable nuance - aggressively excluding Apple privacy opens from your segments can actually reduce revenue. You can't just filter them out and call it a day.

Use opens as a directional signal - trending up or down over time - but stop treating the absolute number as gospel. In our experience, teams that shift from open rate to CTOR as their primary KPI make better decisions within the first month.
Open rates are inflated by MPP and bots. Click rates stayed flat. The only metric that matters is whether your emails reach real people - and that starts with data quality. Prospeo's 98% email accuracy and 5-step verification keep bounce rates under 4%.
Fix the input and every downstream metric improves.
Benchmarks by Email Type and List Size
Lumping all emails together is one reason benchmarks feel useless. Not all emails are created equal.
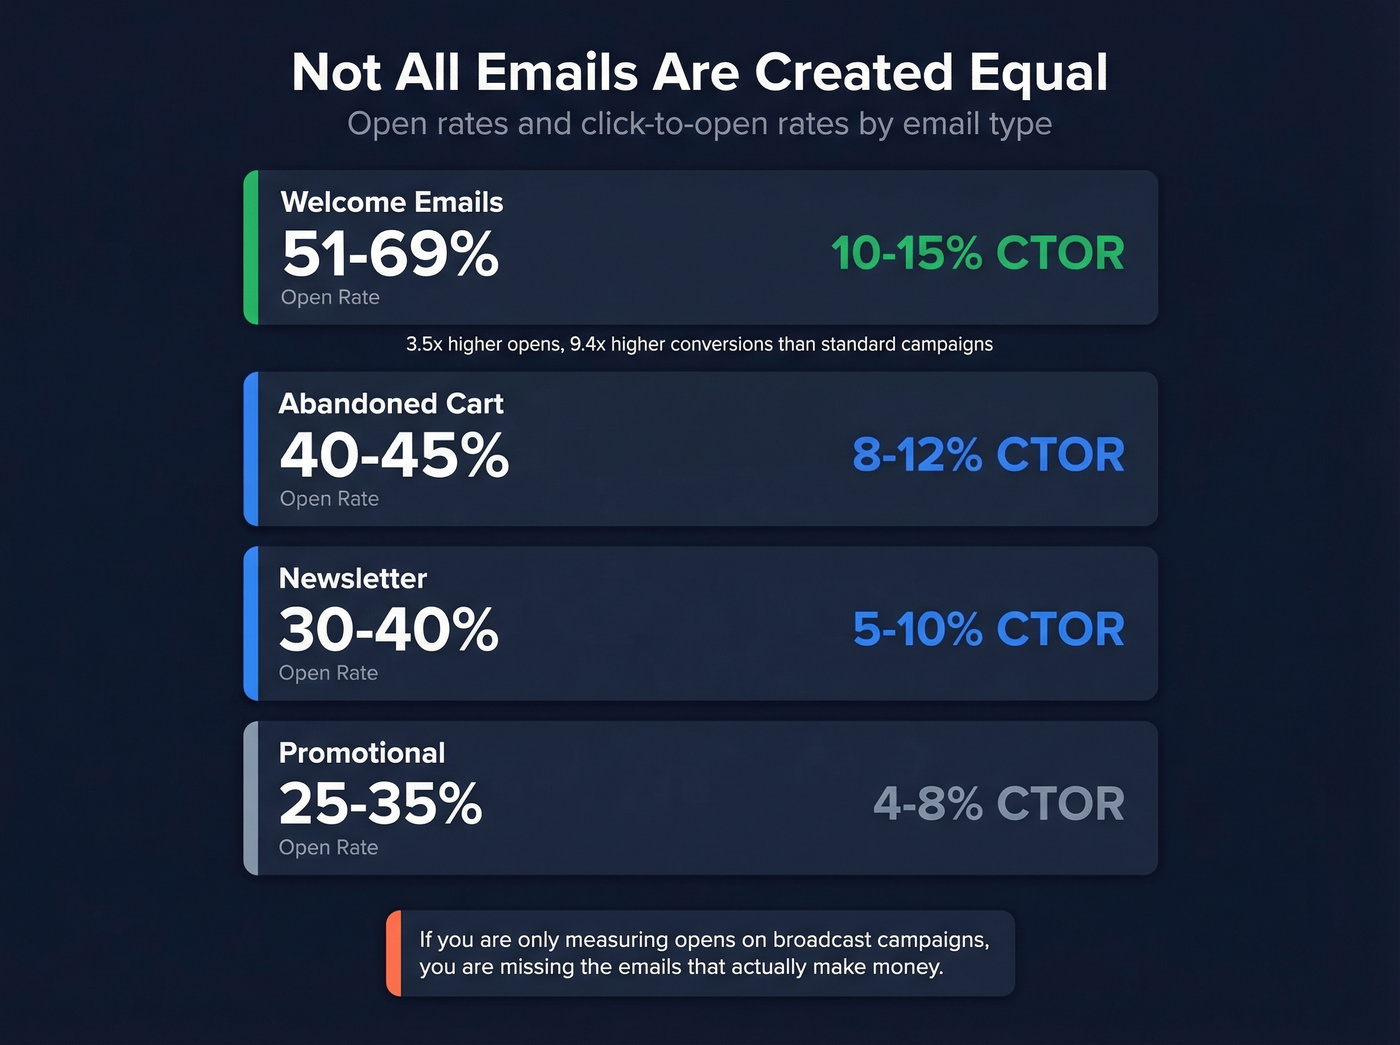
Welcome emails average a 68.6% open rate - roughly 3.5x the 19.7% average for standard campaigns. They also generate 320% more revenue per email and convert at 0.94% vs. 0.10% for typical campaigns. That's a 9.4x multiplier. If you're only measuring opens on broadcast campaigns, you're missing the emails that actually make money.
Smaller lists produce higher open rates. Math, not magic. Practitioners on r/Emailmarketing consistently report lists under 1,000 subscribers hitting ~50% open rates, while lists around 5,000 drop to ~35%. Lists over 100,000 typically land in the 20-30% range. Don't panic if your numbers drop as your list grows - every new subscriber dilutes engagement slightly because they're less likely to be your most passionate audience.
| Email Type | Typical Open Rate | Typical CTOR |
|---|---|---|
| Welcome | 51-69% | 10-15% |
| Abandoned Cart | 40-45% | 8-12% |
| Newsletter | 30-40% | 5-10% |
| Promotional | 25-35% | 4-8% |
Deliverability: The Hidden Driver
Before you optimize a single subject line, ask a more fundamental question: are your emails even reaching the inbox?
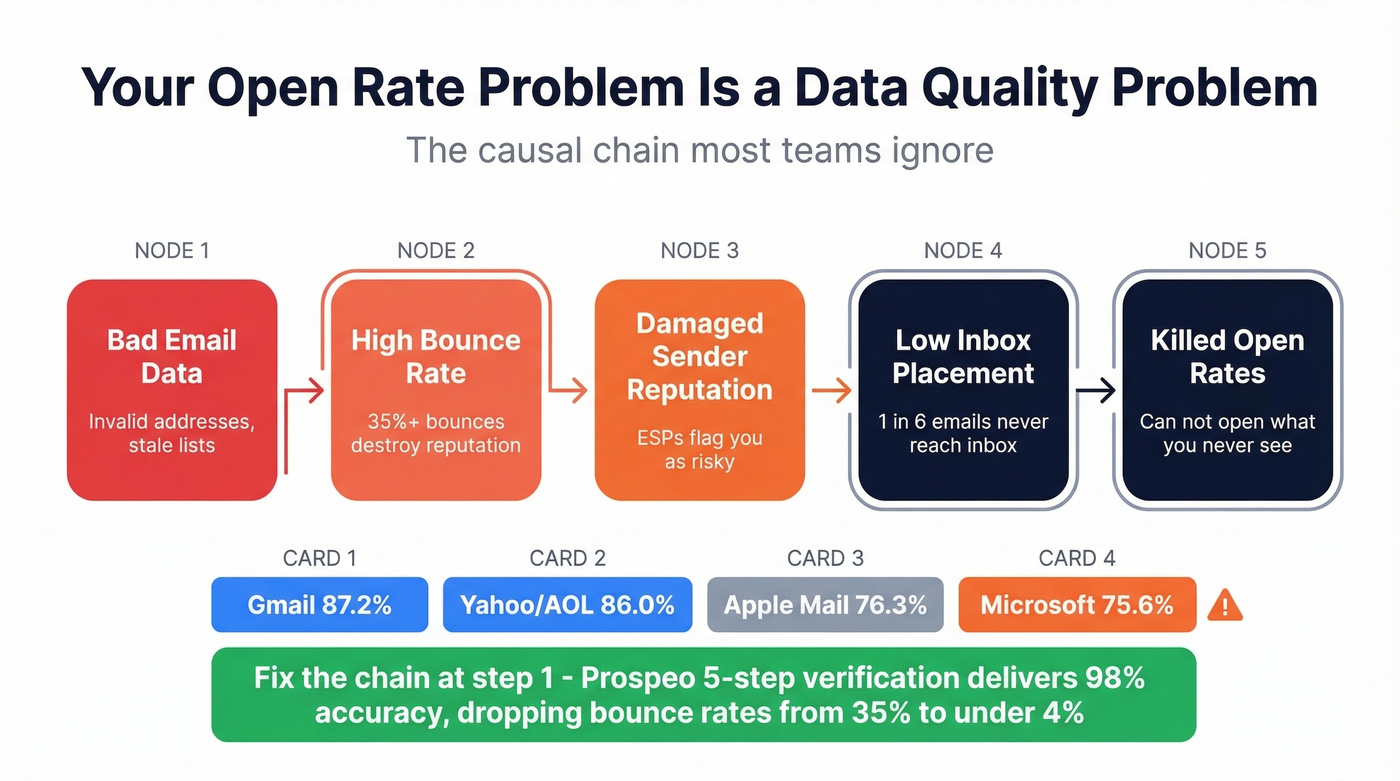
Global inbox placement averages about 84% - roughly 1 in 6 emails never makes it. Note that deliverability rate (did the server accept it) and inbox placement rate (did it reach the inbox vs. spam) are different metrics; that 84% is inbox placement, the harder bar to clear. Gmail sits at 87.2%, Yahoo/AOL at 86.0%, Apple Mail at 76.3%, and Microsoft at a surprisingly low 75.6%. If a quarter of your list is on Outlook, you've got a visibility problem before engagement enters the picture.
Gmail adds another layer. Only 2.7-4.4% of marketing emails land in the Primary tab. Dr. Squatch saw a 42% open rate improvement and a 112% revenue increase when they optimized for Primary tab placement. And if your email exceeds 102KB, Gmail clips it entirely - the tracking pixel never loads, suppressing your reported opens even when someone reads the message.
The causal chain is straightforward: bad data leads to bounces, bounces damage sender reputation, damaged reputation tanks inbox placement, and low inbox placement kills opens. Your open rate problem is almost certainly a data quality problem.
This is where list verification becomes non-negotiable. Prospeo's 5-step verification process delivers 98% accuracy on verified addresses. Meritt ran their list through Prospeo and watched their bounce rate drop from 35% to under 4% - a direct lift to sender reputation and inbox placement.
Benchmarking open rates is pointless when 35% of your list is bad data. Meritt cut their bounce rate from 35% to under 4% with Prospeo and tripled pipeline in the process. Verified emails at $0.01 each, refreshed every 7 days.
Stop measuring noise - start reaching real buyers.
How to Improve Your Open Rate
Most "improve your open rate" advice focuses on subject lines and send times. Those matter, but they're polish on a car that might not have an engine. Start with the foundation.
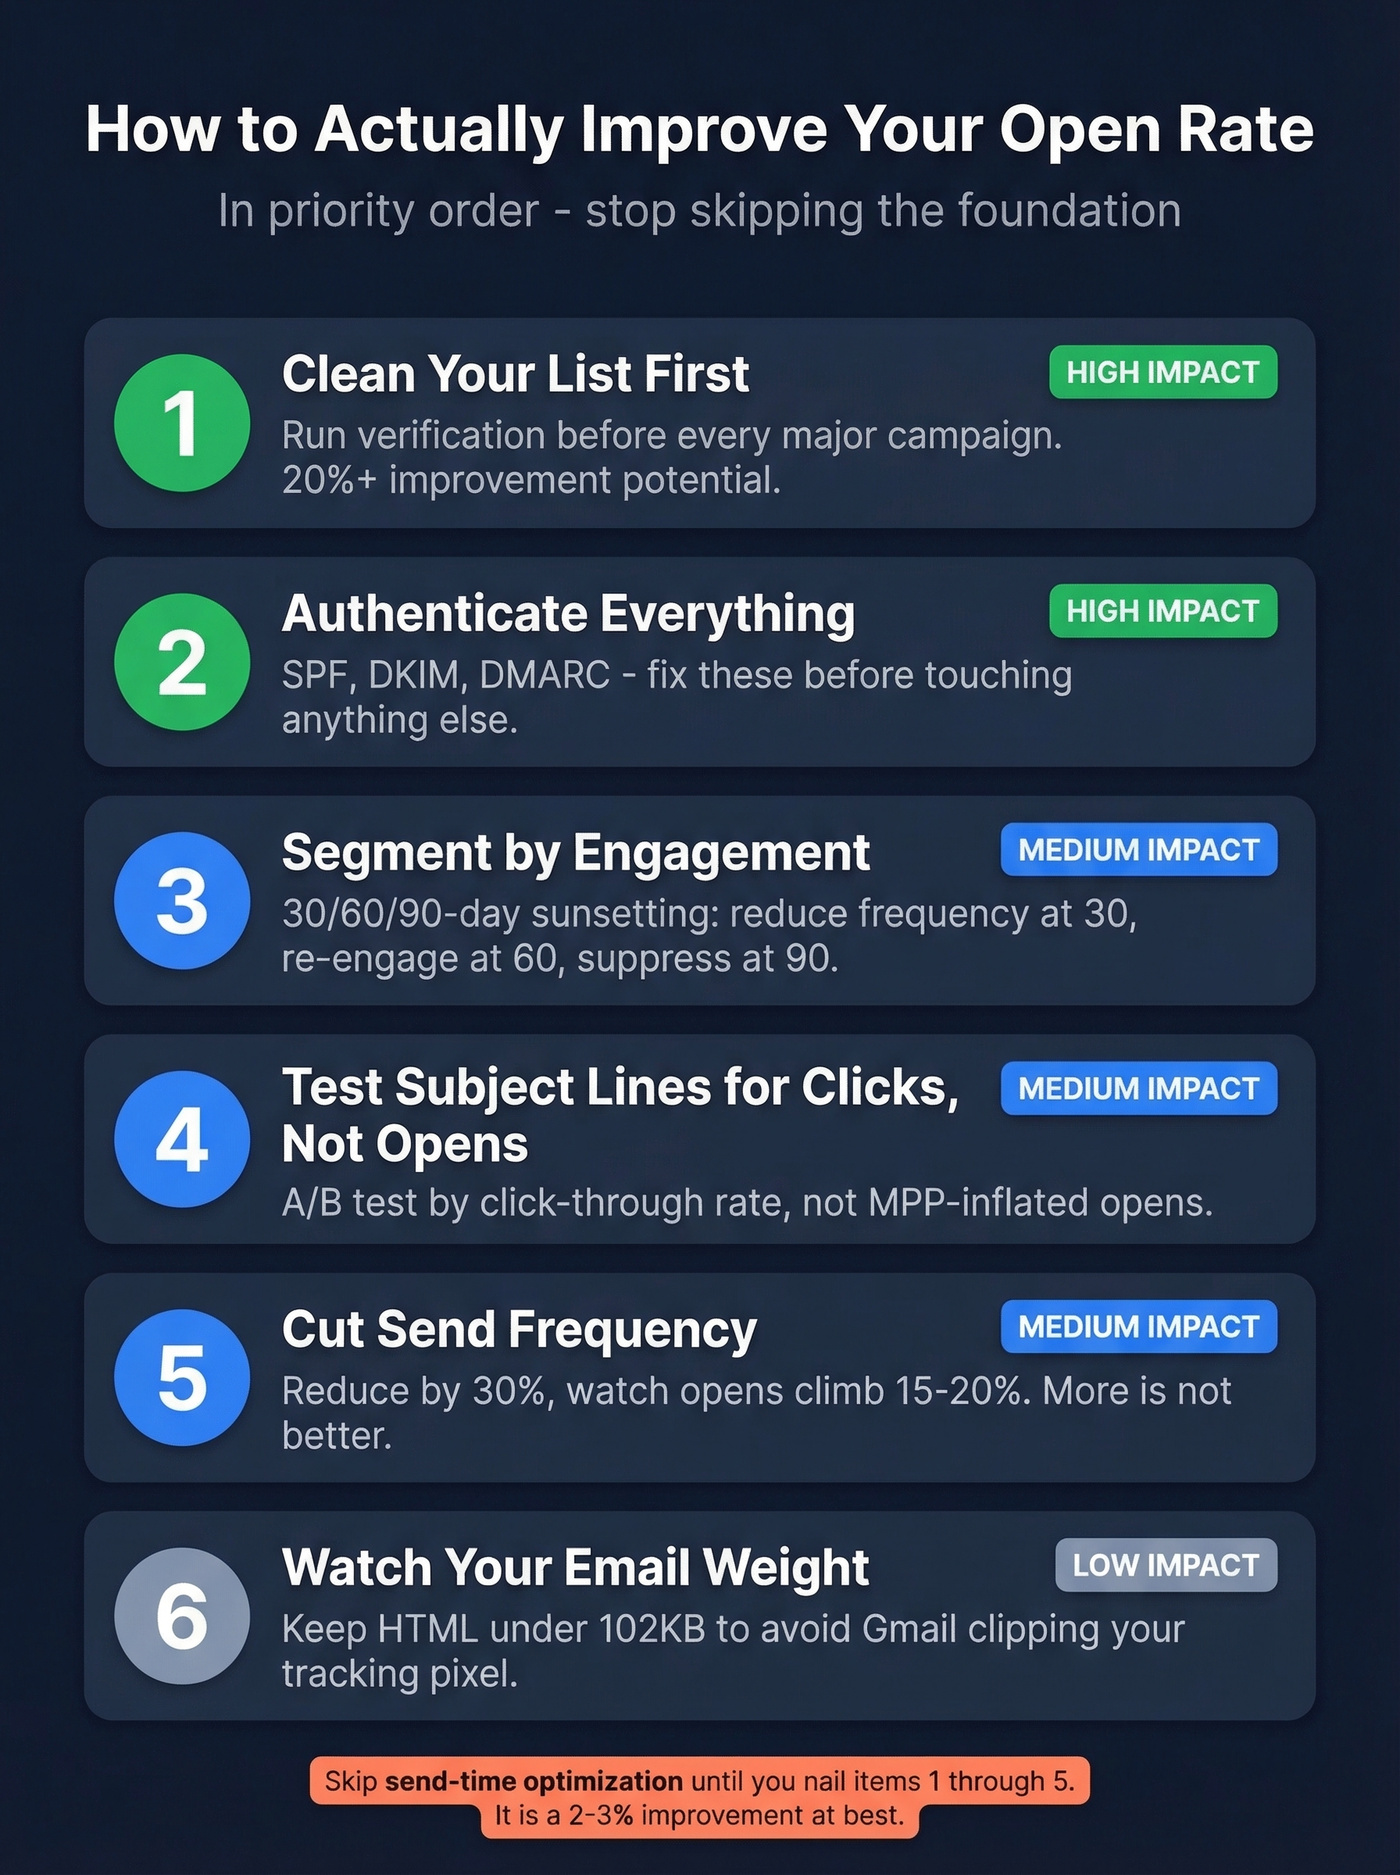
Clean your list first. Run verification before every major campaign. A free tier at Prospeo means there's no excuse to skip this step.
Authenticate everything. SPF, DKIM, and DMARC should be configured and passing. If you haven't set these up, fix that before touching anything else. (If you want a deeper technical walkthrough, see DMARC and SPF.)
Segment by engagement. Stop sending to people who haven't opened in 90 days. We use a 30/60/90-day sunsetting framework: reduce frequency at 30 days, move to re-engagement at 60, suppress at 90.
Test subject lines for clicks, not opens. A/B test subject lines, but measure by click-through. A subject line that drives curiosity clicks beats one that gets MPP-inflated opens every time. Use a swipe file like these subject lines to speed up testing.
Cut send frequency. We've seen teams reduce frequency by 30% and watch open rates climb 15-20% because they stopped fatiguing their list. More isn't better.
Watch your email weight. Keep HTML under 102KB to avoid Gmail clipping. If your tracking pixel gets clipped, you'll undercount opens even from engaged subscribers. (Related: how an email tracking pixel actually works.)
Skip the "best time to send" rabbit hole until you've nailed the five items above. Send time optimization is a 2-3% improvement at best; list hygiene and authentication are 20%+ improvements. If you do want to test timing later, start with this best time to send playbook.
What to Track Instead of Opens
Here's the thing: if you're still using the email open rate average as your primary KPI in 2026, you're measuring noise. The metric is too corrupted by MPP, bot pre-fetching, and image-blocking to serve as a reliable engagement signal. As Braze puts it: "The days of measuring email performance by open rate alone are over."
Click-to-open rate (CTOR) measures what percentage of openers actually clicked - filtering out the passive and the fabricated. Across broad benchmarks, CTOR commonly lands around the 5-10% range. (If you want to calculate it precisely, use this click rate formula guide.)
Click rate is your MPP-proof alternative. Clicks can't be faked by Apple's servers. If your click rate is trending up, engagement is genuinely improving regardless of what opens say.
Revenue per email is the metric your CFO cares about. It cuts through every vanity metric and answers the only question that matters: is this email making money?
I'll go further: if your average deal size is under five figures, you don't need sophisticated open rate analysis at all. Track clicks and revenue. That's it. The teams agonizing over open rate benchmarks are almost always the ones who'd benefit most from ignoring opens entirely and focusing on what drives pipeline.
If you only track three things: CTOR, unsubscribe rate, and revenue per email. Everything else is context.
FAQ
What is the email open rate average across industries?
The email open rate average falls between 31-43% across major ESP benchmarks in 2026, though MPP inflates this significantly. Non-profits tend to see 42-50%, while e-commerce brands land closer to 31-40%. Compare against your own vertical and track the trend over time rather than chasing a single number.
Are email open rates still accurate after Apple MPP?
No. Apple MPP fabricates opens at scale. Omeda's analysis of ~2 billion emails found open rates nearly doubled post-MPP while clicks stayed flat at ~1.5%. Use CTOR and click rate as your primary engagement signals instead.
How does list quality affect open rates?
Invalid addresses cause bounces, which damage sender reputation and reduce inbox placement across your entire list. Cleaning your data with a verification tool can improve inbox placement overnight - Meritt cut their bounce rate from 35% to under 4% after running verification, and their deliverability improved immediately.
What's a good email open rate for my campaigns?
Above 40% is strong for most verticals; below 25% signals deliverability or engagement issues worth investigating. But the number matters less than the trend - focus on improving your own quarter-over-quarter trajectory rather than hitting a universal benchmark that MPP has rendered unreliable.