Enterprise Sales Metrics: The Only 2026 Benchmarks Guide You Need
Enterprise sales metrics get messy the moment someone asks what "good" looks like. Pipeline coverage turns into a QBR debate - 3x, 4x, "it depends on the segment." The truth is simpler than the argument: the benchmark moves with ACV, cycle length, and how many stakeholders sit in the deal.
Enterprise buying committees routinely involve 6-10 people, and buyers spend only 17% of their time with any single vendor. If your dashboard ignores that reality, it'll look precise and still steer you wrong.
The 5 Metrics to Start With
If you're building an enterprise dashboard from scratch, start here:
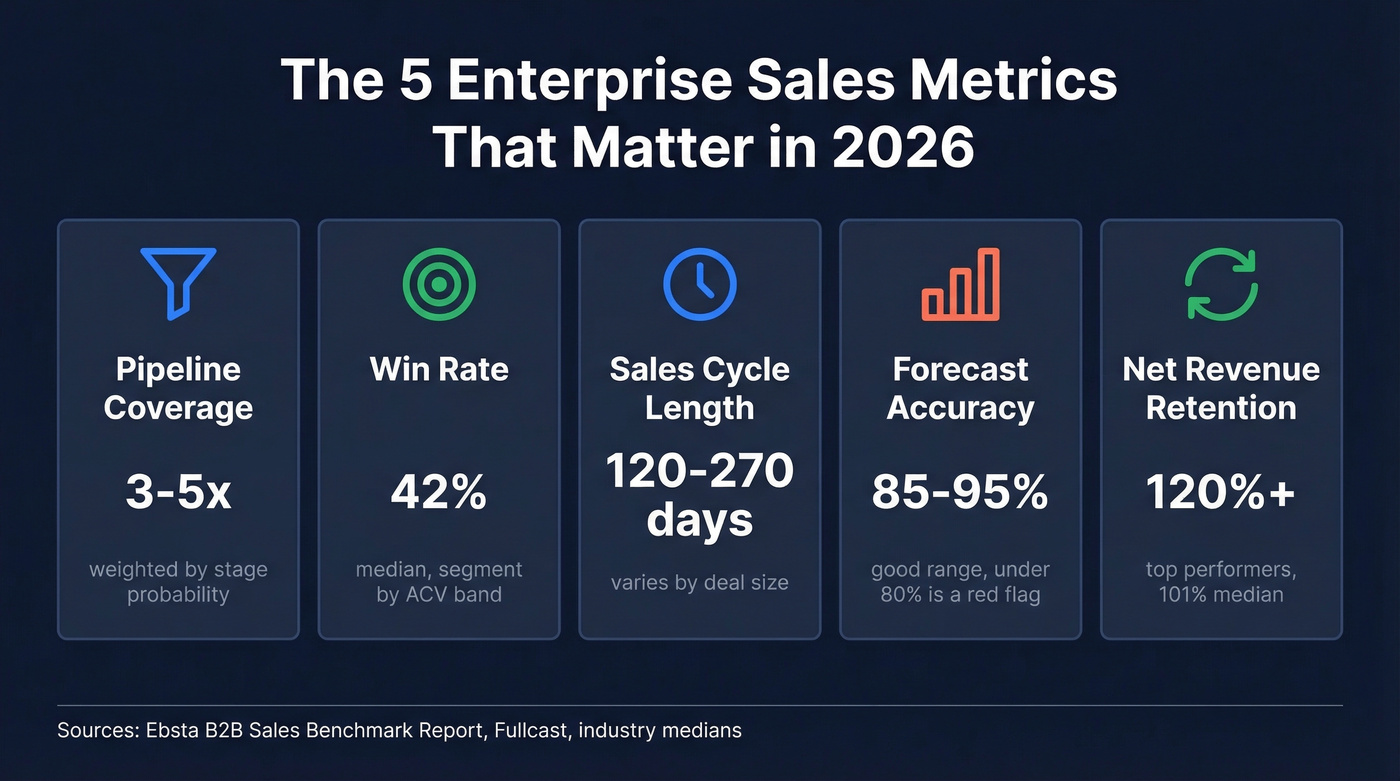
- Pipeline coverage: 3-5x quota, ideally weighted by stage probability
- Win rate: Ebsta's B2B Sales Benchmark Report puts enterprise win rates around 42%; segment by ACV band
- Sales cycle length: 120-270 days depending on deal size
- Forecast accuracy: 85-95% is good; under 80% means your process is leaking
- Net revenue retention (NRR): 101% median; 120%+ for top performers
These five will explain most "why did we miss?" conversations before they happen.
Enterprise Pipeline Health
Pipeline coverage ratio = total pipeline value / sales target. If your team carries a $500K quota and has $2M in pipeline, that's 4x coverage. For enterprise deals, 3-5x is the standard; mid-market can often survive on less. If you want a broader baseline, compare against sales pipeline benchmarks by segment.
The non-negotiable nuance is weighting. Unweighted coverage counts every deal at face value. Weighted coverage multiplies each deal by its stage probability, so a $200K deal at 10% contributes $20K. In our experience, the first time a team switches from unweighted to weighted coverage, their "healthy" pipeline shrinks by 40-60% overnight - and that's a good day, because it means you finally stopped lying to yourself.
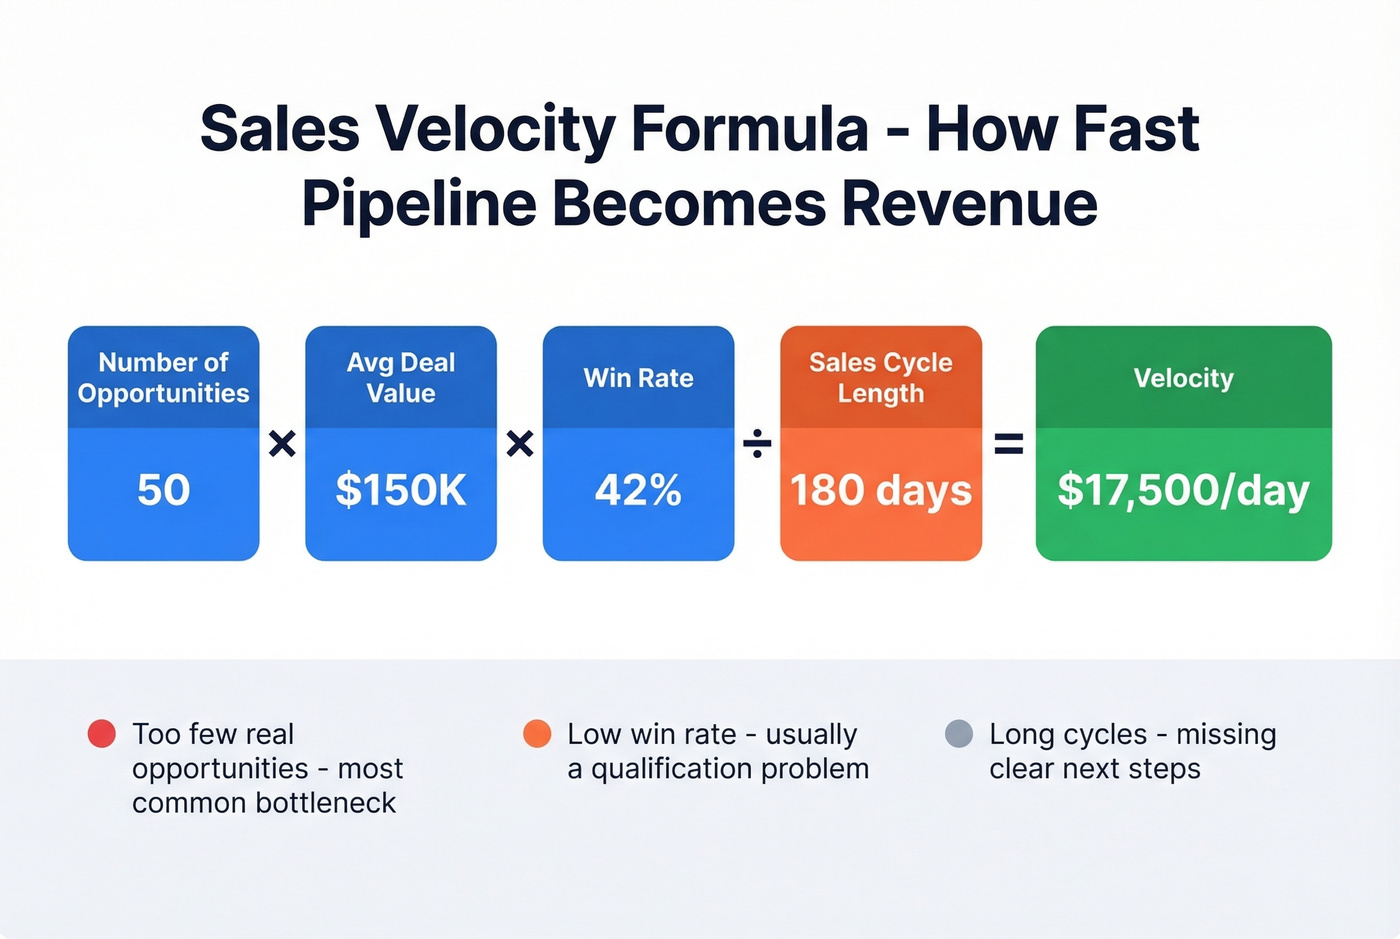
Sales velocity tells you how fast pipeline turns into revenue:
(number of opportunities x average deal value x win rate) / sales cycle length
A FirstPageSage analysis across 247 B2B organizations found SaaS averaging $1,847/day in pipeline velocity, with a 22% win rate and a 67-day cycle. Enterprise velocity is usually slower per day, but the math still exposes the same bottleneck: too few real opportunities, too low a win rate, or cycles that drag a on without clear next steps. (If you want a tighter diagnostic set, use a dedicated pipeline health view.)

Deal Execution and Win Rates
Enterprise win rate is often cited around 42%, but that number is only useful if you break it into ACV bands and cycle expectations. Time kills deals. Outreach data shows opportunities closed within 50 days hit a 47% win rate; once deals run long, win rates fall toward 20% or worse.
Here's the thing: if a deal is "still alive" but has slipped twice, treat it like it's lost until the buyer proves otherwise. That mindset forces better next steps, tighter mutual action plans, and cleaner forecasts.
Qualification is the lever most teams say they pull - and then don't. Ebsta's analysis of 655,000 B2B opportunities found well-qualified deals are 6.3x more likely to close, with a 50% win rate vs. 8% for poorly qualified ones. They also close faster and slip less. The point isn't the exact decimals; it's that qualification isn't paperwork - it's win probability. (If you need a repeatable framework, start with MEDDIC sales qualification.)
Forecast accuracy is the scoreboard for all of this. Fullcast's tiers are practical: 80-85% is acceptable, 85-95% is good, and 95%+ is world-class. Most enterprise orgs we've talked to land somewhere in the 75-85% range and treat it as normal. It shouldn't be. If you're evaluating tooling, compare sales forecasting solutions before you rebuild your process.
Forecast accuracy starts with pipeline truth - and pipeline truth starts with clean data. Prospeo enriches your CRM with 50+ data points per contact at a 92% match rate, refreshed every 7 days. Stop forecasting on stale records.
Hit 85%+ forecast accuracy by fixing the inputs, not the spreadsheet.
Revenue Outcomes That Matter
NRR is the enterprise growth metric that doesn't care how good your outbound is. Median NRR sits at 101%, which means the "average" company barely expands its existing base. Top performers hit 120%+ because they operationalize expansion, not because they "care more." (If you're modeling retention drivers, use a proper churn analysis lens.)
Expansion ARR now represents around 40% of new ARR at the median company and over 50% for companies above $50M ARR. If your CS and sales teams aren't aligned on expansion motions, your NRR will cap your valuation long before your pipeline does.
CAC payback for enterprise deals commonly runs 18-24 months, versus roughly 15-18 months as a broader SaaS median. That longer payback is fine when LTV supports it. A healthy LTV:CAC ratio is typically 3:1 to 5:1. Below 3:1, you're buying revenue at a loss. Above 5:1, you're probably starving growth. (For the CAC side, see cost to acquire customer.)
Enterprise Sales Cycle Benchmarks
Cycle length varies by both deal size and prospect company size. Use both tables when you plan capacity.
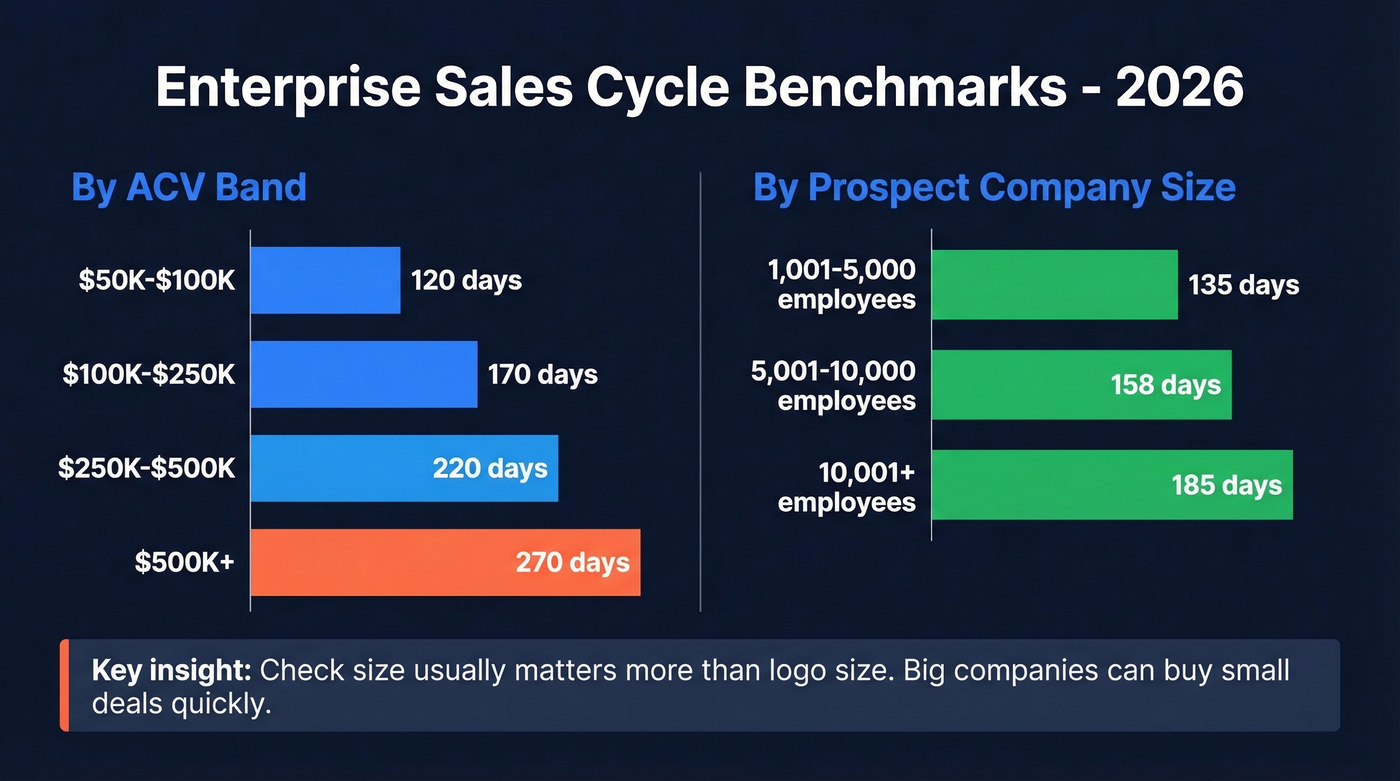
By ACV band:
| ACV Band | Avg. Cycle |
|---|---|
| $50K-$100K | 120 days |
| $100K-$250K | 170 days |
| $250K-$500K | 220 days |
| $500K+ | 270 days |
By prospect company size:
| Prospect Size | Avg. Cycle |
|---|---|
| 1,001-5,000 employees | 135 days |
| 5,001-10,000 employees | 158 days |
| 10,001+ employees | 185 days |
The insight most planning decks miss: check size usually matters more than logo size. Big companies can buy small deals quickly; mid-size companies can drag a "transformational" purchase out for months.
Metrics That Mislead Enterprise Teams
The r/sales community has a name for it: the "tyranny of metrics." Leaders manage to activity counts - calls, emails, meetings - so reps learn to optimize for the dashboard instead of the deal. You get a sea of green, a "busy" team, and a quarter that still comes in 30% short. We've watched teams hit their activity targets every week while their pipeline quietly rotted because nobody measured deal quality. (If you need a better baseline, start with sales activities examples that actually map to outcomes.)
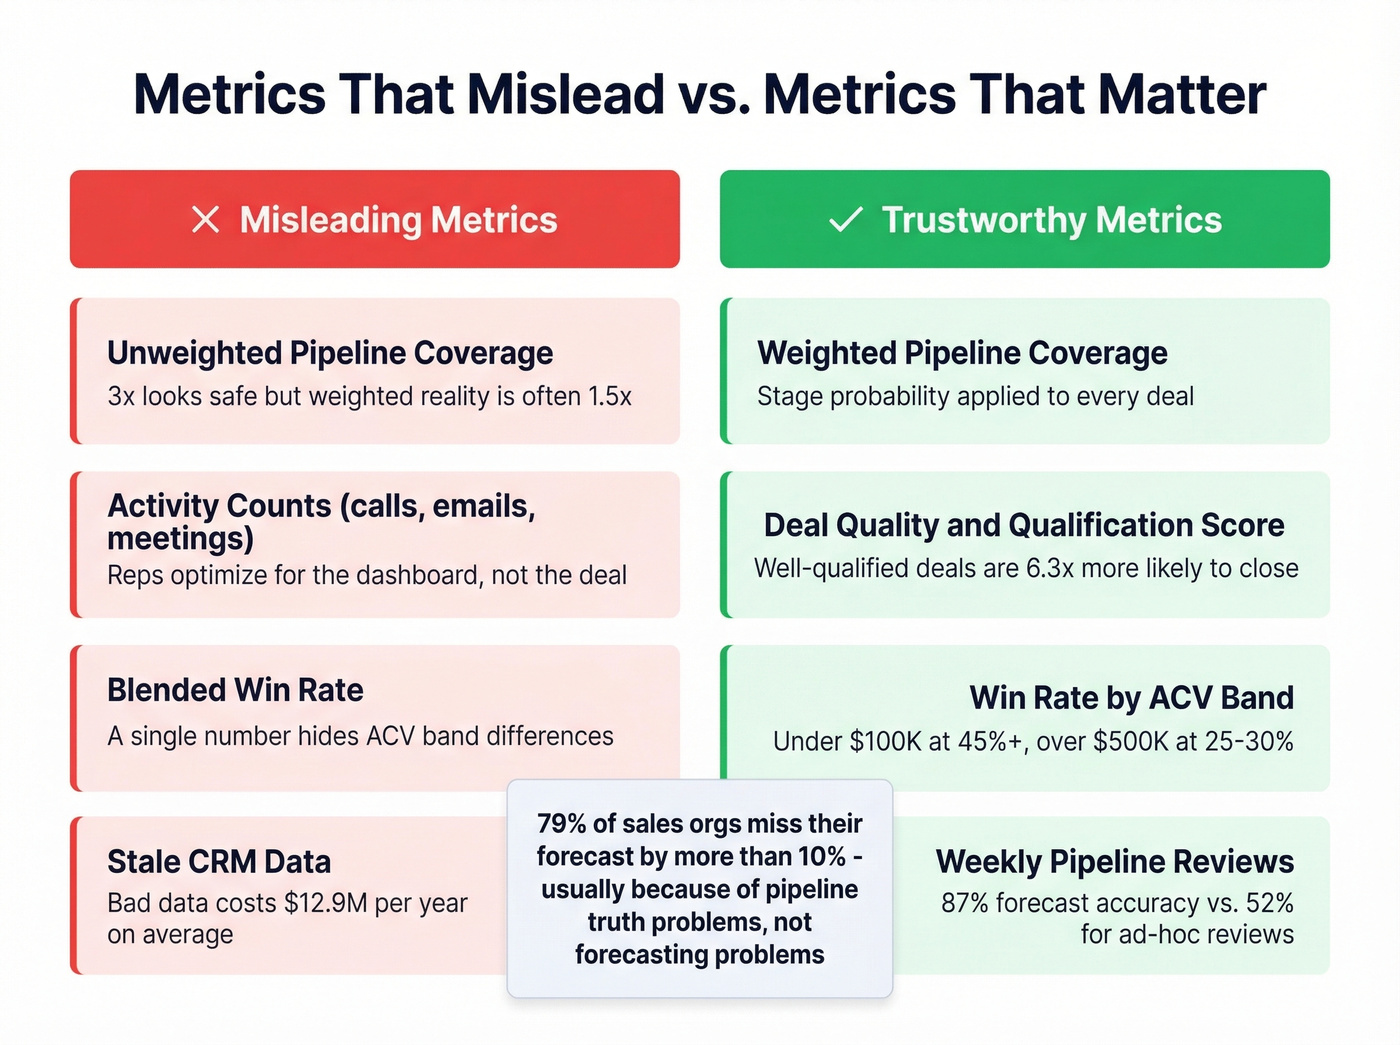
Unweighted pipeline coverage is the most common vanity metric in enterprise sales. It makes 3x coverage look safe when the weighted reality is closer to 1.5x.
And when your data is messy, it gets worse: poor data quality costs organizations $12.9M annually, and up to 30% of revenue potential gets lost to data issues. Let's be honest - most "forecast problems" aren't forecasting problems. They're pipeline truth problems. That's why 79% of sales organizations miss their forecast by more than 10%. If your inputs are inflated, your forecast is just a well-formatted guess.
Making Your Metrics Trustworthy
Two changes do more than any new dashboard: tighten your operating cadence and fix your inputs.
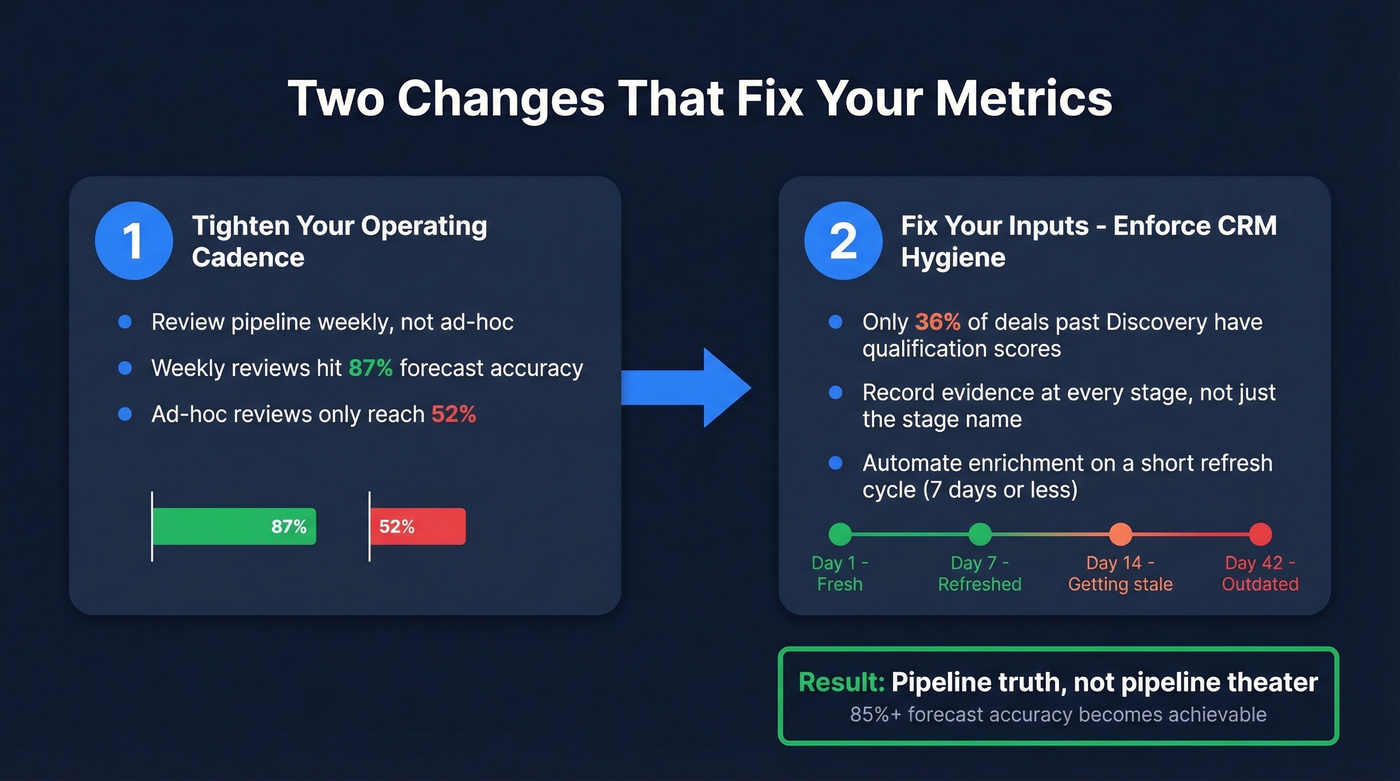
First, review pipeline weekly. Teams that review pipeline metrics weekly achieve 87% forecast accuracy versus 52% for teams that do it ad-hoc. Weekly inspection forces earlier intervention - before "end-of-quarter heroics" become the strategy.
Second, enforce CRM hygiene with real standards. One reason qualification "doesn't work" is that teams don't record it consistently: only 36% of deals past Discovery include both a qualification score and supporting notes. If you don't capture the evidence, you can't trust the stage, the probability, or the commit.
That's also where contact and account data quality matters. If your enrichment tool refreshes records every six weeks, your pipeline math is already stale by the time you run the report. Prospeo refreshes 300M+ professional profiles every 7 days and delivers 98% email accuracy, which means your CRM enrichment - returning 50+ data points per contact at a 92% match rate - actually reflects current reality instead of last quarter's contact list. If you're comparing vendors, start with data enrichment services and a practical lead enrichment checklist.
Skip the enrichment step if your CRM is already clean and current. But for most enterprise teams we've talked to, it isn't.

Enterprise win rates drop to 20% when deals drag. Reaching the right 6-10 stakeholders fast means having verified emails and direct dials - not guessing. Prospeo delivers 98% email accuracy and 125M+ verified mobiles so your reps connect before the deal stalls.
Shorten your 270-day cycle by reaching real buyers on the first attempt.
FAQ
What's the difference between sales metrics and KPIs?
Metrics are measurements; KPIs are the few metrics tied directly to strategic goals. For enterprise teams, keep 5-7 true KPIs - pipeline coverage, win rate, cycle time, forecast accuracy, and NRR - and use everything else as diagnostics when something slips.
How often should teams review pipeline metrics?
Weekly. Weekly reviews correlate with 87% forecast accuracy, while ad-hoc reviews drop to 52%. The goal isn't more meetings - it's catching slippage early enough to change the outcome, not just explain it later.
How do I fix bad CRM data skewing my forecasts?
Audit for missing titles, bounced emails, duplicates, and stale accounts, then automate enrichment on a recurring schedule. A tool with a short refresh cycle and high match rate - like Prospeo's 7-day cycle and 92% API match rate - keeps your dashboards grounded in current data instead of outdated contacts.
What's a good enterprise win rate benchmark in 2026?
Across B2B enterprise deals, 42% is the median. Break it down by ACV band for useful targets: deals under $100K often close above 45%, while $500K+ deals hover around 25-30%. Segment ruthlessly - a blended number hides more than it reveals.