The Only Excel Sales Tracking Template Guide You Actually Need
You downloaded a "free sales tracker" last month. It had 12 tabs, 30 columns, and a pivot table that broke the first time you added a row. Sound familiar?
Let's fix that - permanently.
Three paths, pick one:
- Grab a ready-made template - jump to the curated list below and start entering deals today.
- Build your own - follow the step-by-step tutorial here. You'll have a working sales tracking spreadsheet in under an hour.
- Browse options - check the comparison section for five free templates sorted by use case.
You need one template, not fifteen. Pick one, customize it for your pipeline, and commit for 30 days. The tracker that works is the one you actually use.
Why Excel Still Works for Sales Tracking
A lot of small teams still run their pipeline in spreadsheets, even if they've got a CRM somewhere in the stack. It makes sense: Excel is usually bundled with Microsoft 365, every rep already knows the basics, and there's zero onboarding friction.
The sentiment on r/CRM backs this up - people actively seek "simpler alternatives to Sales CRMs, like spreadsheets." They don't want a 6-month implementation. They want to open a file, type in deals, and see where their pipeline stands.
Here's the thing: the problem isn't Excel. It's bad Excel. A well-built tracker with validation, dropdowns, and locked formulas can carry a 5-person sales team for years. A sloppy one breaks in a week.
Essential Columns for Your Tracker
Every sales tracker needs the same core columns. Don't overthink this - start with eight and add later:
- Contact Name - first and last, in separate columns if you'll mail-merge later
- Company - the account name
- Deal Value - estimated revenue, in dollars
- Stage - dropdown: Prospect, Qualified, Proposal, Negotiation, Won, Lost
- Assigned Rep - who owns this deal
- Next Action Date - the single most important column for follow-up discipline
- Source - where the lead came from: inbound, outbound, referral, event
- Notes - free text for context; treat this as your sales note for each deal so nothing falls through the cracks
Eight columns. Teams with a well-managed pipeline grow faster because they follow up consistently and can actually trust their numbers - and "well-managed" doesn't mean complex. It means consistent data entry with clean inputs.
The columns are the easy part. The hard part is filling them with accurate data. If you're manually typing in email addresses from memory or copying them from old lists, every metric you build on top will be wrong. Prospeo verifies emails in real time with 98% accuracy - 75 free lookups a month, no credit card required. Clean data in, clean metrics out.

Build a Sales Tracking Spreadsheet From Scratch
Format Your Data as a Table
This is the single most important step, and most people skip it. Select your header row and data, then go to Insert > Table. Check "My table has headers" and click OK.
Why this matters: Excel Tables auto-expand when you add rows. Formulas using structured references like SalesPipeline[Value] automatically include new entries. Without a Table, every formula you write will eventually break when someone adds row 101 to a range that only covers rows 1-100. We've seen this kill trackers that worked perfectly for months, and it's always the same confused Slack message: "The dashboard says zero revenue?"
Name your table something useful - SalesPipeline works. Right-click the table, go to Table Design, and rename it in the top-left field.
Make two copies of your file right now - one to experiment with, one for real data. This saves you from the "I accidentally broke everything and can't undo" moment that hits everyone at least once.
Add Dropdown Menus
Create a new sheet called Lists. In column A, type your deal stages: Prospect, Qualified, Proposal, Negotiation, Won, Lost. In column B, type your lead sources: Inbound, Outbound, Referral, Event, Partner.
Go back to your main sheet. Select the entire Stage column, click Data > Data Validation, choose "List" from the Allow dropdown, and point the Source to your stages on the Lists sheet. Repeat for the Source column.
This prevents typos. "Quallified" vs "Qualified" will wreck your COUNTIF formulas. Reps click a dropdown instead of typing, which is faster and cleaner. The r/excel community constantly asks for trackers that are "streamlined, simple, and hard to break." When your sales team spans ages 20 to 75, dropdowns are how you get there.
Color-Code Deal Status
Select your Status column. Go to Home > Conditional Formatting > Highlight Cells Rules > Text that Contains. Create three rules:
- "Won" - green fill
- "Lost" - red fill
- "Open" or "Proposal" or "Negotiation" - yellow fill
Now your pipeline has instant readability. A glance tells you where deals stand without reading a single cell. This takes 90 seconds and makes the tracker feel like a real tool instead of a homework assignment.
Lock Formula Cells
Once you've added dashboard formulas (next section), protect them. Select the cells where reps enter data, right-click, go to Format Cells > Protection, and uncheck "Locked." Then go to Review > Protect Sheet. Leave "Select unlocked cells" checked.
Now reps can type in data columns but can't accidentally paste over your SUMIF formulas. This single step prevents the most common tracker death: someone copy-pasting a value over a formula and not noticing for three weeks.
How to Build a Sales Dashboard in Excel
Let's be honest - pivot tables are overrated for sales tracking. SUMIF and COUNTIF give you 90% of the insight with 10% of the complexity. The consensus on r/excel is that pivot tables "just don't work for me," and for a basic tracker, they're overkill.
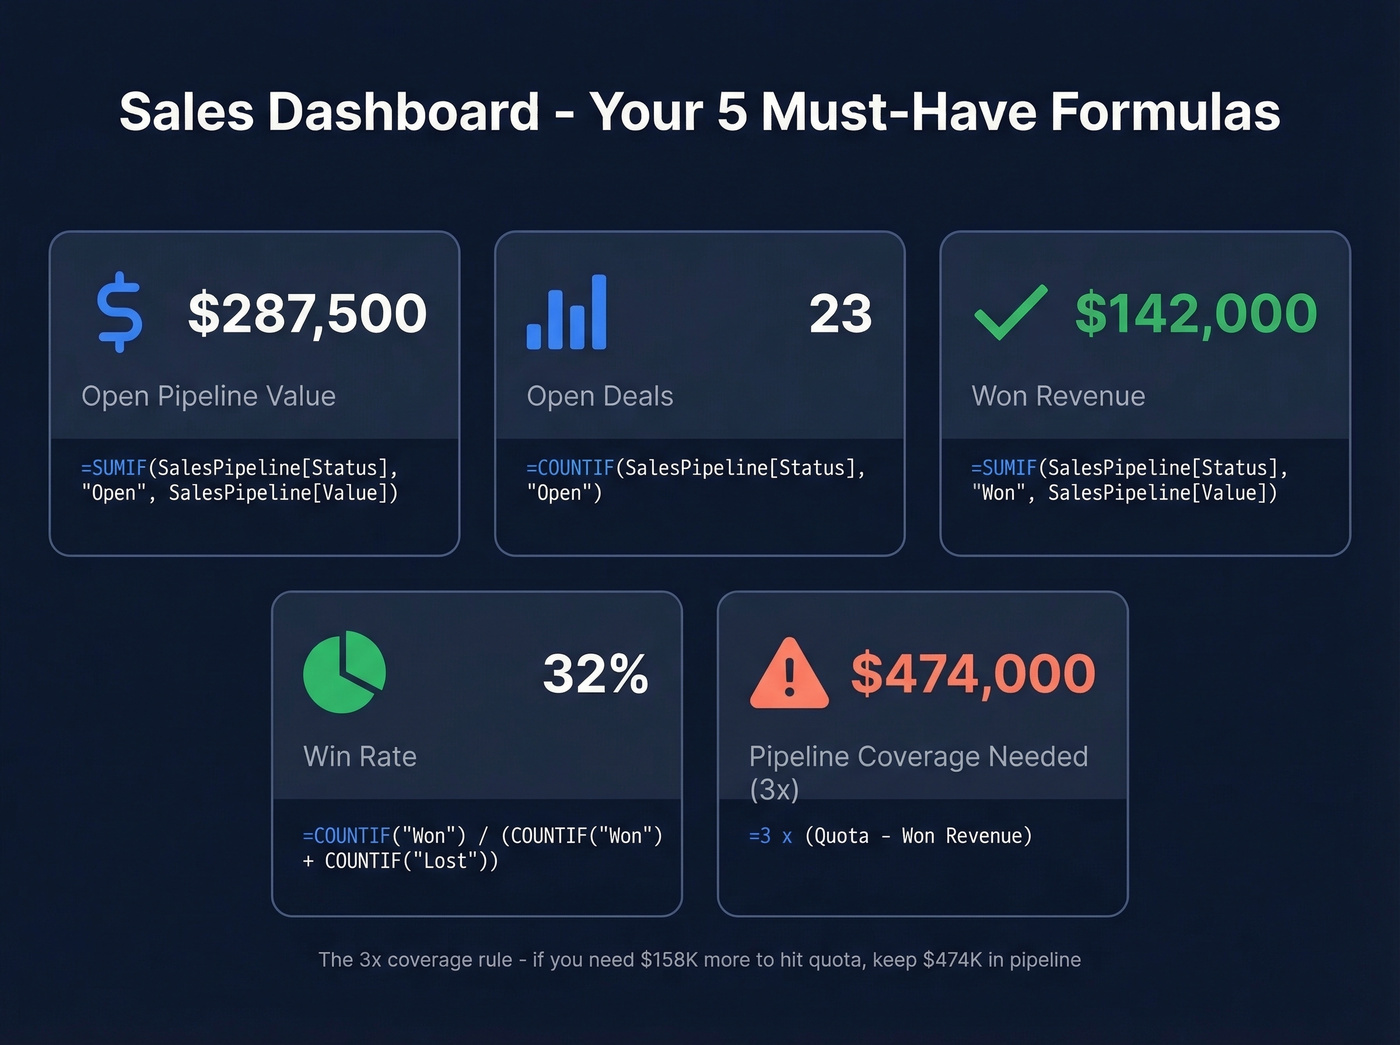
Create a Dashboard sheet with these formulas:
Open pipeline value:
=SUMIF(SalesPipeline[Status],"Open",SalesPipeline[Value])
Number of open deals:
=COUNTIF(SalesPipeline[Status],"Open")
Won revenue:
=SUMIF(SalesPipeline[Status],"Won",SalesPipeline[Value])
Win rate:
=COUNTIF(SalesPipeline[Status],"Won")/(COUNTIF(SalesPipeline[Status],"Won")+COUNTIF(SalesPipeline[Status],"Lost"))
Pipeline coverage (how much pipeline you need to hit quota):
=3*(QuotaTarget-SUMIF(SalesPipeline[Status],"Won",SalesPipeline[Value]))
That last one uses the 3x gap-to-quota heuristic from Gong - if you need $100K more to hit quota, you should have $300K in open pipeline. Only 29% of leaders think their forecasting generates accurate results. This formula won't fix forecasting, but it'll tell you whether you have enough pipe to have a shot. Once these five formulas are in place, you've got a reusable sales analysis template you can carry from quarter to quarter.
You just built a sales tracker with perfect formulas and locked cells. Now fill it with data that won't break your metrics. Prospeo gives you 98% verified emails, direct dials, and 50+ data points per contact - exported straight to CSV for your spreadsheet.
Stop hand-typing emails into your tracker. Verify them at $0.01 each.
Sales Metrics Worth Tracking
Once your tracker is running, add these KPIs to your dashboard:
| KPI | Formula | Example |
|---|---|---|
| CAC | Total spend / new customers | $10K / 20 = $500 |
| Avg deal size | Total revenue / deals closed | $50K / 25 = $2K |
| Sales cycle | Total days to close / deals | 450 / 15 = 30 days |
| Conversion rate | Won / (Won + Lost) x 100 | 30 / 100 = 30% |
| Dials/day | Count of calls / working days | 200 / 5 = 40/day |
For outbound teams, activity metrics matter as much as outcomes. Track dials per day, emails per day, and conversations per day. Set a target - 50 dials is a common starting point - and track actual vs. goal weekly. The gap between target and actual is where coaching conversations start (and where better sales activities definitions help).
Don't try to track everything. Five to seven KPIs is the sweet spot. More than that and you'll spend more time maintaining the tracker than selling.
Best Free Templates to Download
If building from scratch isn't your thing, grab one of these. We've reviewed dozens - these five are worth your time.
OnePageCRM Sales Tracker
The best all-around free option, and the one we'd recommend to most teams reading this. Color-coded follow-ups flag overdue items in red, today's tasks in orange, and future actions in grey. It includes a dashboard with six built-in reports and separate views per rep. Works in both Excel and Google Sheets, though email reminders are Google Sheets-only.
The "Next Actions" sorting concept is genuinely useful - it's the closest a spreadsheet gets to CRM-style follow-up discipline. In our experience, this is the template that sticks for teams who've burned through two or three others already, because it forces a single question every day: what's the next thing I need to do on this deal? If you want to standardize the outreach that follows, keep a set of sales follow-up templates handy.
Gong Pipeline Template
If your manager asks for forecast accuracy every Monday morning, start here. The pipeline coverage calculator bakes in the 3x gap-to-quota heuristic, and the weekly tracking tabs include activity metrics plus leaderboards. Available in Excel and Google Sheets.
GTMnow Activity Spreadsheet
Built for outbound teams who live and die by activity volume. Weekly tracking with goal vs. actual columns across 13 template categories. Google Sheets format. Skip this if you're running inbound - it's laser-focused on dials, emails, and conversations. Pair it with a simple sales prospecting routine so the activity turns into pipeline.
Salesflare Pipeline Template
Clean layout with customizable stage tracking. Good starting point if your sales process has non-standard stages that don't fit the typical Prospect-to-Won flow. You can adapt the reporting cadence from weekly to monthly by adjusting the date filters.
Smartsheet Sales Tracker
Overkill for most sales teams, but useful if you're tracking complex, multi-step enterprise deals. Multiple views - grid, Gantt, card - with exportable formats. Smartsheet's native format, but you can export to Excel. If your deal cycle is under 30 days, you don't need this.
Google Sheets vs Excel
| Feature | Google Sheets | Excel |
|---|---|---|
| Real-time collab | Native, instant | Needs OneDrive setup |
| Large datasets | Slows on very large sheets | Handles larger datasets better |
| Advanced charts | Limited options | Stronger visualization |
| Personal pricing | Free | $69.99/yr (M365) or $179.99 one-time |
| Business pricing | $6-18/user/mo | $6-12.50/user/mo |
Every formula in this guide works in both. Sheets wins for teams that need multiple reps editing simultaneously. Excel wins for larger datasets and more sophisticated charting. Per Zapier's comparison, Excel's pivot table manipulation and recommended charts features are still ahead.
I'll say it plainly: if your team is under 10 people and you're not doing advanced analysis, just use Google Sheets. It's free, it's collaborative, and you'll never deal with "which version of this file is current?" The version-conflict problem alone kills more trackers than bad formulas do.
Mistakes That Kill Your Tracker
- Copy-pasting over formulas. Someone pastes a value into your SUMIF cell. Your dashboard shows $0 for three weeks before anyone notices. Lock formula cells.
- Blank rows "for spacing." They break filters, sorts, and any future pivot tables. Use borders or shading for visual separation instead.
- Merged cells. They look nice and destroy sorting. Use "Center Across Selection" under Format Cells > Alignment instead.
- No data validation. Without dropdowns, you'll get "Closed," "closed," "CLOSED," and "Closed-Won" in the same column. Your COUNTIF returns garbage.
- Inconsistent date formats. MM/DD/YYYY in one row, DD-MMM-YY in the next. Set the column format once and enforce it with validation.
- Stale contact data. If you pulled those emails six months ago, half have bounced or changed jobs. Bad data corrupts every metric downstream - your win rate, your conversion numbers, your pipeline coverage. It all starts with whether the person on the other end actually receives your email. (If you're doing outbound, it also helps to understand email bounce rate basics.)
A SUMIF formula on bad contact data still gives you bad numbers. Prospeo refreshes 300M+ profiles every 7 days - so the emails and company data you paste into your tracker are accurate the week you use them, not the month you found them.
Clean data in, clean dashboard out. 75 free lookups, no card required.
When to Switch to a CRM
Switch if multiple reps are editing the same file and version conflicts are constant, you're managing more than 1,000 active leads, weekly reporting takes hours of manual formula maintenance, or follow-ups are slipping because there's no automated reminder system.
Stay on Excel if you're a solo founder or team of 2-3, your deal volume is under 50 active opportunities, and you don't need automated sequences or email tracking.
The good news: most CRMs import CSV and Excel files directly. Your tracker isn't wasted work - it's your migration file. An excel sales tracking template is often the fastest way to prototype your pipeline process before committing to paid software. If you're evaluating tools, start with a few examples of a CRM and a lightweight contact management software shortlist.
FAQ
Can I use Google Sheets instead of Excel?
Yes - every formula in this guide works identically in Google Sheets. Sheets is better for real-time collaboration with multiple reps. Excel handles larger datasets and offers stronger charting. Google Sheets is free for personal use; Excel requires Microsoft 365 at $6/user/mo for business. Pick Sheets for small teams, Excel for heavy analysis.
How many deals can Excel handle before it slows down?
Excel handles tens of thousands of rows comfortably if you use Tables, avoid merged cells, and skip volatile formulas like INDIRECT. Most sales teams hit collaboration limits - version conflicts, overwritten data - long before they hit performance limits. Above 1,000 active leads, consider a CRM.
What columns should a sales tracking spreadsheet have?
At minimum: Contact Name, Company, Deal Value, Stage, Assigned Rep, Next Action Date, Source, and Notes. That's eight columns. Add more only after you've used the tracker consistently for 30 days and know what's actually missing. Most people add too many columns upfront and abandon the tracker because data entry takes too long.
How do I keep contact data accurate inside the tracker?
Use a verification tool before adding emails to your spreadsheet. Prospeo's 5-step verification process catches invalid addresses, spam traps, and catch-all domains at 98% accuracy - 75 free lookups per month. A weekly audit of bounced or unresponsive contacts keeps your pipeline numbers honest and your win-rate calculations reliable.
How do I create a pipeline report in Excel?
Use the Dashboard sheet approach from this guide. Start with SUMIF and COUNTIF formulas referencing your main data table, then group deals by stage to see opportunity distribution. The Gong template section above has a ready-made pipeline report you can adapt. For per-rep breakdowns, add a COUNTIFS formula filtering by both rep name and stage.