How to Calculate TAM, SAM, and SOM in 2026 (With Examples)
42% of startups fail because there's no market need for what they built - a figure CB Insights has tracked for years. Not because the product was bad. Because the founders never sized the market properly. We've seen it firsthand: an AI-driven CRM startup inflated its TAM using a single top-down analyst number, spent broadly on acquisition, and burned through runway chasing a market that didn't exist at the scale they'd pitched. The TAM looked great on a slide. The bank account told a different story.
Knowing how to calculate TAM, SAM, and SOM is the difference between a fundraise that closes and one that stalls. Here's exactly how to do it, with worked examples and the formulas investors actually trust.
Quick Summary
Four methods exist for calculating TAM: top-down, bottom-up, value theory, and external research. Bottom-up is the most defensible because it forces you to count real accounts instead of citing analyst reports.
Your SOM should never be an arbitrary percentage of SAM. Derive it from sales capacity and unit economics: reps x meetings x win rate x deal size. That's what separates a credible pitch from a hand-wave.
What Are TAM, SAM, and SOM?
Think of three concentric circles. The outermost ring is your Total Addressable Market (TAM) - total revenue if every possible customer bought your product. It's the theoretical ceiling.
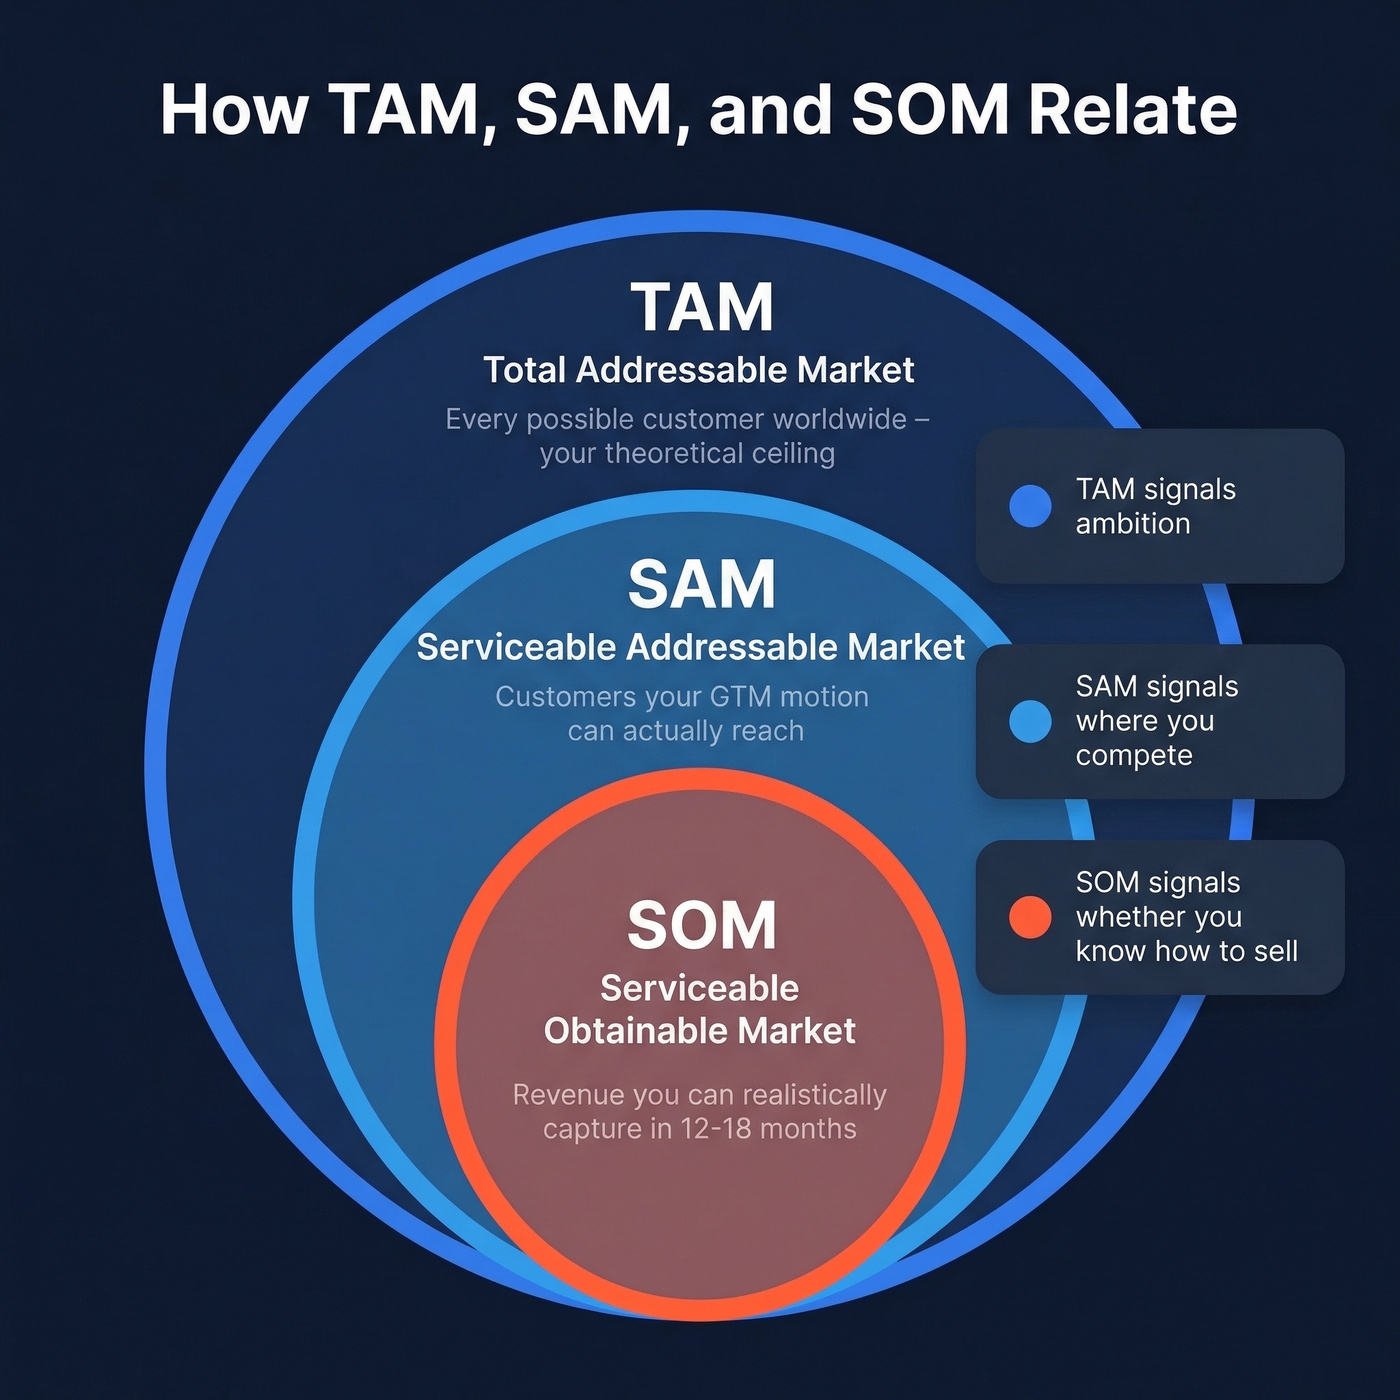
The middle ring is your Serviceable Addressable Market (SAM) - the portion of TAM your product and go-to-market motion can actually reach. Geography, language, channel, and product fit narrow the field here.
The innermost ring is your Serviceable Obtainable Market (SOM) - realistic revenue you can capture in the near term, given current resources, team size, and competitive position. SOM is the number that matters most for your next 12-18 months.
Confusing these three is one of the fastest ways to lose investor credibility. TAM signals ambition, SAM signals where you'll actually compete, and SOM signals whether you know how to sell. Understanding these distinctions early prevents costly strategic mistakes down the road - and saves you from the embarrassment of a pitch deck where SAM is somehow larger than TAM (yes, we've seen it happen).
Four Methods for Market Sizing
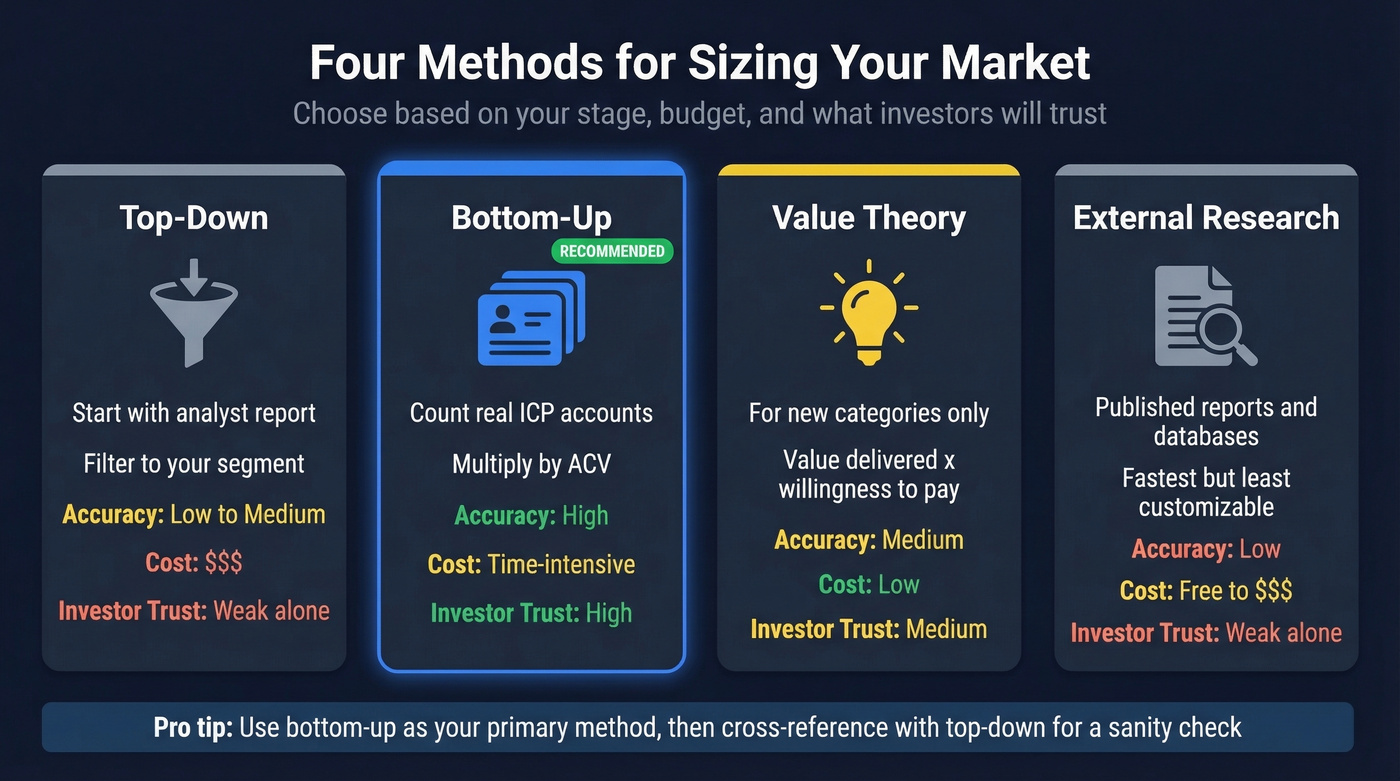
There are four recognized approaches. Each has a different accuracy profile, cost, and credibility level with investors.
| Method | Best For | Accuracy | Cost | Investor Credibility |
|---|---|---|---|---|
| Top-Down | Quick context | Low-Medium | Thousands per report | Weak standalone |
| Bottom-Up | Primary estimate | High | Time-intensive | High |
| Value Theory | Novel categories | Medium | Low | Medium-High |
| External Research | Sanity checks | Low | Free-thousands | Weak standalone |
Top-Down
Start with a broad industry number from an analyst report (Gartner, IDC, Forrester), then apply filters to narrow it to your segment. The formula is straightforward: Industry Revenue x Your Segment's Share = TAM. It's fast and useful for context, but dangerous as your sole method. Analyst reports often cost thousands of dollars, and they define markets differently than you do. Use top-down to sanity-check your bottom-up number, not to replace it.
Bottom-Up
Count the actual accounts that match your ICP, then multiply by your average revenue per account. Number of Addressable Accounts x ACV = TAM. This is the most defensible method because it proves you've done the work - you've gone out and identified real companies, not just cited a Gartner quadrant. The hard part is getting an accurate count of addressable accounts, which is where firmographic databases and filters earn their keep.
Value Theory
Skip this unless you're genuinely creating a category. Economic Value Delivered x Portion Customers Will Pay x Number of Potential Customers = TAM. The Toptal framework positions value theory as the go-to when your product is a positive trade-off versus incumbent options and there's no clean comp. Let's be honest though: most founders who reach for value theory are just avoiding the work of counting accounts.
External Research
Pull numbers from published reports, databases, or industry associations. Fastest method, least customizable - you're inheriting someone else's market definition. One founder on r/startups literally proposed combining two data sources and dividing by two. That shortcut produces a number that's neither accurate nor defensible. Understand why sources differ - different market definitions, different years, different methodologies - then pick the one closest to your actual segment.
Step-by-Step Calculation
B2B SaaS Example
You're building a compliance automation platform for mid-market fintech companies. Here's bottom-up TAM in action.
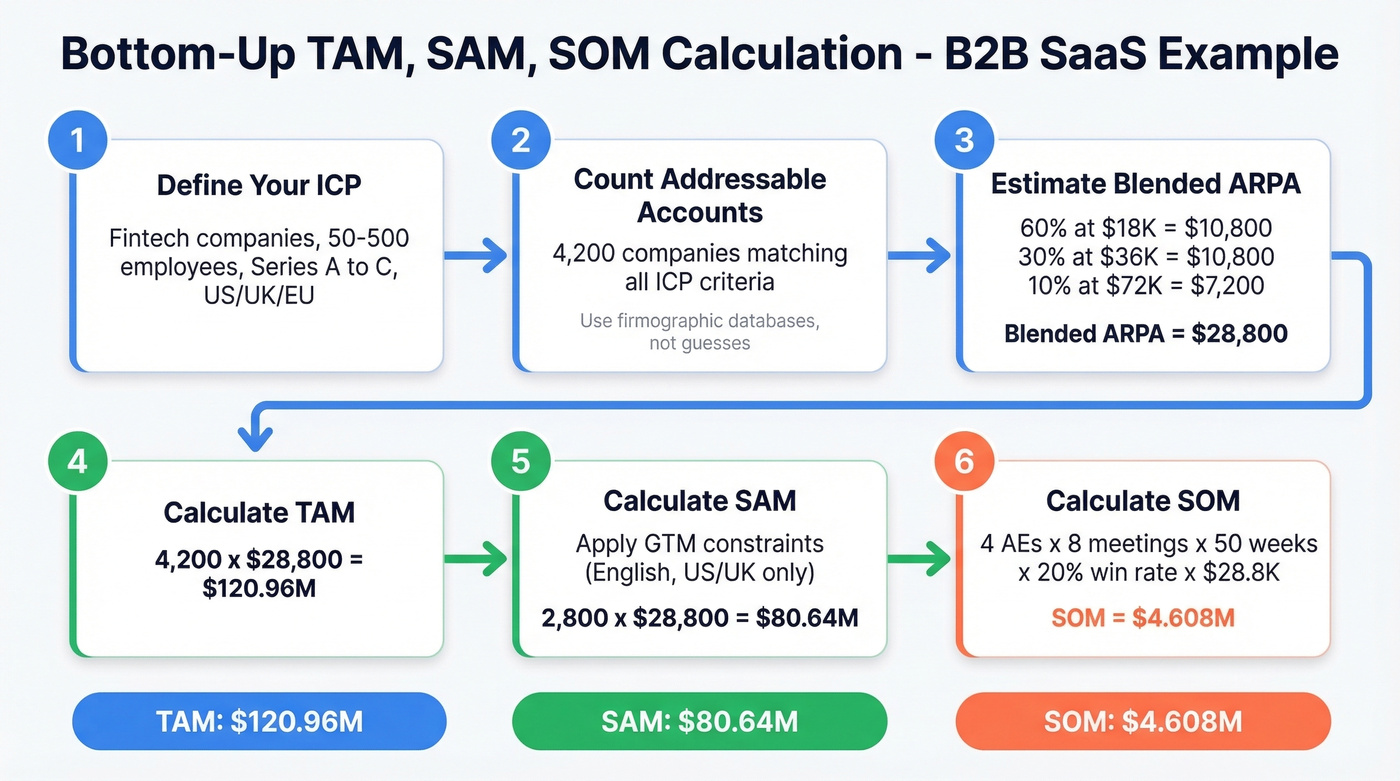
Step 1: Define your ICP. Fintech companies, 50-500 employees, Series A through Series C, operating in regulated markets (US, UK, EU).
Step 2: Count addressable accounts. This is the step most founders shortcut - and it's the one that matters most. You need an actual count of companies matching your criteria. Prospeo's B2B database lets you filter by industry, headcount, revenue, geography, and technographics across 30+ dimensions to get a real number instead of a guess. For this example, let's say you find 4,200 companies.
Step 3: Estimate ARPA (Average Revenue Per Account). Factor in pricing tier distribution and expansion revenue. If 60% of accounts land on your $18K/year plan, 30% on the $36K plan, and 10% on enterprise at $72K, your blended ARPA is $28,800.
Step 4: Multiply. TAM = 4,200 x $28,800 = $120.96M.
Step 5: Calculate SAM. Apply GTM constraints. If you only have English-language support and US/UK payment infrastructure, your SAM isn't "everyone who can access your website." A common SaaS founder mistake is treating SAM as global because the product is technically accessible worldwide - but if 90% of your revenue comes from the US and UK, your SAM is the US and UK. That narrows to 2,800 accounts: SAM = 2,800 x $28,800 = $80.64M.
Step 6: Calculate SOM. Derive from unit economics (next section).
For scale reference, WeWork's pitch deck sized TAM at $1.35T, SAM at $168B, and SOM at $33.8B. Those numbers looked impressive on slides - and we all know how that ended. Big TAM numbers without defensible SOM math are a liability, not an asset.
Consumer/DTC Example
For a DTC skincare brand targeting women 25-40 in the US who buy premium skincare online, start top-down: the US skincare market is roughly $25B. Apply demographic filters (women 25-40 = ~30% of buyers), channel filter (online-only = ~35% of sales), and premium price point filter (~20% of online sales). That gives you $25B x 0.30 x 0.35 x 0.20 = $525M TAM. Then validate bottom-up with Census data and Statista. If the two numbers land within 20-30% of each other, you're in the right range.
Marketplace/Platform Example
Two-sided marketplaces complicate things because you have supply-side and demand-side TAM. An event staffing marketplace needs enough venues posting gigs and enough workers accepting them. Size both sides independently, then recognize your revenue is a take rate on transactions between them.
Here's the thing: the TAM/SAM/SOM framework partially breaks down for network-effect businesses. Your SOM isn't just constrained by sales capacity - it's constrained by marketplace liquidity. For early-stage platforms, focus on a single geography or vertical where you can achieve density, and size that beachhead market as your SOM.
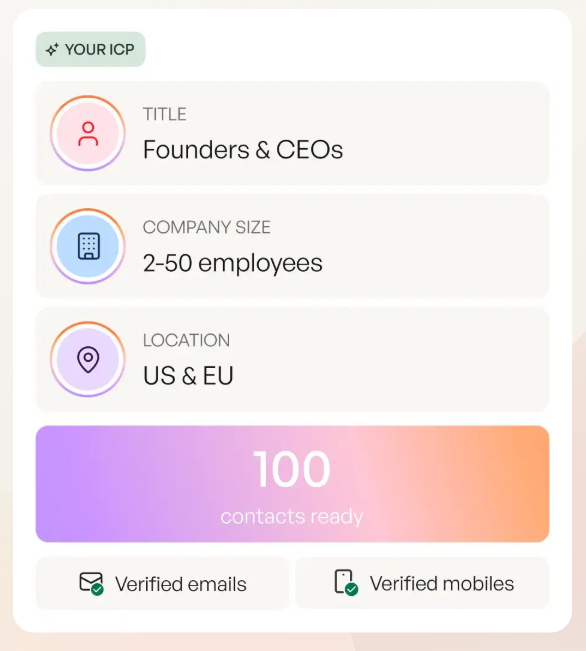
Bottom-up TAM requires an actual count of companies matching your ICP - not a guess from an analyst report. Prospeo's B2B database gives you 30+ filters including industry, headcount, revenue, funding stage, and technographics across 300M+ profiles so you can size your addressable market with real numbers.
Count your addressable accounts in minutes, not weeks.
Deriving SOM from Unit Economics
SOM is where most founders lose credibility. The r/startups consensus is that "1-10% of SAM" is the default advice founders receive. Investors see right through it.
Here's the formula that actually holds up:
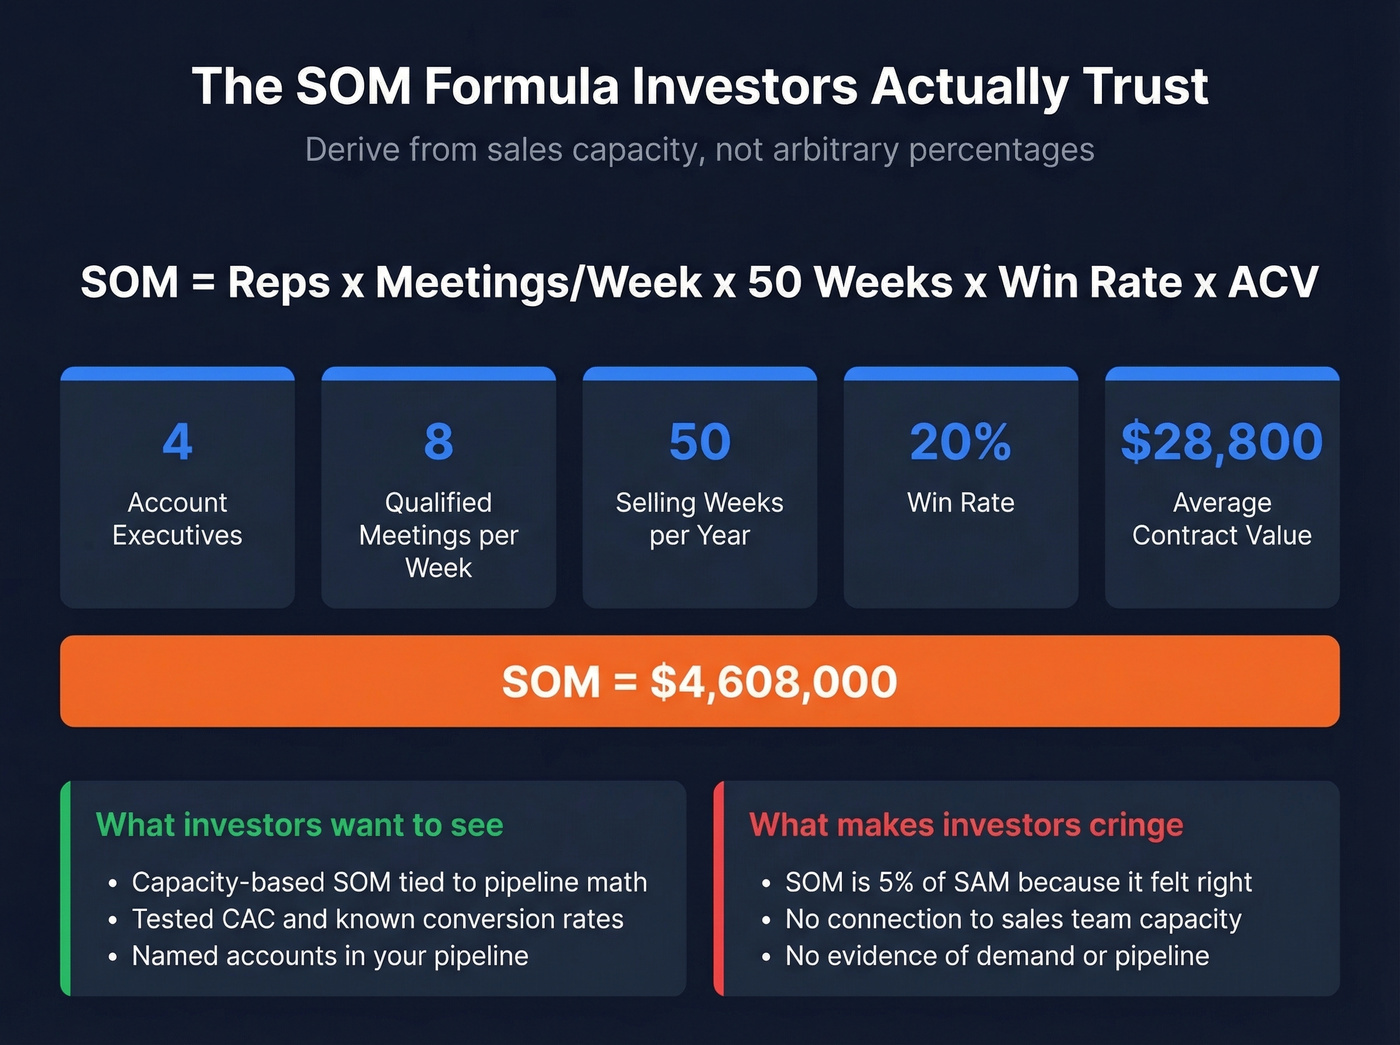
SOM = Number of Reps x Meetings/Week x 50 Weeks x Win Rate x ACV
Then constrain by your marketing budget and realistic CAC. If you have 4 AEs taking 8 qualified meetings per week, closing at 20%, on a $28.8K ACV: SOM = 4 x 8 x 50 x 0.20 x $28,800 = $4.608M.
That's a capacity-based SOM grounded in real inputs. It's testable, auditable, and it shows investors you understand your own GTM motion. GoingVC makes the same point: SOM should be grounded in tested CAC, existing pipeline, and known conversion rates.
In our experience, bottom-up TAM takes longer than top-down, but it closes more investor conversations. The extra work pays for itself.
What Investors Look For
Green flags:
- Bottom-up TAM with named account counts
- SAM reflecting actual GTM constraints, not "everyone online"
- Capacity-based SOM tied to pipeline math and CAC
- Multiple methods cross-referenced
- For seed-stage: an "earlyvangelists" segment - the 50-100 accounts most likely to buy first, with evidence of demand
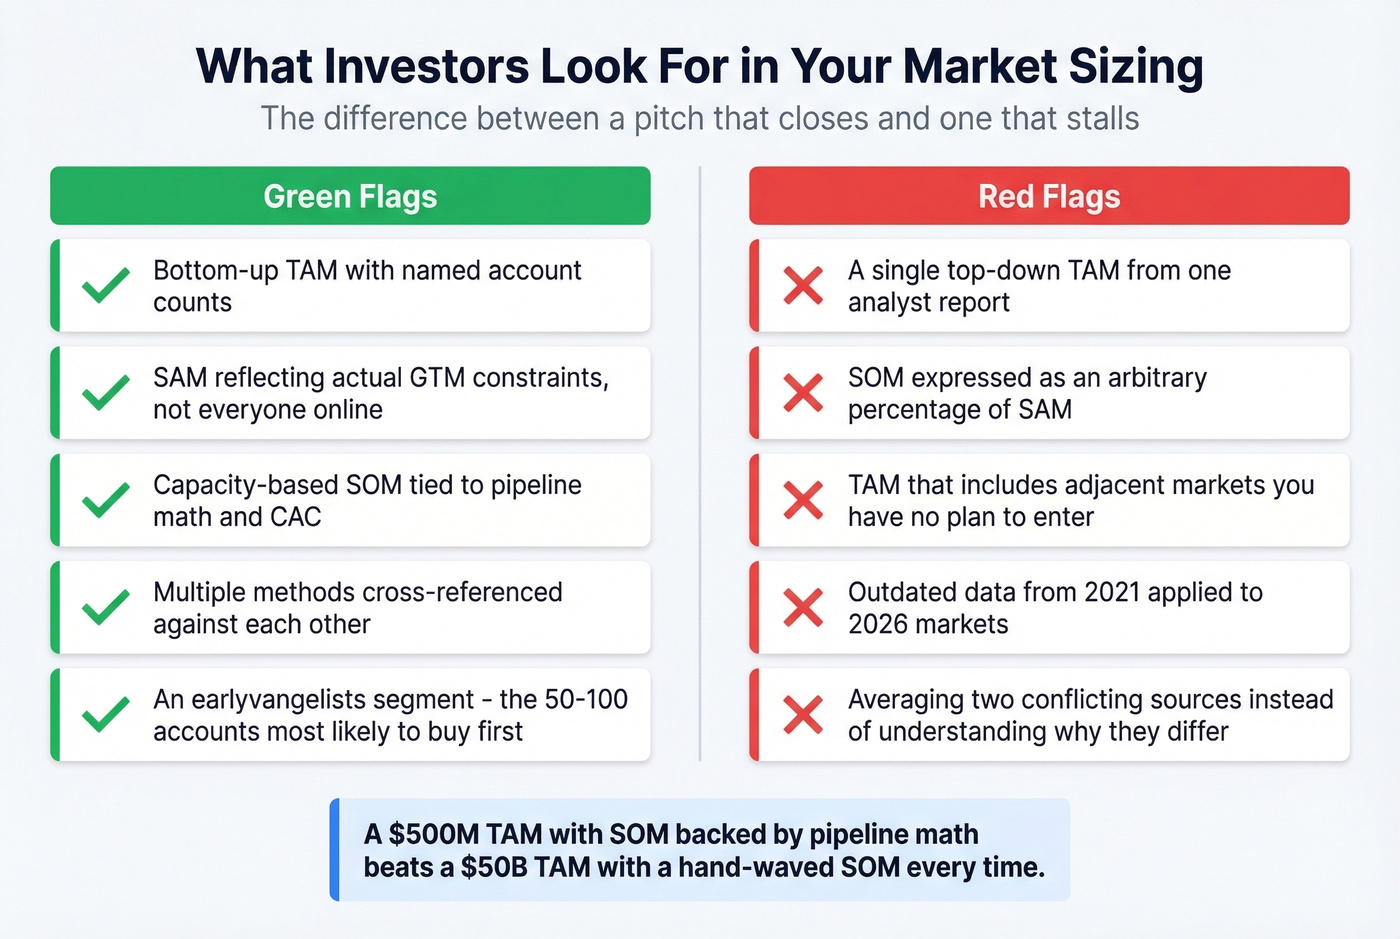
Red flags:
- A single top-down TAM from one analyst report
- SOM expressed as an arbitrary percentage of SAM
- TAM that includes adjacent markets you have no plan to enter
A $50B TAM with a hand-waved SOM is less impressive than a $500M TAM with SOM backed by pipeline math. If your TAM is under $100M, that's not a death sentence - it's a signal to investors that you understand your market. Investors fund execution clarity, not market size fantasies.
Beyond Fundraising
Market sizing isn't just a pitch deck exercise. A rigorous TAM/SAM/SOM analysis informs territory planning, hiring roadmaps, and marketing budget allocation. When your SOM is capacity-based, you can reverse-engineer exactly how many reps to hire next quarter and how much pipeline marketing needs to generate.
Teams that revisit their market sizing quarterly make better resource allocation decisions than those who treat it as a one-time fundraising artifact. We've watched companies drift for two or three quarters before realizing their ICP shifted and their old TAM number was meaningless.
Common Mistakes
Relying only on top-down. A Gartner number isn't your TAM - it's the industry's. Always validate with bottom-up.
Ignoring geographic restrictions. Your SaaS is "global" in theory. Your support team speaks English and Spanish. Your SAM is English and Spanish-speaking markets. Period.
Averaging two sources instead of triangulating. If one report says $8B and another says $14B, the answer isn't $11B. Understand why they differ, then pick the one closest to your segment.
Using outdated data. A 2021 market report doesn't reflect 2026 realities - AI markets have changed dramatically since then. Update your inputs.
Treating SOM as an arbitrary percentage. "We'll capture 5% of SAM" tells investors nothing. Derive SOM from your sales capacity and unit economics.
Never updating. Market sizing isn't a one-time slide. Update quarterly, or whenever you change pricing, enter a new market, or shift your ICP.
Free Tools and Data Sources
| Resource | Type | Price | Best For |
|---|---|---|---|
| HubSpot Calculator | 5 calculators | Free | Quick TAM/SAM math |
| Theory27 Template | Sheets/Excel + Slides | Free | B2B SaaS sizing |
| Prospeo B2B Database | Firmographic database | Free tier available; paid ~$0.01/email | Counting addressable accounts |
For free data sources: U.S. Census Bureau, Bureau of Labor Statistics, SEC EDGAR 10-K filings, World Bank, OECD, Statista free tier, and SimilarWeb free tier all provide usable market data. Bottom-up sizing with free sources and a B2B database is often more practical for cash-conscious startups than paying thousands for analyst reports.
Your SOM calculation is only as good as the accounts you can actually reach. Prospeo delivers 98% email accuracy and 125M+ verified mobile numbers - so when you derive SOM from reps × meetings × win rate × deal size, you know the contacts behind those numbers are real.
Turn your SOM from a slide deck number into booked pipeline.
FAQ
What's the difference between TAM and SAM?
TAM is total revenue at 100% market share globally. SAM narrows that to the segment your product and GTM motion can actually serve - filtered by geography, language, and channel. A $120M TAM might shrink to $80M SAM once you exclude regions without local payment infrastructure.
How do I calculate SOM without historical data?
Model it from sales capacity: reps x weekly qualified meetings x win rate x deal size x 50 weeks. Four AEs at 8 meetings/week with a 20% close rate on $29K deals yields ~$4.6M SOM. That's far more defensible than picking an arbitrary SAM percentage.
Which TAM method do investors prefer?
Bottom-up, because it demonstrates you've counted real accounts and validated assumptions with data. Firmographic databases with 30+ filters make the account-counting step faster than manual research, and the specificity signals to investors that you've done the work.
How often should I update my market sizing?
Quarterly at minimum, or whenever you enter a new market, change pricing, or shift your ICP. Treat it as a living model - stale numbers from even 12 months ago can misrepresent fast-moving categories like AI or fintech.