How to Forecast Sales for a New Product With Zero Data
Finance wants a revenue forecast for your product launch in 90 days. You have zero customers, zero sales history, and a prototype. Every guide on how to forecast sales for a new product assumes you have last year's numbers to extrapolate from - but you're staring at a blank spreadsheet.
Bad forecasts aren't just embarrassing. Inventory distortion costs businesses $1.77T per year, and flawed demand predictions are a primary driver. Whether you're projecting revenue for a single launch or across an entire portfolio, the challenge is the same: you need a defensible number. Here's a framework that starts from nothing and gets you there.
What You Need (Quick Version)
- A bottom-up funnel model grounded in controllable inputs - how many people you can reach, engage, and convert (see funnel metrics to pick the right inputs)
- 3-5 analog products to benchmark your ramp trajectory
- Scenario ranges instead of a single number, because a single-point forecast for a new product is irresponsible
Expect 50-70% accuracy in the first six months. That's normal, not failure.
Step-by-Step Forecasting Framework
Size Your Market (TAM to SAM to SOM)
Start broad and narrow down. TAM is total market demand. SAM is the segment you can actually reach given positioning, geography, and distribution. SOM is the share you can realistically convert in year one.
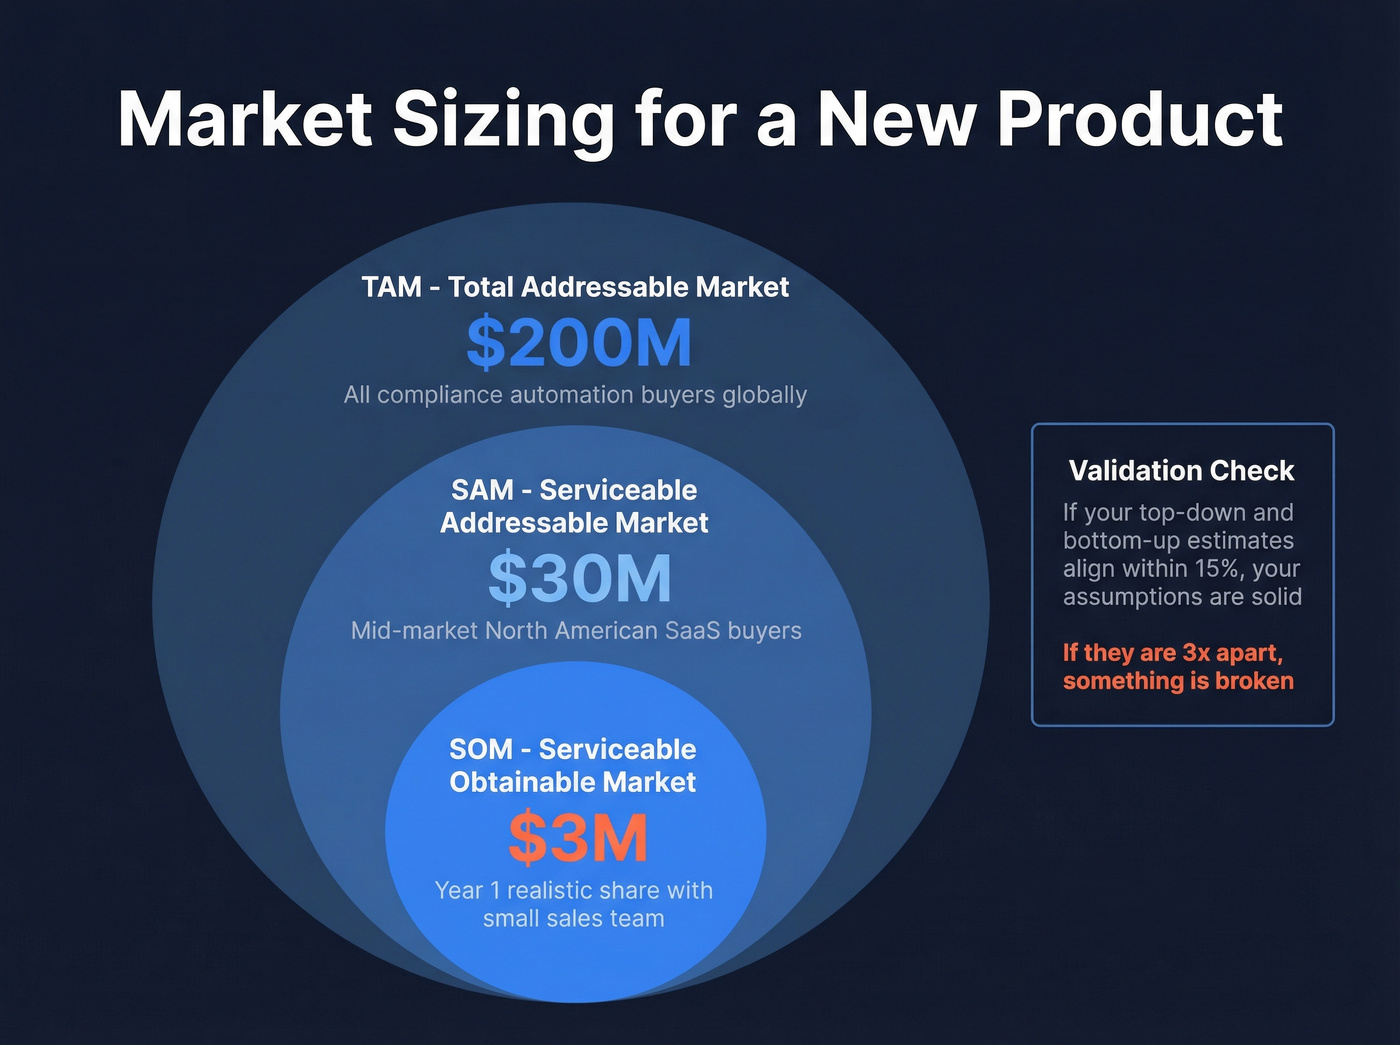
A worked example: you're launching a compliance automation tool for mid-market financial services firms. TAM is $200M. SAM - mid-market North American SaaS buyers - narrows to $30M. SOM, given a small sales team and no brand recognition, lands around $3M.
Run both a top-down and bottom-up estimate. If they align within roughly 15%, your assumptions are solid. If they're 3x apart, something's broken.
If you need a refresher on TAM to SAM to SOM, start there, then map it to your addressable market.
Find 3-5 Analog Products
You don't have your own data, but someone else has launched something similar. An IQVIA study of 813 product launches across eight developed markets found the average time to peak volume was 13.3 quarters - roughly 3.5 years. That's your ramp reality check.
Don't pick just one comparable. Build a basket and evaluate each on four dimensions: core benefit, competitive landscape at launch, pricing model, and distribution channel. We've seen teams that skip the analog step end up with forecasts 2-3x off in the first two quarters. A single analog gives you a single story. Three to five give you a range, and ranges are what keep you honest.
Build a Bottom-Up Funnel Model
Here's the thing: saying "we'll capture 1% of TAM" is fiction without an acquisition plan behind it. The percentage is coming out of thin air. Bottom-up forces you to ground every assumption in something controllable, and this is what separates credible new product forecasting from wishful thinking.
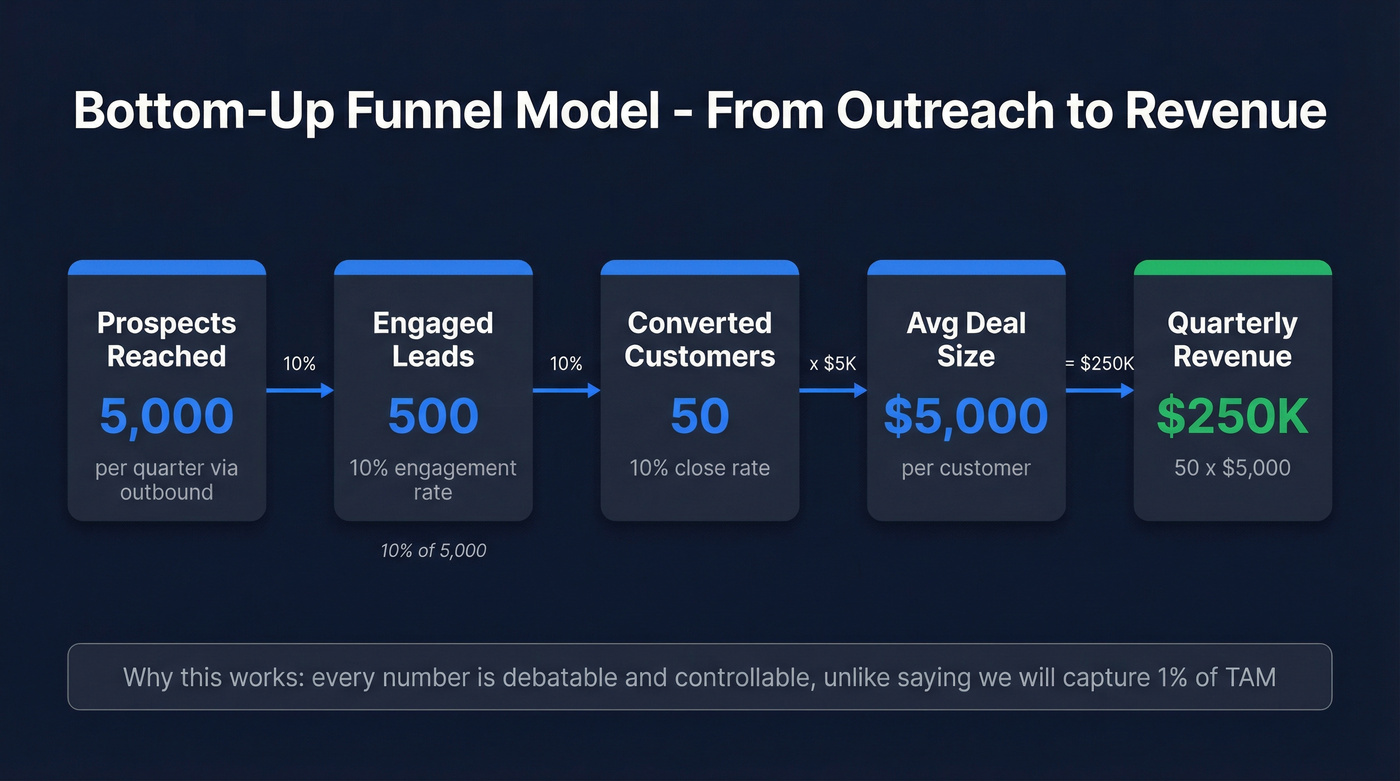
Walk through the funnel with real numbers. Your outbound team can reach 5,000 prospects per quarter. 10% engage meaningfully - that's 500 engaged leads. 10% of those convert, giving you 50 customers. At $5,000 average deal size, that's $250K in quarterly revenue. Every number in that chain is debatable, and that's exactly the point. You can argue about whether 10% engagement is realistic based on your channel and ICP (use an ideal customer profile to keep targeting consistent). You can't argue about whether "1% of a $200M market" means anything without knowing how you'll actually get there.
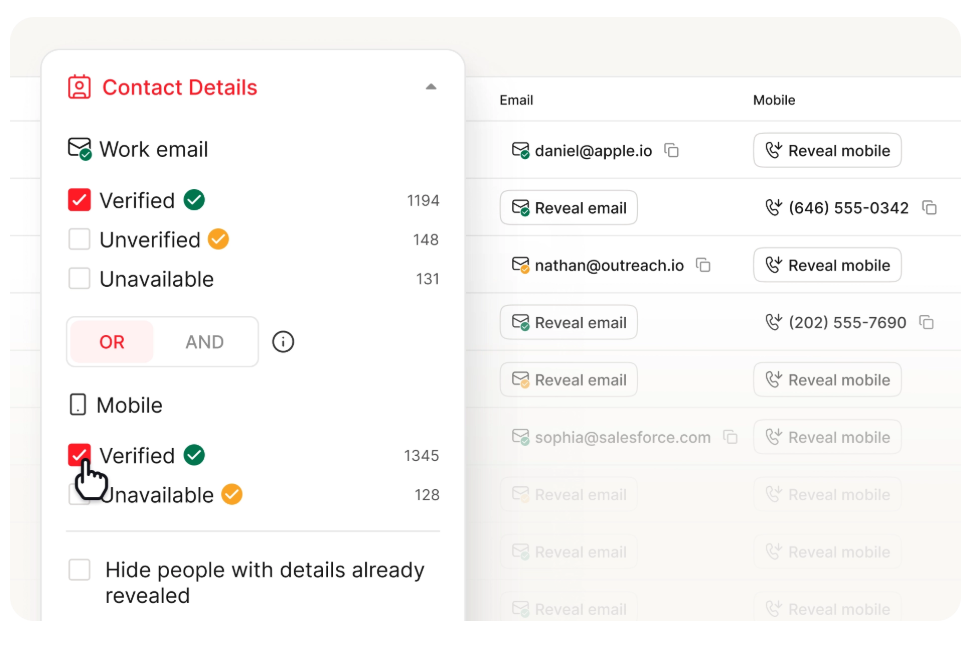
This is also where you validate assumptions with real outreach before committing to a forecast. Build a test list of 200 prospects matching your ICP using a tool like Prospeo, run cold emails (use sales prospecting techniques to pressure-test channels), and measure actual reply and conversion rates. Real data from 200 emails beats a month of spreadsheet modeling.
Layer in Scenario Ranges
A single number is a guess. Three numbers are a model.
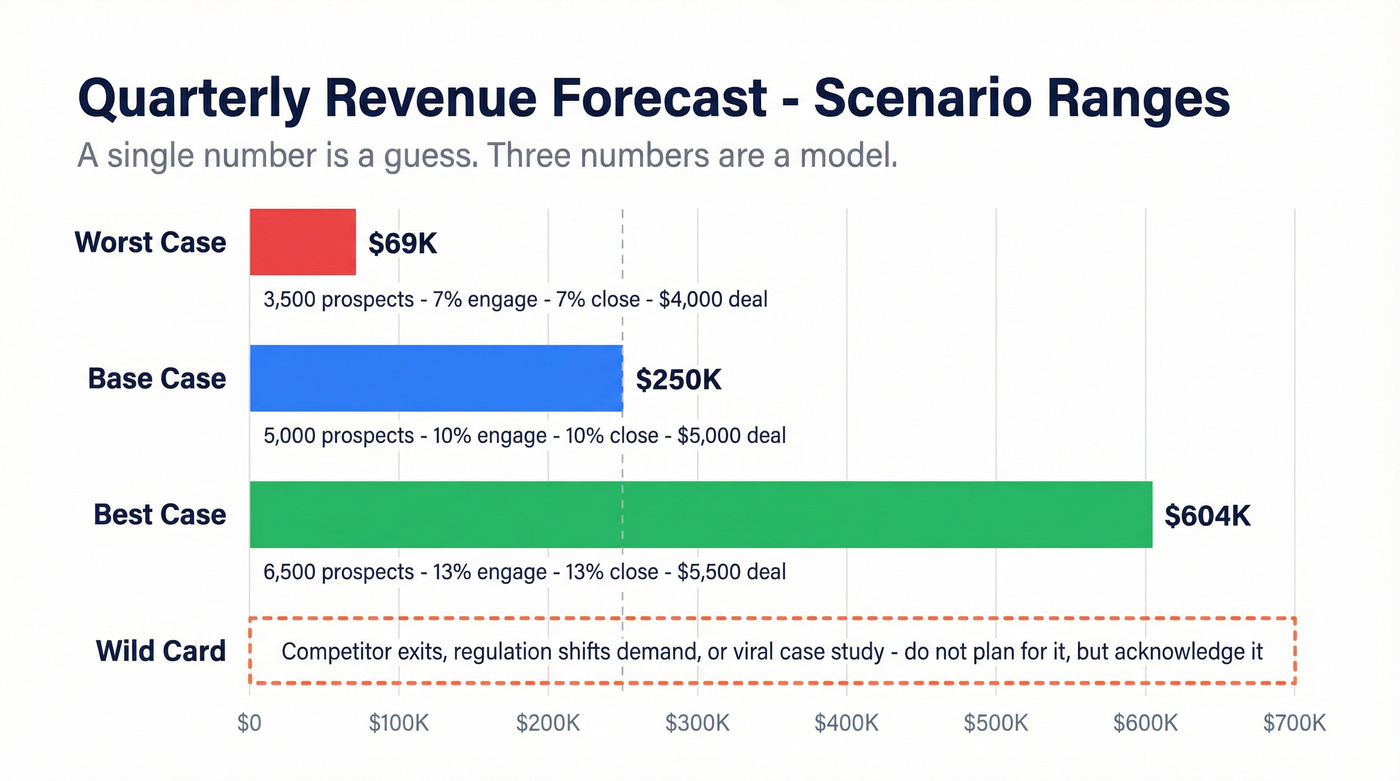
Flex your key variables - win rates by plus or minus 15-25%, deal velocity by plus or minus 20-30% - and build three scenarios plus a wild card.
| Variable | Worst Case | Base Case | Best Case |
|---|---|---|---|
| Prospects reached | 3,500 | 5,000 | 6,500 |
| Engagement rate | 7% | 10% | 13% |
| Close rate | 7% | 10% | 13% |
| Avg deal size | $4,000 | $5,000 | $5,500 |
| Quarterly revenue | $69K | $250K | $604K |
The wild card scenario accounts for something structural changing - a competitor exits, a regulation shifts demand, or your product goes viral from a single case study. Don't plan for it, but acknowledge it exists.
Validate With Early Demand Signals
Before you have real sales, you have proxies:
- Pre-orders and waitlists - the strongest signal of actual demand
- Pilot results - even 10 paying customers tell you more than any model
- Search trend volume for your category and problem keywords
- Community interest - the consensus on r/startups and niche subreddits can reveal whether people are actively looking for what you're building or just mildly curious
- Cannibalization - if your new product pulls revenue from an existing one, net it out
Plan to transition from analog-based forecasting to actual-data forecasting at 8-12 weeks of real sales. That's when your own numbers become more reliable than borrowed ones.
Your forecast is only as good as the outreach data behind it. Build a test list of 200 ICP-matched prospects with Prospeo's 30+ search filters, send real cold emails to 98% verified addresses, and replace spreadsheet assumptions with actual engagement rates.
Stop modeling conversion rates. Measure them with real outreach.
Forecasting Methods at a Glance
| Method | Best For | Accuracy | Data Needed |
|---|---|---|---|
| Top-Down Sizing | Early TAM framing | Low (30%+) | Market reports |
| Analog Products | Ramp trajectory | Medium (20-30%) | 3-5 comparables |
| Bottom-Up Funnel | Revenue modeling | Medium-High (15%) | Funnel metrics |
| Weighted Pipeline | Active deals | High (10-15%) | CRM data |
| Bass Diffusion | Adoption curves | Medium (15-25%) | p, q, m params |
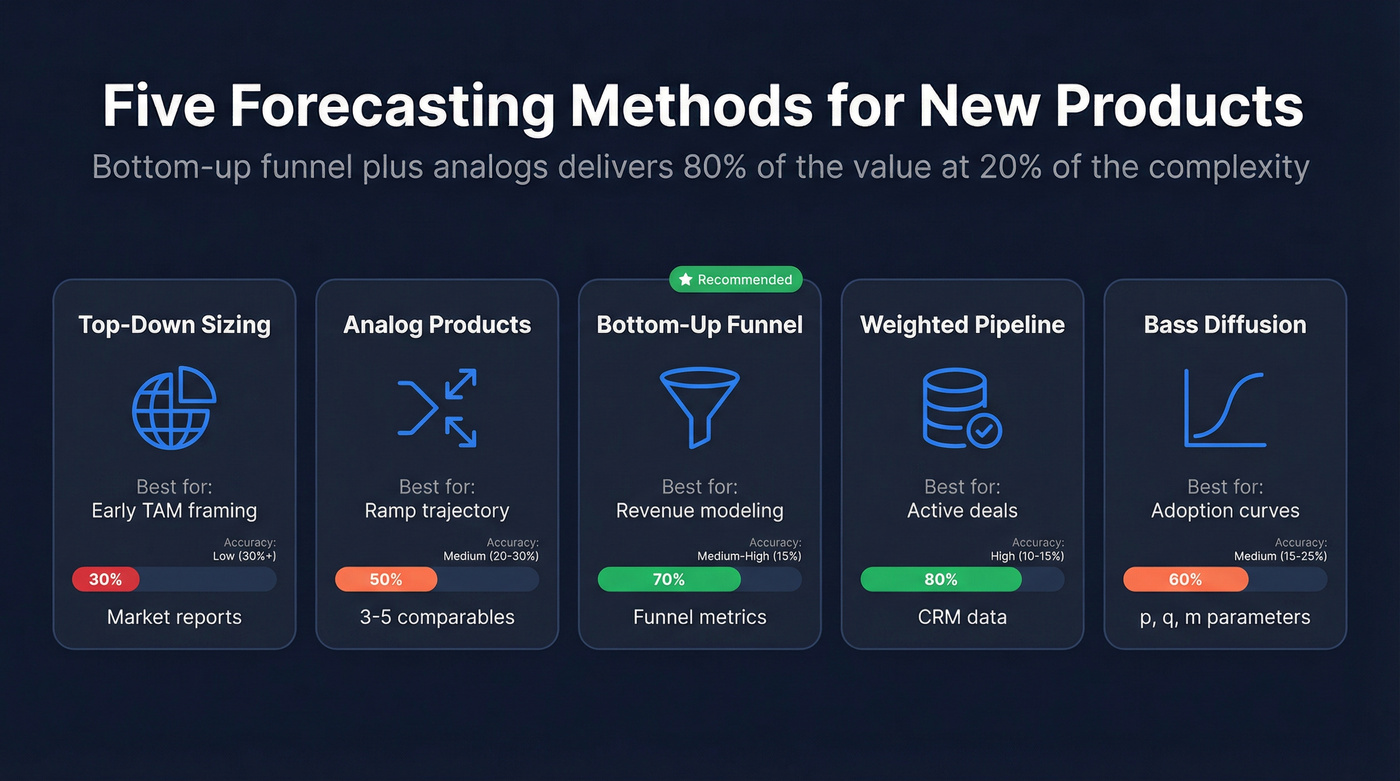
The Bass diffusion model captures why early hypergrowth flattens - adoption follows an S-curve, not a straight line. But for most teams launching a first product, the bottom-up funnel paired with analogs delivers 80% of the value at 20% of the complexity. Skip Bass unless you're in a category with well-documented adoption data.
If you're evaluating software to operationalize this, compare sales forecasting solutions and best sales forecasting tools before you commit.
Accuracy Expectations
Let's be honest: forecasting without a backlog feels like educated guessing, and plenty of FP&A practitioners on Reddit will tell you exactly that. Established teams with years of data still struggle to stay consistently accurate. For a new product, 50-70% in the first six months is the realistic benchmark.
Track MAPE and bias monthly. Bias reveals whether you're systematically over- or under-forecasting, which matters as much as headline accuracy - a forecast that's always 20% high is more useful than one that swings wildly in both directions, because you can adjust for a consistent lean.
Our take: If your average deal is under $10K and you're pre-revenue, spending weeks building an elaborate forecast model is a waste. Build the simplest bottom-up funnel, validate it with 200 real outreach emails, and iterate monthly. In our experience, the bottom-up model pays for itself in the first board meeting - it's the only approach that answers "how will you actually get there?"
Anyone promising better than 70% accuracy on a brand-new product is selling software.
Common Mistakes
Linear extrapolation of early growth. Your first month doubled. That doesn't mean you'll 64x by month six. Remember New Coke - Coca-Cola's market research predicted a hit, but the model ignored brand loyalty entirely. Adoption follows an S-curve, not a straight line.
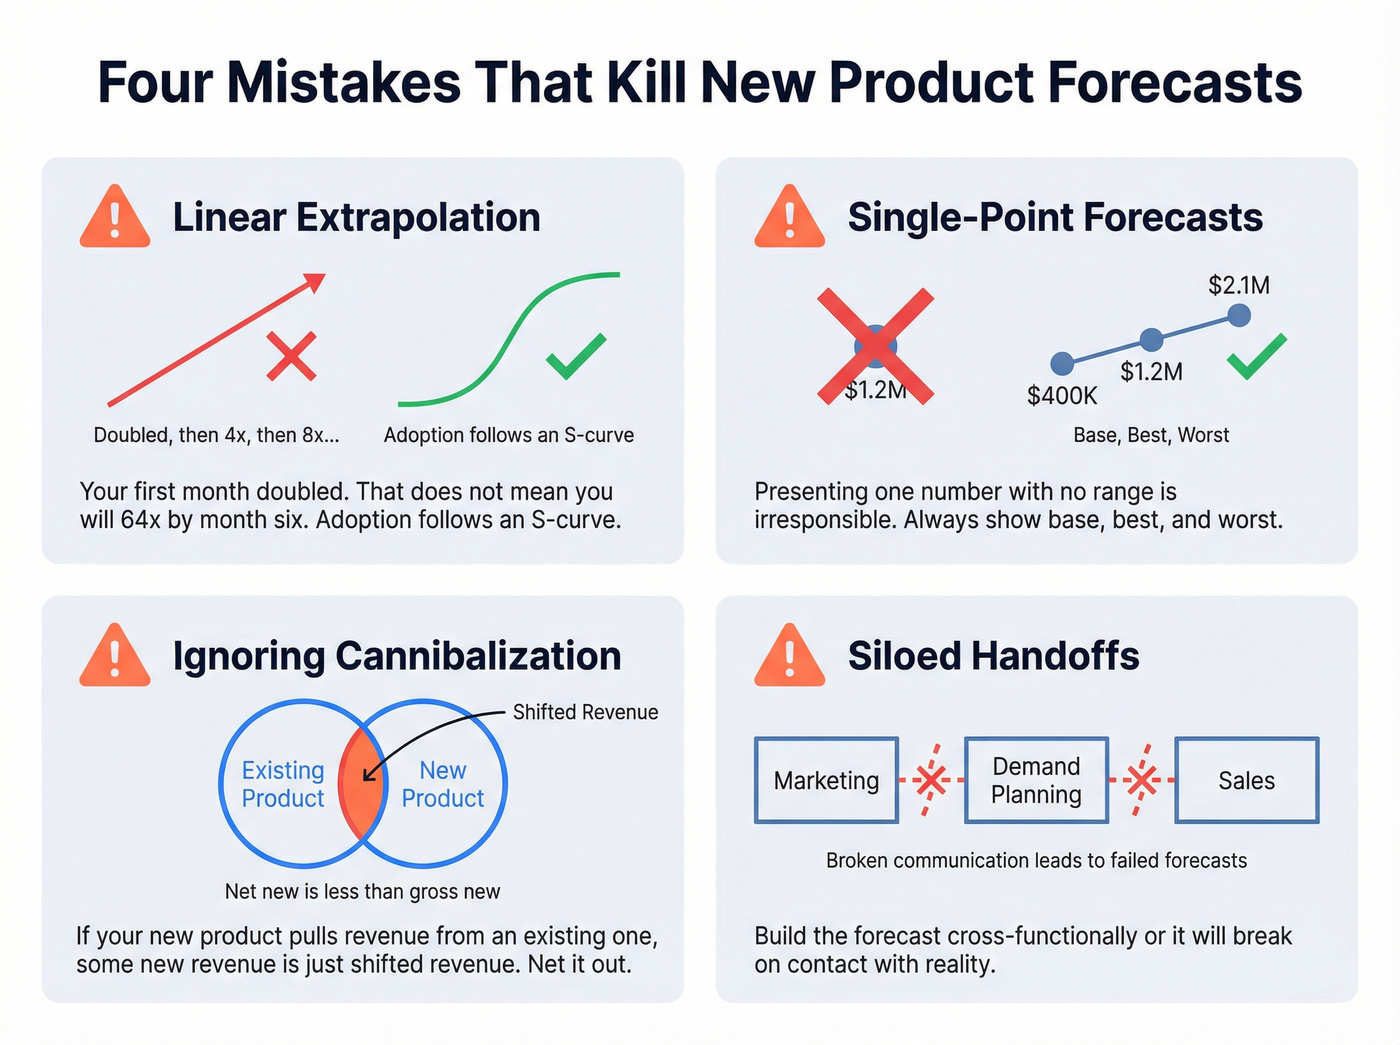
Single-point forecasts with no range. Presenting "$1.2M in year one" without a range is irresponsible. Present base, best, and worst. Leadership can handle nuance, and they'll trust you more for showing it.
Ignoring cannibalization. If your new product overlaps with an existing one, some "new" revenue is just shifted revenue. Net it out. This is especially critical when you're forecasting for multiple products that serve overlapping segments.
Siloed handoffs. Marketing creates the forecast, demand planning inherits it unchallenged. Build the forecast cross-functionally or it'll break on contact with reality. I've watched a team miss Q1 by 40% because nobody looped in the sales org until the number was already in the board deck.
If your forecast keeps missing because the pipeline is weak (not the math), start with sales pipeline challenges and pipeline health.
Bottom-up forecasting requires knowing exactly how many prospects you can reach and engage. Prospeo gives you 300M+ verified profiles with buyer intent, technographics, and job change signals - so every number in your funnel model is grounded in real, reachable contacts at $0.01 per email.
Ground every funnel assumption in contacts you can actually reach.
FAQ
How accurate should a new product sales forecast be?
Expect 50-70% accuracy in the first six months - that's the realistic benchmark for any product without historical data. Track MAPE and forecast bias monthly; bias reveals whether you're systematically over- or under-forecasting, which matters as much as headline accuracy.
How do you forecast sales with no history?
Pair a bottom-up funnel model (reach, engage, convert) with 3-5 analog products for ramp benchmarking, then wrap everything in scenario ranges. This gives you controllable inputs, external validation, and a defensible range instead of a single guess.
What tools help validate a new product forecast?
Use a prospecting platform to build a test list of 200 ICP-matched contacts, run cold outreach, and measure real reply and conversion rates before committing to projections. Combine that with free spreadsheet templates from Salesflare or Zapier to model your funnel scenarios.
Does this framework work for multiple products?
Yes. Run the bottom-up funnel and analog analysis independently for each product, then consolidate into a portfolio view. Account for cannibalization and shared resources - if two products compete for the same team's bandwidth or the same buyer's budget, your combined forecast needs to reflect that constraint.