How to Measure Sales Performance: 8 Metrics That Actually Predict Revenue
It's Monday morning. The VP of Sales opens the dashboard - 30 charts, six tabs, a pipeline number that looks different from last week's for reasons nobody can explain. The CFO asks one question: "Are we going to hit the number?" Silence.
If you want to know how to measure sales performance, the answer isn't more dashboards. It's fewer, better metrics. 69% of B2B reps missed quota last year, and most sales orgs still can't explain why until it's too late. Over in r/Sales_Professionals, practitioners constantly ask for ways to measure productivity beyond quota - metrics that explain why top reps outperform, not just that they do. The problem isn't a lack of data. It's a lack of the right data, reviewed at the right cadence.
Leading vs. Lagging Indicators
Every sales metric falls into one of two buckets. Leading indicators tell you what's about to happen. Lagging indicators tell you what already happened.
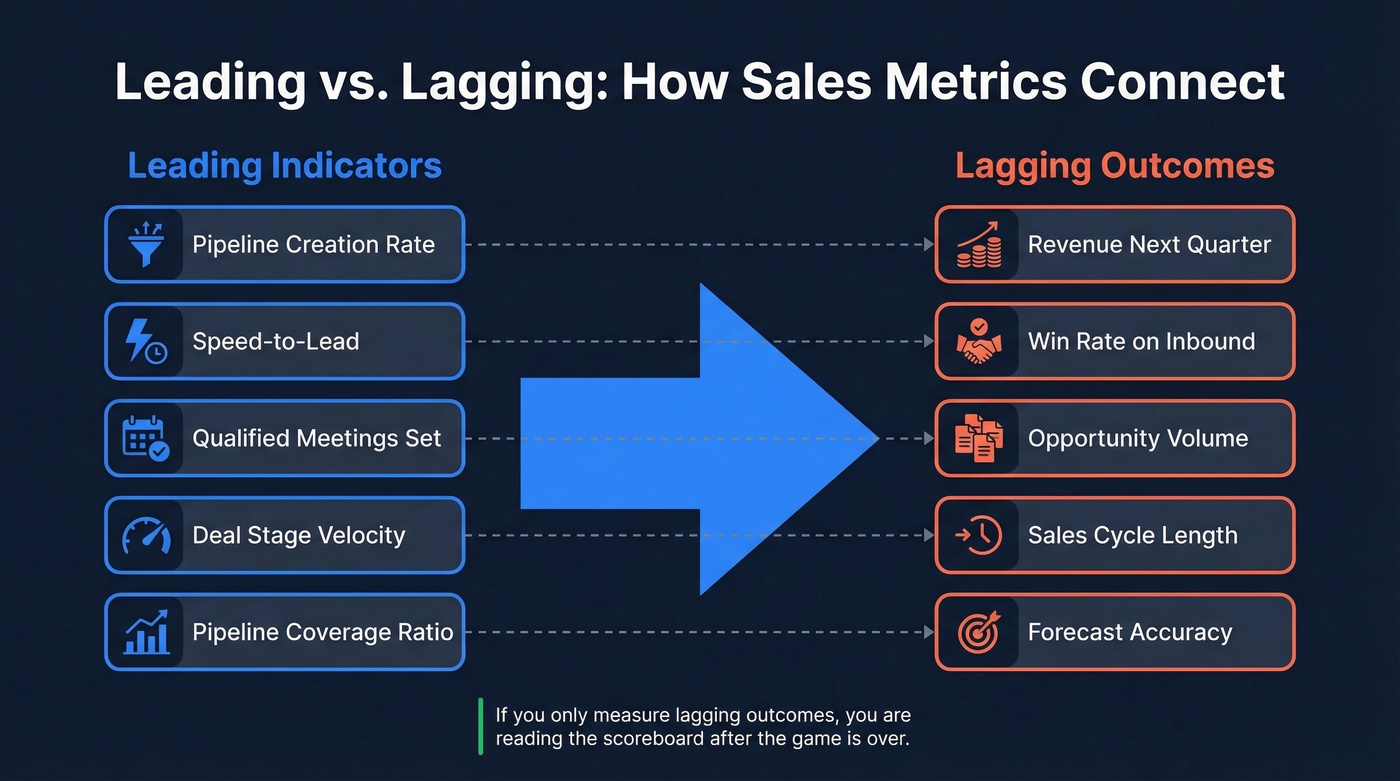
Most teams only track lagging - revenue closed, quota attainment, average deal size - then wonder why they can't course-correct until the quarter's already lost. Activities drive pipeline, pipeline drives revenue. If you only measure revenue, you're reading the scoreboard after the game is over. Effective sales measurement starts with the inputs, not the outputs.
| Leading Indicator | Lagging Outcome It Predicts |
|---|---|
| Pipeline creation rate | Revenue next quarter |
| Speed-to-lead | Win rate on inbound |
| Qualified meetings set | Opportunity volume |
| Deal stage velocity | Sales cycle length |
| Pipeline coverage ratio | Forecast accuracy |
8 Metrics That Predict Revenue
Highspot lists 30 metrics. NetSuite lists 20. That's the problem, not the solution. We've found that eight, tracked consistently, give you everything you need to diagnose and forecast.
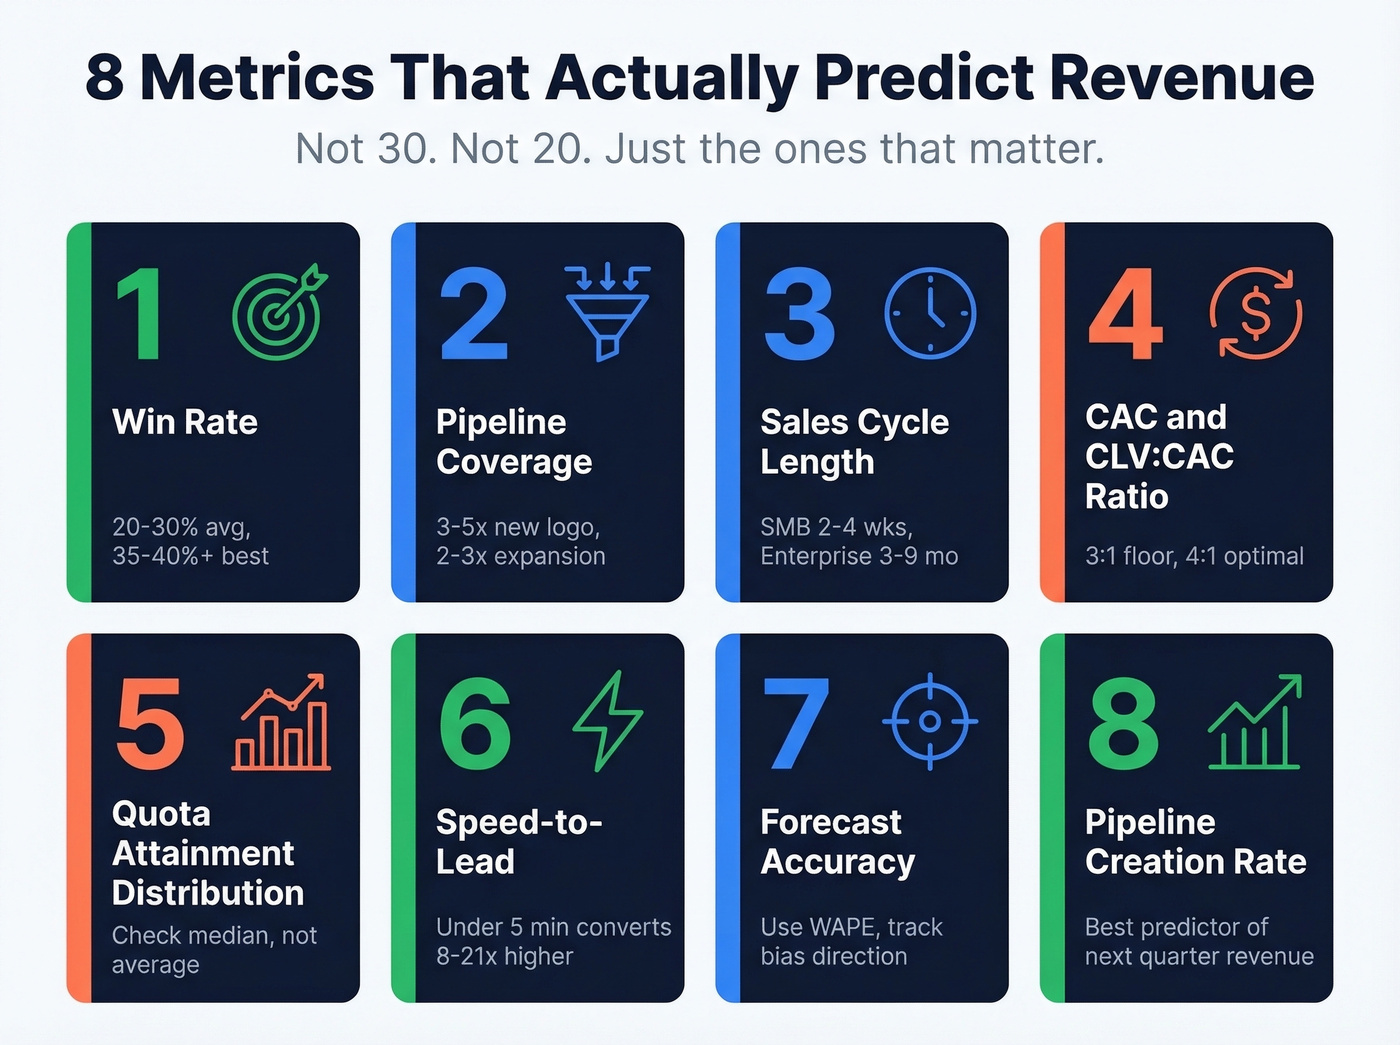
1. Win Rate
Average B2B win rate sits at 20-30%. Best-in-class teams hit 35-40%+. If yours is below 20%, segment it - enterprise deals naturally close at lower rates than SMB, and a blended number hides the real story.
2. Pipeline Coverage
Most teams track pipeline as a single number. That's wrong. You need segmentation: 3-5x quarterly coverage for new-logo pipeline, and 2-3x for expansion. Coverage alone won't save your forecast, but it's the first number to check when forecasts wobble.
3. Sales Cycle Length
SMB deals should close in 2-4 weeks. Mid-market runs 1-3 months. Enterprise stretches to 3-9+ months. If your cycle is lengthening quarter over quarter, something's broken in qualification or multi-threading. The average deal now involves 13 decision-makers, which is why multi-threading matters more than ever.
4. CAC and CLV:CAC Ratio
Here's the anti-pattern nobody talks about. 3:1 is the floor, 4:1 is optimal. Below 3:1, you're spending more to acquire customers than they're worth. Track CAC by channel and segment - blended CAC is another vanity number that makes everyone feel good while hiding real problems. (If you want to go deeper on CAC definitions and levers, see CAC.)
5. Quota Attainment Distribution
Don't look at the team average. Look at the median and the top quartile. If your median attainment is 60% but your average is 95%, you've got a concentration risk problem, not a healthy team. Two closers carrying the org isn't a strategy.
6. Speed-to-Lead
Under 5 minutes converts 8-21x higher than slower responses. 35-50% of deals go to the first responder. If your team takes more than an hour, you're handing revenue to competitors who pick up the phone faster.
7. Forecast Accuracy
Use WAPE: Σ |Forecast − Actual| ÷ Σ Actual. Then Forecast Accuracy = 1 − WAPE. Varicent's framework also tracks forecast bias - are you consistently over- or under-calling? That's where the real coaching insight lives. (If you're evaluating tooling, compare options in sales forecasting solutions.)
8. Pipeline Creation Rate
This is what Sorenson Capital calls the pipeline "income statement" - not how much pipeline you have, but how much you created this period. It's the single best predictor of next quarter's revenue, and most teams don't track it separately from total pipeline. Start. (Related: pipeline health.)
2026 Benchmarks at a Glance
| Metric | Average | Best-in-Class |
|---|---|---|
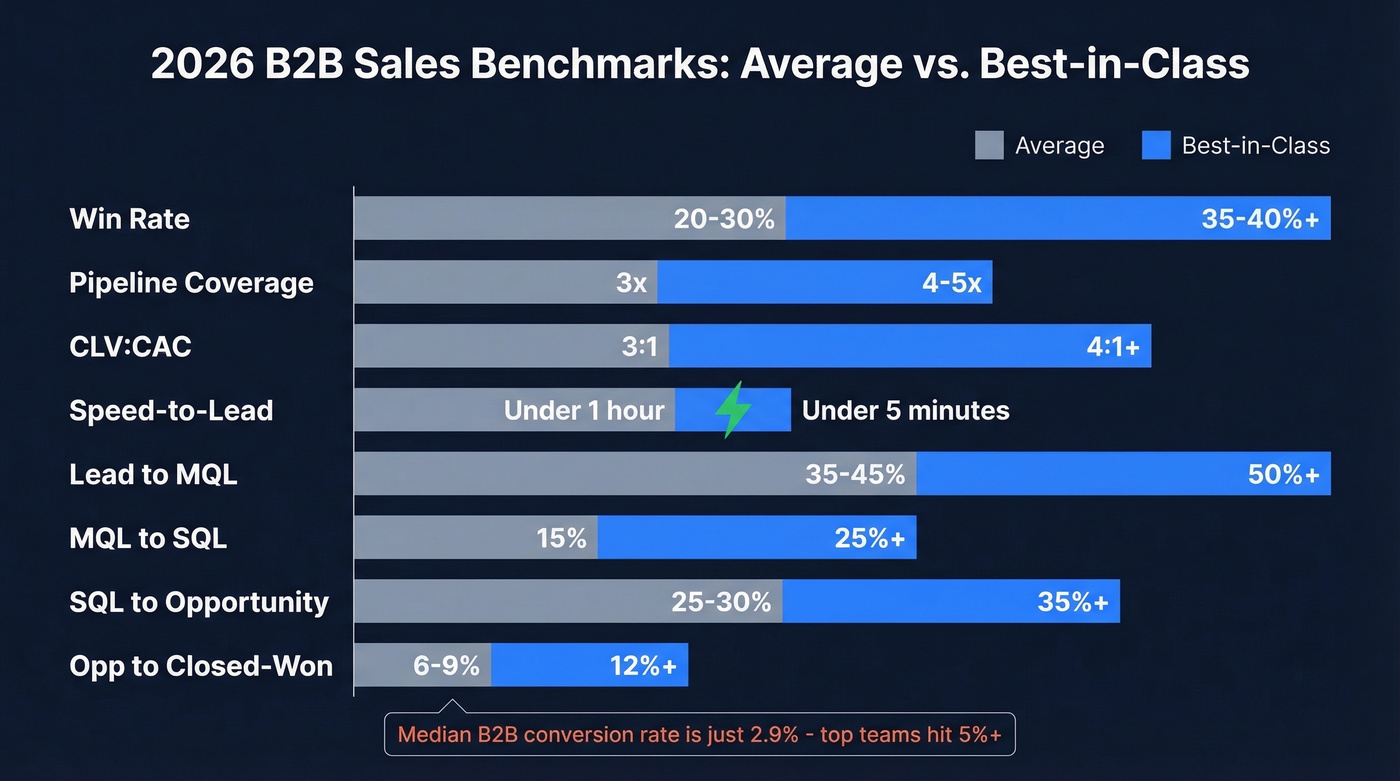
| Win rate | 20-30% | 35-40%+ |
| Pipeline coverage | 3x | 4-5x |
| CLV:CAC | 3:1 | 4:1+ |
| Speed-to-lead | <1 hour | <5 minutes |
| Lead→MQL | 35-45% | 50%+ |
| MQL→SQL | ~15% | 25%+ |
| SQL→Opportunity | 25-30% | 35%+ |
| Opp→Closed-won | 6-9% | 12%+ |
| Median B2B conversion | 2.9% | 5%+ |
Half of measuring sales performance is trusting the data behind it. When 35% of your contacts bounce, every metric from conversion rate to CAC is distorted. Prospeo's 98% email accuracy and 7-day data refresh eliminate the bad-data noise that corrupts your numbers.
Stop measuring phantom pipeline. Start reaching real buyers.
Mistakes That Corrupt Your Numbers
A LinkedIn poll on dangerous metrics found 47% of sales leaders flagged CRM activity counts as the most dangerous metric to obsess over. Another 37% said pipeline size. Both are right - activity counts are trivially gameable, and pipeline size without velocity data is just a comfort blanket.
Here are the anti-patterns we see most often.
Tracking too many metrics. InsightSquared recommends five core metrics for closers: open opportunities, closed opportunities, deal size, win rate, sales cycle. More than that creates noise and "flavor of the week" KPI churn that demoralizes reps and confuses managers. (If you're standardizing what reps log, use these sales activities as a baseline.)
Comparing unlike reps. A rep covering enterprise accounts in a new territory isn't comparable to one farming renewals in a mature segment. Segment your benchmarks or you'll punish your best people.
Letting bad data inflate activity metrics. Picture an SDR team logging 500 calls a day, but 35% of their contact data is bounced or disconnected. That's 330 real attempts, not 500. Every downstream metric - conversion rate, CAC, cost per meeting - is now distorted. Meritt experienced exactly this: their bounce rate sat at 35%, and once they cleaned it up with verified contact data, pipeline tripled from $100K to $300K per week. Not because they changed their messaging, but because they started reaching real people.
Let's be honest: if your email bounce rate is above 5%, your numbers are lying to you. We've seen this pattern across dozens of teams - garbage data in, garbage metrics out. (Benchmarks + fixes: email bounce rate.)
Ignoring quota equity. 69% of sellers say their target is inequitable, and 60% say quotas don't reflect territory potential. If your measurement system doesn't account for territory fit, attainment data is meaningless.
Build Your Review Cadence
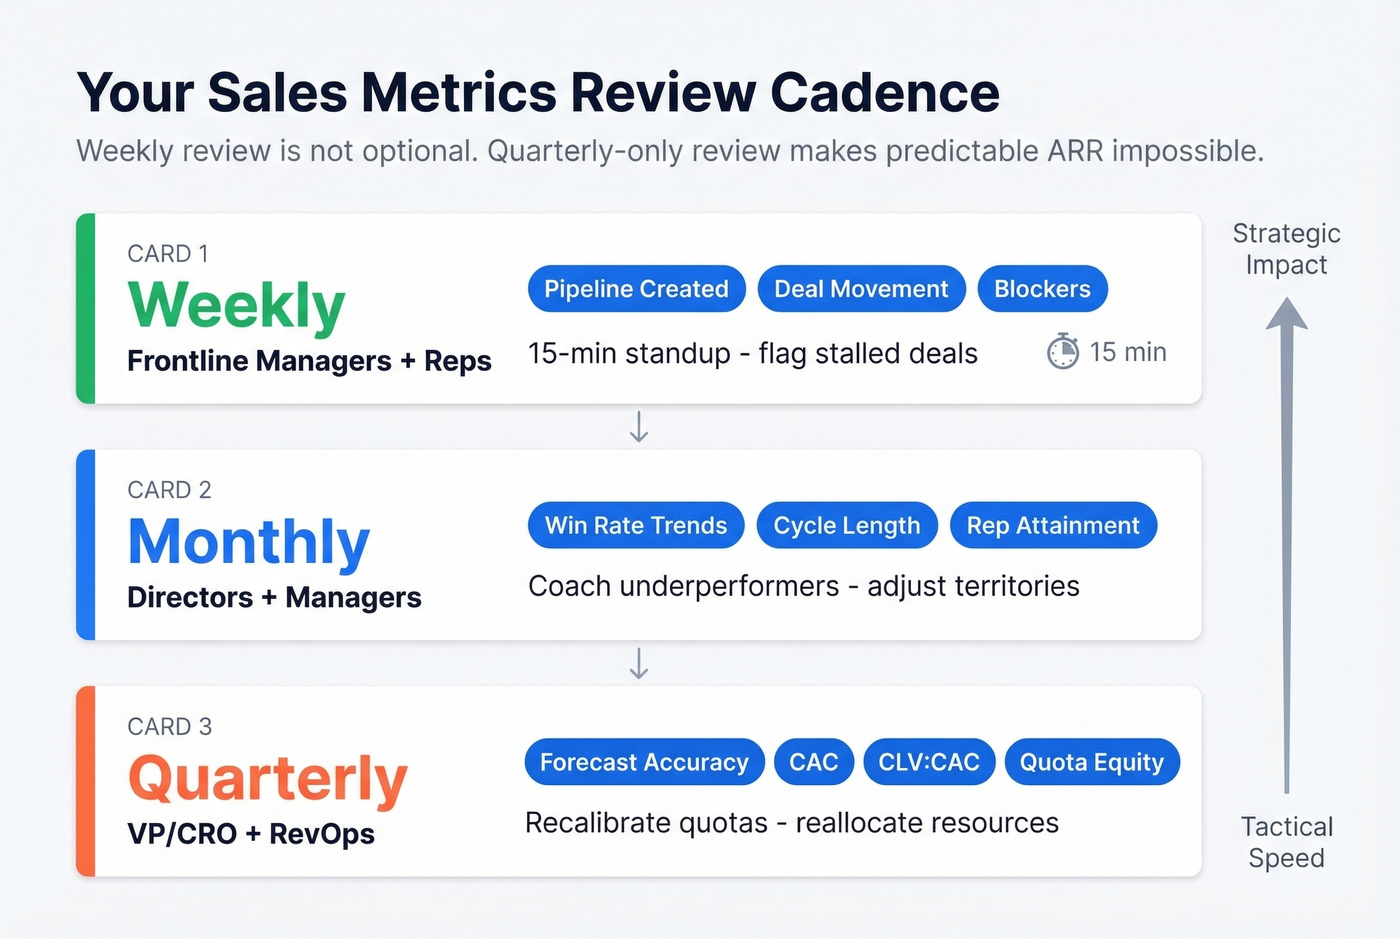
Weekly review isn't optional. As Sorenson Capital argues, quarterly-only review makes predictable ARR impossible. Think of pipeline two ways: the "balance sheet" (total value by stage) and the "income statement" (new pipeline created this period). You need both, every week.
Here's a strong opinion: if your average deal is under $20k, you probably don't need a $50k BI tool. A spreadsheet with weekly trend data going back six months beats a dashboard nobody updates. Automate later, once you know which numbers actually drive decisions.
| Cadence | Who Reviews | Metrics | Action |
|---|---|---|---|
| Weekly | Frontline managers + reps | Pipeline created, deal movement, blockers | 15-min standup; flag stalled deals |
| Monthly | Directors + managers | Win rate trends, cycle length, rep attainment | Coach underperformers; adjust territories |
| Quarterly | VP/CRO + RevOps | Forecast accuracy, CAC, CLV:CAC, quota equity | Recalibrate quotas; reallocate resources |
89% of revenue orgs now use AI in their revenue workflows. If you're still running forecast calls off gut feel and spreadsheet formulas, you're already behind. (For a systems view, see sales performance management.)
Match Metrics to Your Sales Motion
Not every metric matters for every motion. A PLG company tracking pipeline coverage is measuring the wrong thing. An enterprise sales org ignoring multi-threading depth is flying blind. Skip this section if you run a single, straightforward sales-led motion - but for anyone juggling product-led and sales-led simultaneously, this is where most measurement frameworks fall apart.
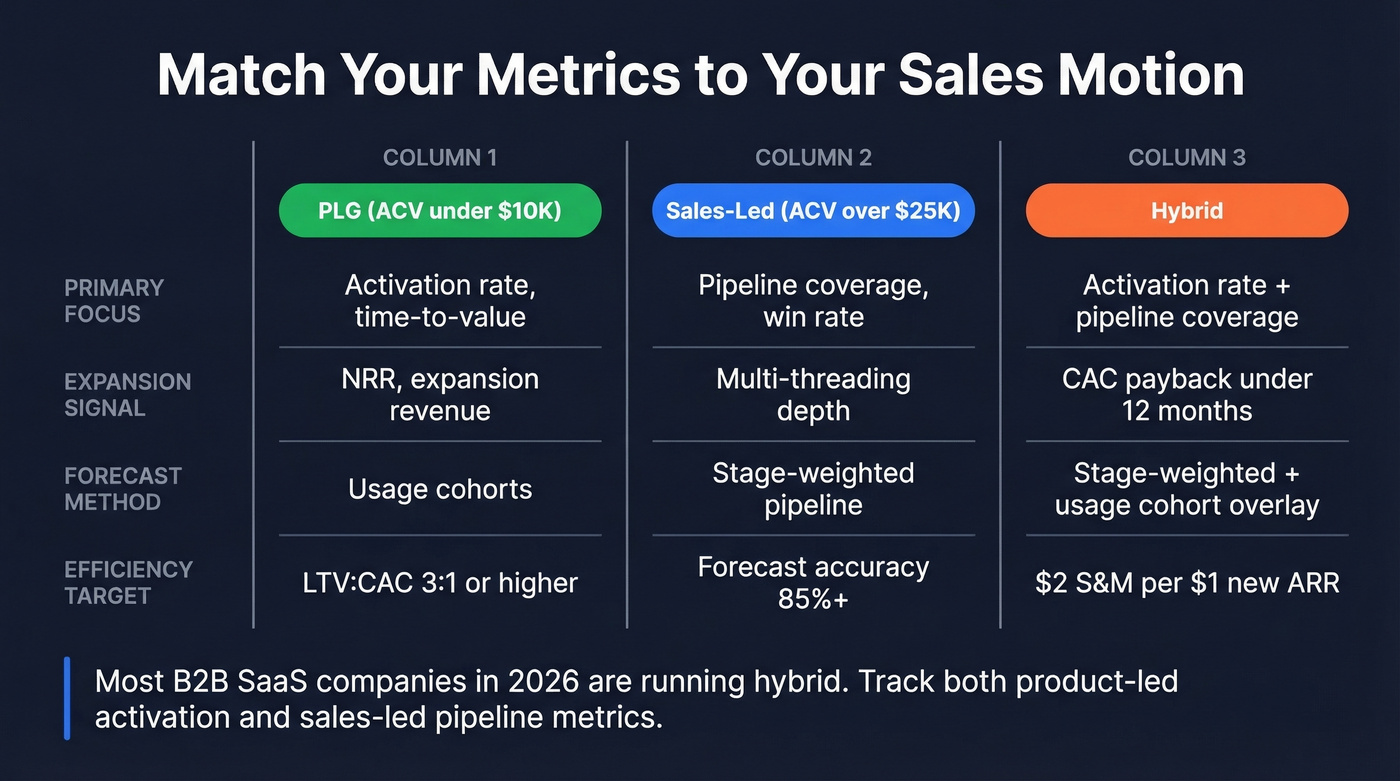
| Metric | PLG (ACV <$10K) | Sales-Led (ACV >$25K) | Hybrid |
|---|---|---|---|
| Primary focus | Activation rate, time-to-value | Pipeline coverage, win rate | Activation rate + pipeline coverage |
| Expansion signal | NRR, expansion revenue | Multi-threading depth | CAC payback <12 mo |
| Forecast method | Usage cohorts | Stage-weighted pipeline | Stage-weighted + usage cohort overlay |
| Efficiency target | LTV:CAC ≥ 3:1 | Forecast accuracy ≥ 85% | $2 S&M per $1 new ARR |
Most B2B SaaS companies in 2026 are running a hybrid motion. If that's you, track both product-led activation metrics and sales-led pipeline metrics. The companies that blend well are the ones winning right now.
One metric most teams overlook: revenue per rep hour. It cuts through the noise of activity counts and tells you whether your team is actually efficient, or just busy. Choosing evaluation metrics at the motion level, rather than applying a one-size-fits-all scorecard, is what separates high-performing RevOps teams from everyone else. (More on measurement frameworks: sales operations metrics.)
Start With Clean Data
Every metric on this page is only as reliable as the data underneath it. Win rates calculated on dirty pipeline are fiction. Activity metrics built on bounced emails are theater. Before you optimize how you measure sales performance, fix the foundation. In our experience, teams that invest a single week in data hygiene see their metric accuracy improve more than teams that spend a quarter building new dashboards. (If you're auditing your stack, start with data enrichment services.)
Tools like Prospeo help here - 98% email accuracy on a 7-day refresh cycle means the numbers feeding your CRM are actually trustworthy, which is the bare minimum for any measurement framework to work.
Meritt's bounce rate dropped from 35% to under 4% with Prospeo - and pipeline tripled from $100K to $300K per week. When your activity metrics reflect real conversations instead of dead emails, every KPI in your stack gets more honest.
Clean data in, accurate metrics out. It starts at $0.01 per email.
FAQ
What's the difference between a sales metric and a KPI?
A metric is any measurement - emails sent, calls made, deals in pipeline. A KPI is a metric tied to a specific target, like "win rate ≥ 30%." Every KPI is a metric, but not every metric deserves KPI status. Outreach breaks this down well.
How many sales metrics should I track?
Five to eight per role. Closers need win rate, deal size, cycle length, pipeline coverage, and quota attainment. SDRs need meetings booked, speed-to-lead, and qualified opportunity conversion.
How often should I review sales performance?
Weekly for pipeline creation and deal movement. Monthly for win rate trends and rep attainment. Quarterly for forecast accuracy, CAC, and territory equity. Never go more than a week without checking pipeline health.
What's a good win rate for B2B sales?
Average B2B win rate is 20-30%. Best-in-class teams hit 35-40%+. Segment by deal size - enterprise naturally closes at lower rates than SMB, and blending them masks the real problem.
How does bad contact data affect sales metrics?
If your email bounce rate exceeds 5%, activity counts, response rates, and CAC are all inflated. Meritt dropped their bounce rate from 35% to under 4% and tripled pipeline - not from better messaging, but from reaching real people with verified data.