Lead Conversion Rate Benchmarks: Every Funnel Stage, One Page
Every benchmark article defines "conversion" differently. One says 2.9%, another says 31%, another says 62% - and they're all correct because they're measuring different funnel stages. Your VP of Sales just asked why only 12% of MQLs are turning into SQLs, and you can't tell if that's a crisis or just Tuesday.
Here are the lead conversion rate benchmarks for every stage on one page so you can stop cross-referencing five tabs.
The Headline Numbers
- Visitor to qualified lead: 2.9% across 100M+ datapoints from Ruler Analytics
- Lead to MQL: 31% across 30 industries per First Page Sage
- Qualified-to-booked: 62% median from 1M+ B2B SaaS form submissions
- MQL to Close in SaaS: 1-7% by company stage
What Is Lead Conversion Rate?
Lead conversion rate measures the percentage of leads advancing to the next funnel stage: (conversions / total leads) x 100. If 50 of your 200 MQLs become SQLs, your MQL-to-SQL conversion rate is 25%.
The critical nuance is that "conversion" means something different at every stage - a 2.9% visitor-to-lead rate and a 62% lead-to-meeting rate are both "conversion rates." The metric that matters most to leadership is lead conversion to revenue, which traces the full path from first touch to closed deal.
Benchmarks at a Glance
| Funnel Stage | Average Benchmark |
|---|---|
| Visitor to Lead | 1-3% |
| Lead to MQL | 31% |
| MQL to SQL | 15-35% |
| SQL to Opportunity | 30-55% |
| Opp to Close (SaaS) | 15-40% |
| Qualified to Meeting | 62% (median) |
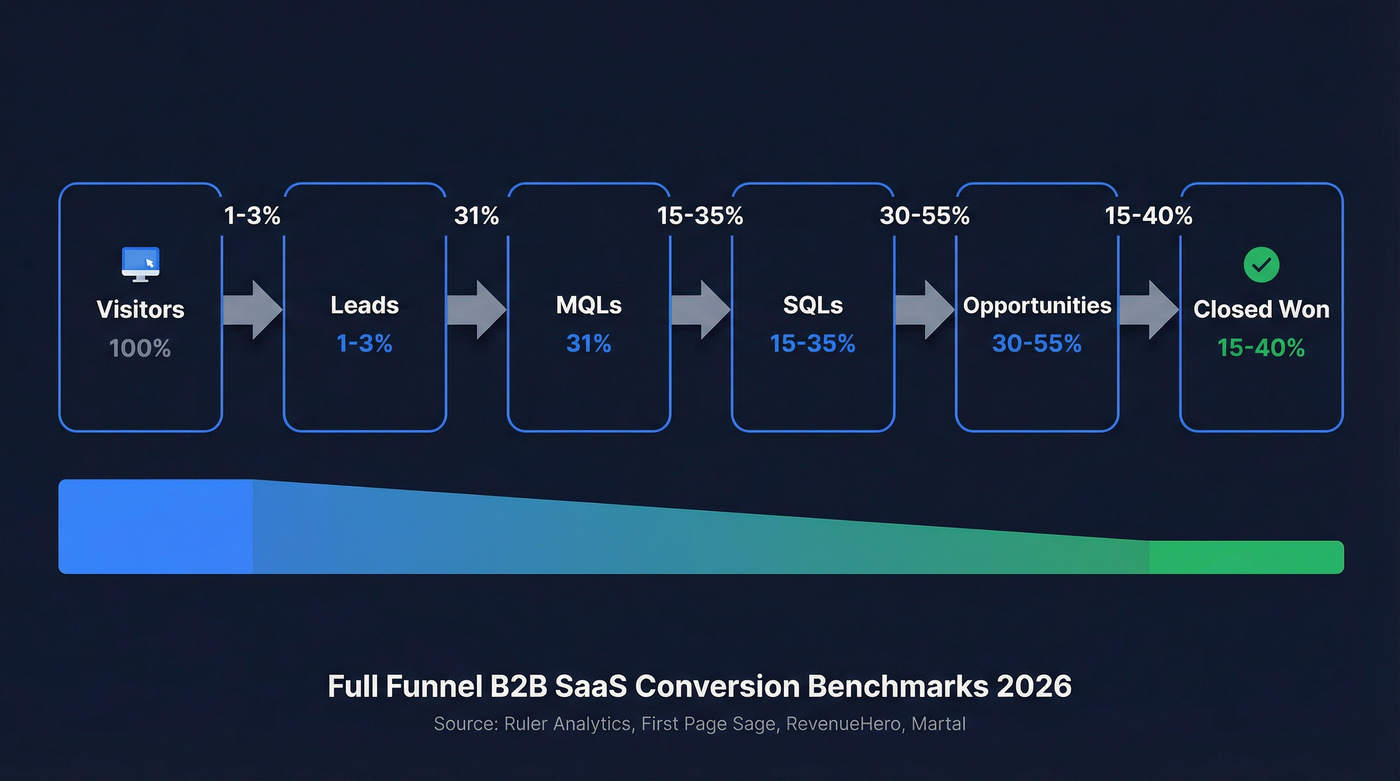
Your numbers will shift based on industry, channel, and company maturity. Let's break it down.
Visitor-to-Lead by Industry
First Page Sage's 2026 report covering data from Jan 2022 through Aug 2025 shows the spread:
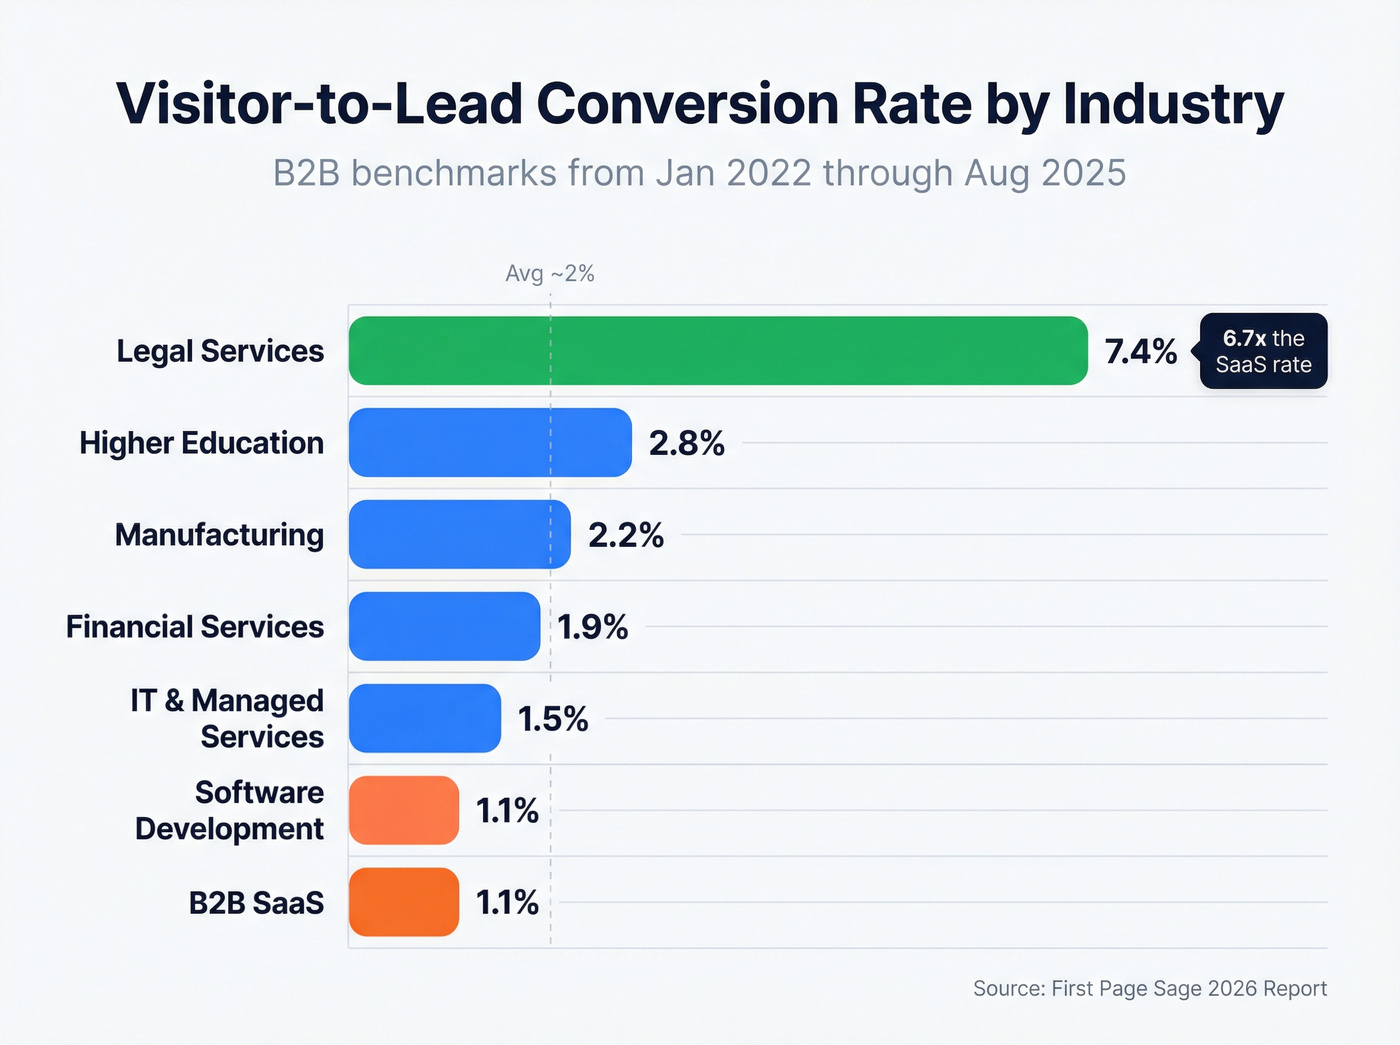
| Industry | Visitor to Lead |
|---|---|
| B2B SaaS | 1.1% |
| Software Development | 1.1% |
| IT & Managed Services | 1.5% |
| Financial Services | 1.9% |
| Manufacturing | 2.2% |
| Higher Education | 2.8% |
| Legal Services | 7.4% |
Legal services sits at 7.4% - about 6.7x the SaaS rate - largely because of high-intent search traffic. If you're in SaaS and hitting 1.5%, you're doing fine. We've seen teams panic over a 1.2% visitor-to-lead rate when their industry average is 1.1%. That's not a conversion problem. That's a benchmarking problem.
Your visitor-to-lead rate is only half the equation. If bad data means 35% of outreach bounces, you're bleeding conversions at every funnel stage. Prospeo delivers 98% email accuracy with a 7-day refresh cycle - so every lead that enters your funnel has a real path to close.
Stop losing deals to outdated contact data. Start at $0.01 per verified email.
Lead-to-MQL by Industry and Channel
The overall average across all industries and channels is 31%, but that hides massive variation.
By Industry:
| Industry | Lead to MQL |
|---|---|
| Environmental Services | 45% |
| B2B SaaS | 39% |
| Cybersecurity | 39% |
| Legal Services | 32% |
| Financial Services | 29% |
| Manufacturing | 26% |
| IT & Managed Services | 25% |
| Construction | 17% |
By Channel:
| Channel | Lead to MQL |
|---|---|
| Client Referrals | 56% |
| Executive Events | 54% |
| SEO | 41% |
| Email Marketing | 38% |
| Social Media | 30% |
| PPC | 29% |
| Outdoor Advertising | 14% |
Referrals and SEO dominate because they capture higher-intent leads. If your marketing mix is PPC-heavy and your lead-to-MQL rate trails 31%, that's not a crisis - it's math.
Full-Funnel SaaS Benchmarks
This is where most benchmark articles stop at one or two stages. Here's the complete picture.
By Channel
Full-funnel SaaS data across 50+ B2B SaaS clients:
Top of Funnel:
| Channel | V to Lead | L to MQL |
|---|---|---|
| SEO | 2.1% | 41% |
| 2.2% | 38% | |
| 1.3% | 43% | |
| Webinar | 0.9% | 44% |
| PPC | 0.7% | 36% |
Mid to Close:
| Channel | MQL to SQL | SQL to Opp | Opp to Close |
|---|---|---|---|
| SEO | 51% | 49% | 36% |
| 30% | 41% | 39% | |
| 46% | 48% | 32% | |
| Webinar | 39% | 42% | 40% |
| PPC | 26% | 38% | 35% |
Don't evaluate channels on top-of-funnel volume alone. Webinars convert just 0.9% of visitors but close 40% of opportunities - the highest close rate on this list.
By SaaS Subindustry
Different SaaS verticals show dramatically different full-funnel performance:
| SaaS Vertical | MQL to SQL | SQL to Opp | Opp to Close | MQL to Close |
|---|---|---|---|---|
| Cybersecurity | 38% | 40% | 39% | 5.9% |
| Fintech | 42% | 48% | 39% | 7.9% |
| Legaltech | 40% | 47% | 42% | 7.9% |
| Industrial & IoT | 39% | 42% | 39% | 6.4% |
Fintech and Legaltech carry better late-funnel performance, while Cybersecurity converts MQLs to SQLs strongly but loses more deals at close. If you're benchmarking your Fintech SaaS against generic "SaaS averages," you're comparing against the wrong number.
Trial and Freemium Conversion
For product-led growth companies, these are the benchmarks that actually matter:
- CRM trial to paid: 29%
- Freemium to paid: 3.4%
- Free trial to paid: ~18-29% depending on category
A 3.4% freemium conversion rate sounds terrible until you realize that's the industry standard. Above 5%? You're outperforming most PLG companies.
By Company Stage
Martal's analysis of 500+ SaaS clients shows how the lead to sales conversion rate shifts with maturity:
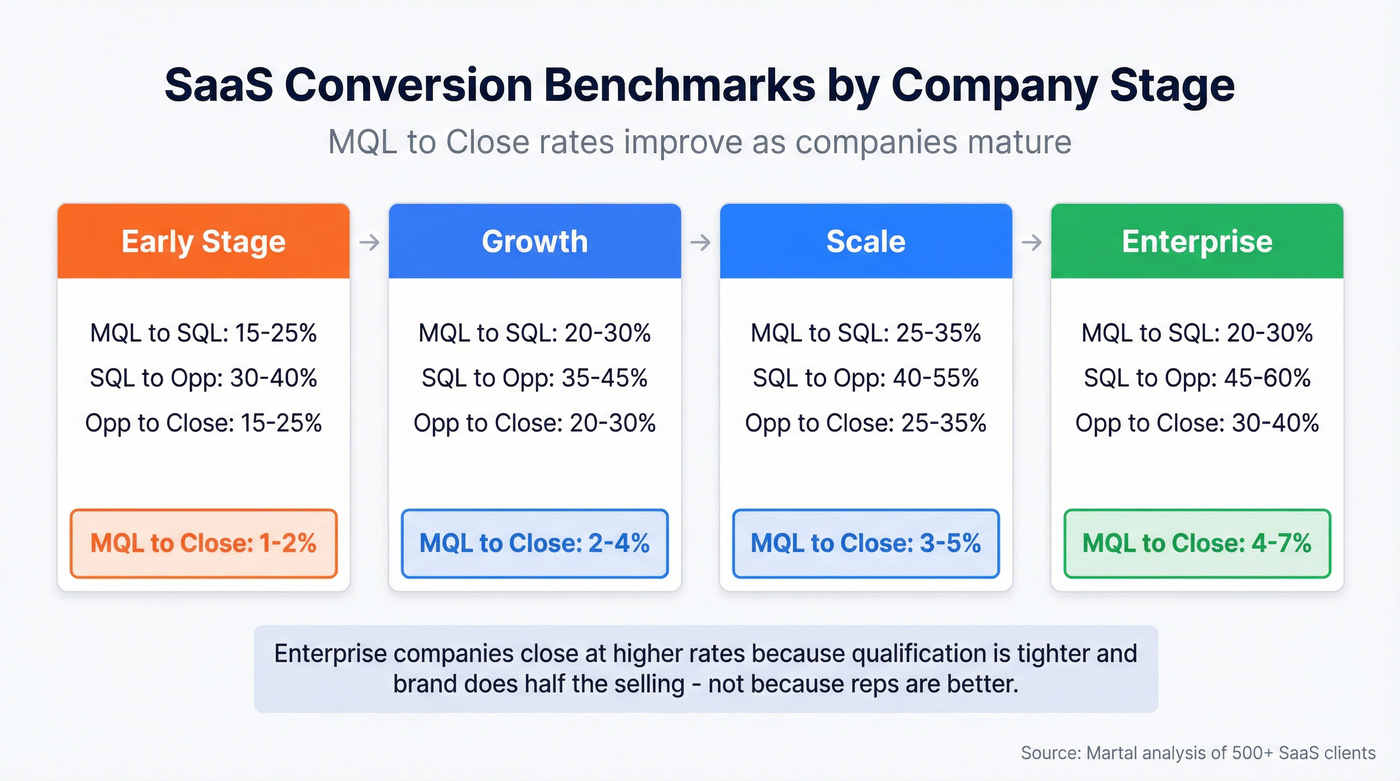
| Stage | MQL to SQL | SQL to Opp | Opp to Close | MQL to Close |
|---|---|---|---|---|
| Early | 15-25% | 30-40% | 15-25% | 1-2% |
| Growth | 20-30% | 35-45% | 20-30% | 2-4% |
| Scale | 25-35% | 40-55% | 25-35% | 3-5% |
| Enterprise | 20-30% | 45-60% | 30-40% | 4-7% |
Enterprise companies close at higher rates not because their reps are better, but because their qualification is tighter and their brand does half the selling. Early-stage companies converting MQL to Close at 1-2% aren't failing. They're normal.
Here's the thing: buyers now do roughly 70% of their research independently before engaging sales. That means your top-of-funnel conversion rate matters less than it did five years ago - what matters is whether you're converting the smaller pool of high-intent leads that actually raise their hand. Obsessing over visitor-to-lead rates is fighting the last war.
CAC context by ACV band: SMB ($5K-$25K ACV) typically spends $1K-$4K per customer acquisition. Mid-market ($25K-$100K ACV) runs $4K-$15K. Enterprise ($100K-$500K ACV) can hit $15K-$50K, and Enterprise+ ($500K+ ACV) often lands in the $50K-$150K range. If your conversion rates are at benchmark but your CAC is 3x these ranges, the problem isn't conversion - it's spend efficiency.
Lead-to-Meeting Benchmarks
RevenueHero's dataset puts the median qualified-to-booked rate at 62%. Top 10% hit 78%+, and the best reach 88%.
If you're below 60% on inbound qualified-to-booked, your routing or scheduling friction is the bottleneck, not lead quality. Outbound initial-contact-to-meeting runs 2-5% - a completely different game.
What Actually Moves Conversion Rates
Benchmarks are context, not targets. Three levers actually move the needle.
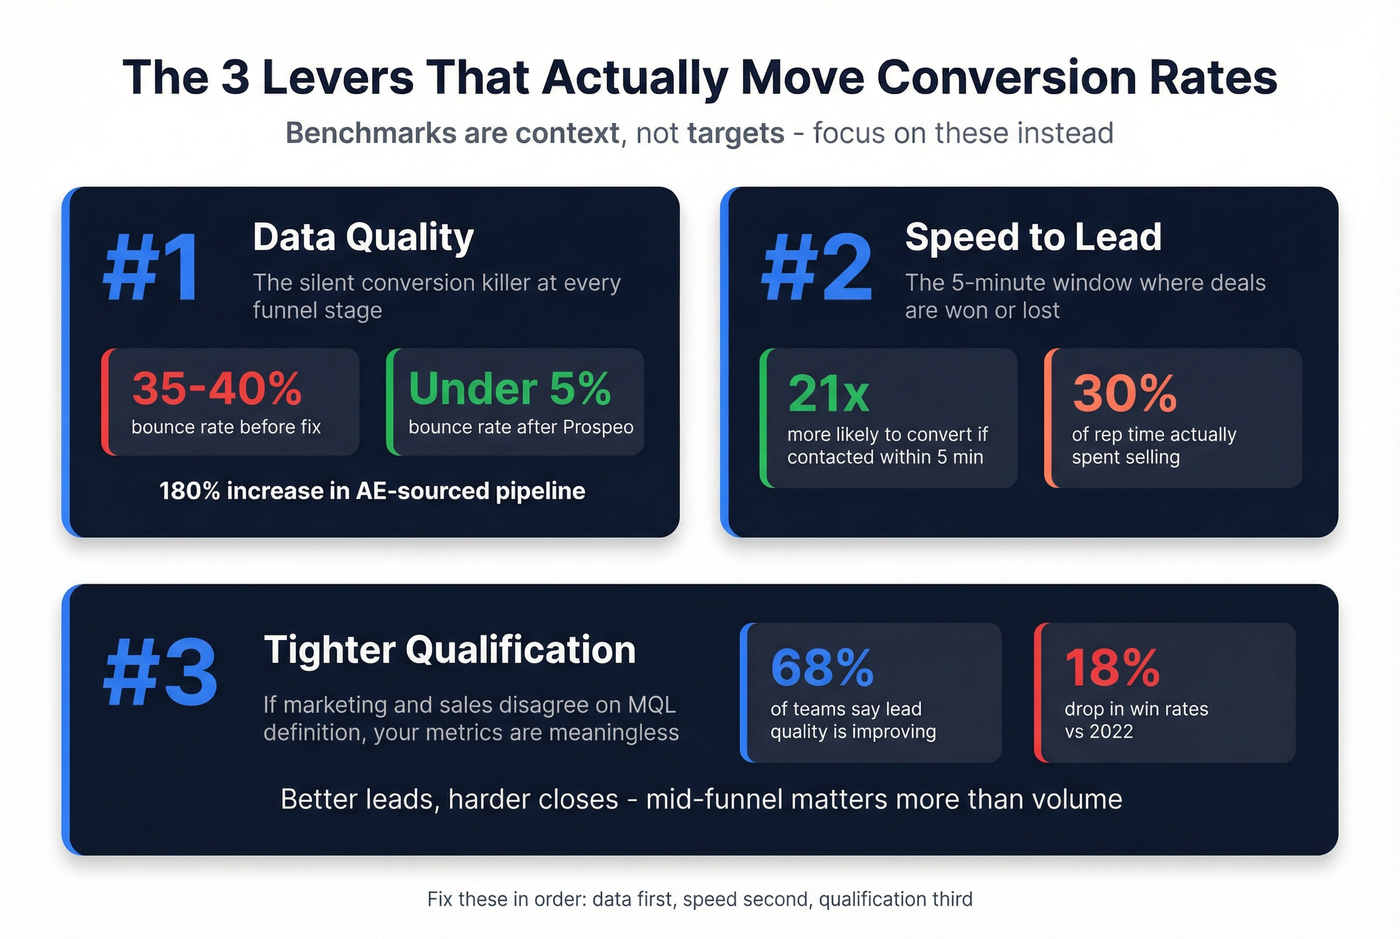
1. Data quality. This is the silent conversion killer, and in our experience, it's the #1 reason teams underperform - not process, not messaging, not cadence. If your bounce rate sits in the 35-40% range, your MQL-to-SQL rate will always trail benchmarks because reps waste cycles on dead contacts. Snyk's 50-person sales team ran bounce rates of 35-40% before switching to Prospeo's email finder. After the switch, bounces dropped under 5% and AE-sourced pipeline jumped 180%.

2. Speed-to-lead. Leads contacted within 5 minutes are 21x more likely to convert than those contacted after 30 minutes. Yet reps spend only 30% of their time actually selling. The gap between those two numbers is where deals die.
3. Tighter qualification. If marketing and sales don't agree on what an MQL is, your MQL-to-SQL rate is meaningless. 68% of teams report lead quality improving year-over-year, but win rates are down 18% vs 2022. Better leads, harder closes - your mid-funnel and late-funnel performance matters more than top-of-funnel volume. Skip the cadence optimization until you've fixed your data and your definitions.
MQL-to-SQL benchmarks assume your reps are reaching real buyers. With 125M+ verified mobiles (30% pickup rate) and 143M+ verified emails, Prospeo ensures your pipeline doesn't stall because of wrong numbers and dead inboxes. Teams using Prospeo book 26% more meetings than ZoomInfo users.
Convert more of the pipeline you already have. 75 free emails to prove it.
FAQ
What is a good lead to sales conversion rate?
For MQL to Close, anything above 3% is solid for mid-market SaaS; enterprise teams with tight qualification hit 4-7%. Visitor-to-lead benchmarks range 1-3% in B2B, while lead-to-MQL averages 31% across industries. Always compare against your specific vertical and channel - generic "good" numbers mislead more than they help.
How do you calculate lead conversion rate?
Divide converted leads by total leads, then multiply by 100. Example: 50 SQLs from 200 MQLs = 25% MQL-to-SQL conversion rate. Define which funnel stage you're measuring first - "conversion rate" without that context is meaningless.
Why are my conversion rates below benchmark?
The most common culprit is bad contact data. Bounced emails and wrong numbers silently kill conversion at every stage. After fixing data quality, audit your speed-to-lead (under 5 minutes is the target) and tighten MQL definitions between marketing and sales.
How do B2B conversion rates differ by industry?
Legal services converts visitors to leads at 7.4% - roughly 6.7x the B2B SaaS rate of 1.1%. Environmental services leads in lead-to-MQL at 45%, while construction trails at 17%. Industry benchmarks vary so widely that comparing across verticals is misleading; always use your own sector's numbers.