What Is the Obtainable Market and How Do You Calculate It?
You're building your seed deck, you've nailed the TAM slide, the SAM looks defensible - and then you stare at the SOM line. What number do you actually put there?
CB Insights analyzed 431 VC-backed companies that shut down since 2023 and found 43% cited poor product-market fit, with $17.5B in equity funding destroyed across the cohort. Your obtainable market is where ambition meets math. Most founders get it wrong.
What Is the Obtainable Market?
The obtainable market - also called serviceable obtainable market (SOM) - is the portion of your total addressable market you can realistically capture within a defined time period. It's the bottom layer of the TAM, SAM, SOM hierarchy.
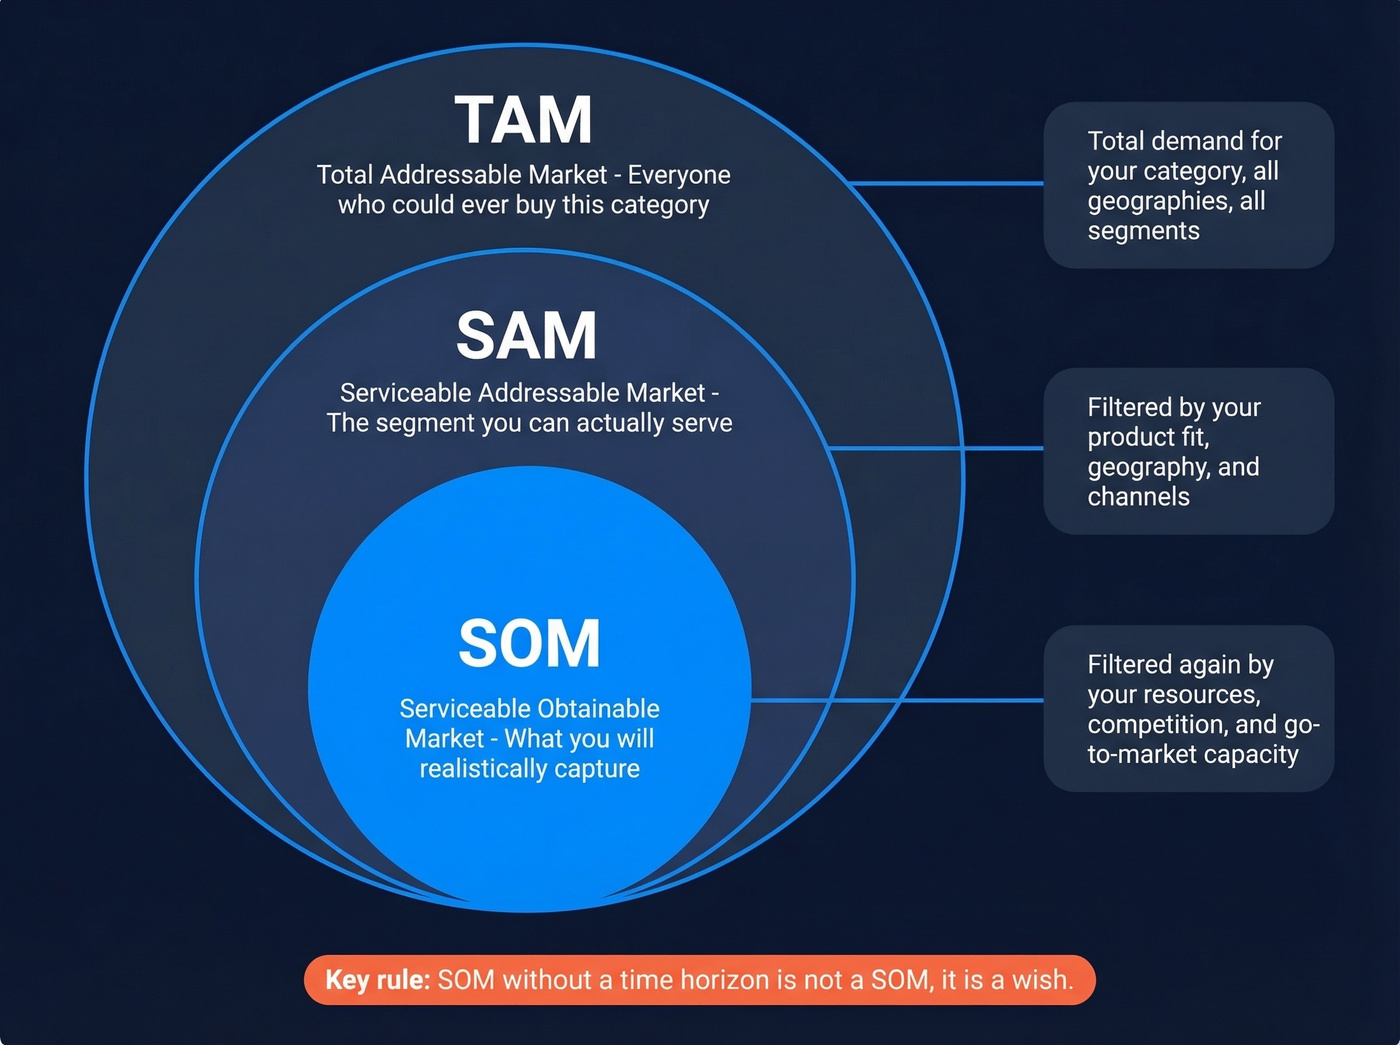
TAM is the total demand for your category. SAM narrows that to the segment you can actually serve given your product, geography, and channels. SOM narrows further to what you'll likely win given your resources, competition, and go-to-market capacity. Put simply, SOM represents the revenue ceiling you can realistically hit - not the entire category opportunity.
The critical distinction: SOM is always tied to a specific timeframe. A SOM without a time horizon - 12 months, 3 years, 5 years - isn't a SOM. It's a wish.
How to Calculate Your Obtainable Market
With Revenue History
The cleanest formula: last year's market share x this year's SAM.
If your SAM is $300M and you captured 1% last year, your baseline SOM is $3M. Adjust upward for new channels, product launches, or geographic expansion - but justify every adjustment with data, not optimism. This is the approach investors trust most because the inputs are grounded in actual performance, not projections.
Without Revenue History
Most SOM formulas lean on last year's revenue to compute market share. On r/venturecapital, a pre-revenue founder captured this frustration perfectly - they understood TAM and SAM but were "really struggling with the last one" because every formula demands historical data they don't have.
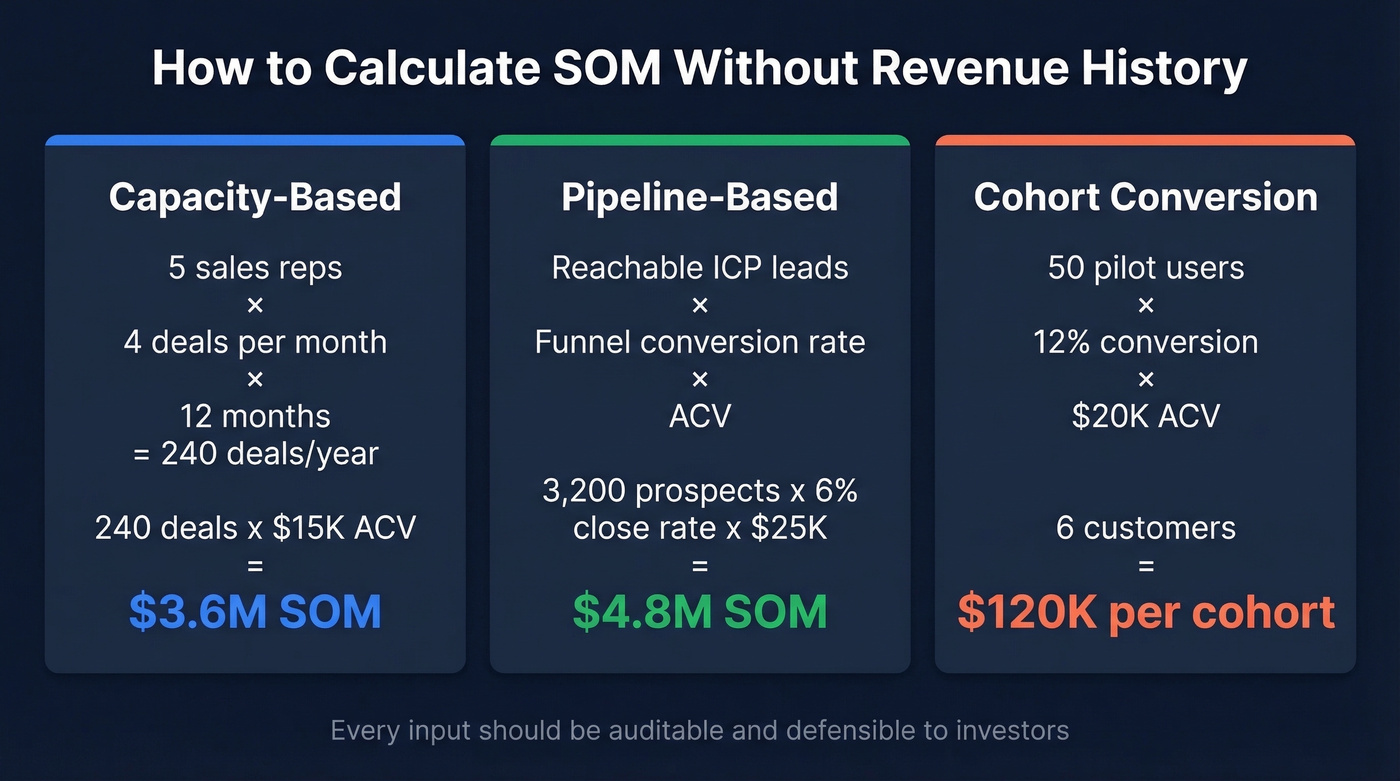
We've seen three methods that actually work for pre-revenue companies:
Capacity-based. Multiply your sales team's realistic closed-won capacity by ACV. Five reps closing 4 deals per month over 12 months gives you 240 deals per year. At $15K ACV, that's $3.6M in annual closed-won revenue capacity. Be honest about ramp time, seasonality, and whether "4 deals/month" is truly realistic or just what your top rep did once in Q4.
Pipeline-based. Start with reachable leads, apply your funnel conversion rate and multiply by ACV. This requires knowing how many ICP-matched prospects you can actually contact - not a theoretical count from an industry report, but a real number you can build from a B2B data platform like Prospeo with 30+ search filters rather than guessing from a Statista chart.
Cohort conversion. If you've run a pilot or beta, extrapolate. 50 pilot users converting at 12% with $20K ACV implies 6 customers and $120K in revenue for that cohort. Then scale by how many similar cohorts you can reach in your timeframe.
Worked Example: Pipeline-Based SOM
Say you sell HR software to mid-market companies. You search a B2B database and find 4,200 ICP-matched companies in your target geography. Your outbound team can realistically reach 800 per quarter - 3,200 per year. At a 6% close rate and $25K ACV, your year-one SOM is:
3,200 x 0.06 x $25K = $4.8M
Every input is auditable. That's what makes it defensible.
SOM Benchmarks by Business Type
These are guardrails, not targets. Your specific SOM depends on competition, distribution, and product maturity - and the inputs vary by business model. A SaaS company calculates SOM from seats times ACV; a retailer works from foot traffic times basket size. The math differs, but the discipline is the same.
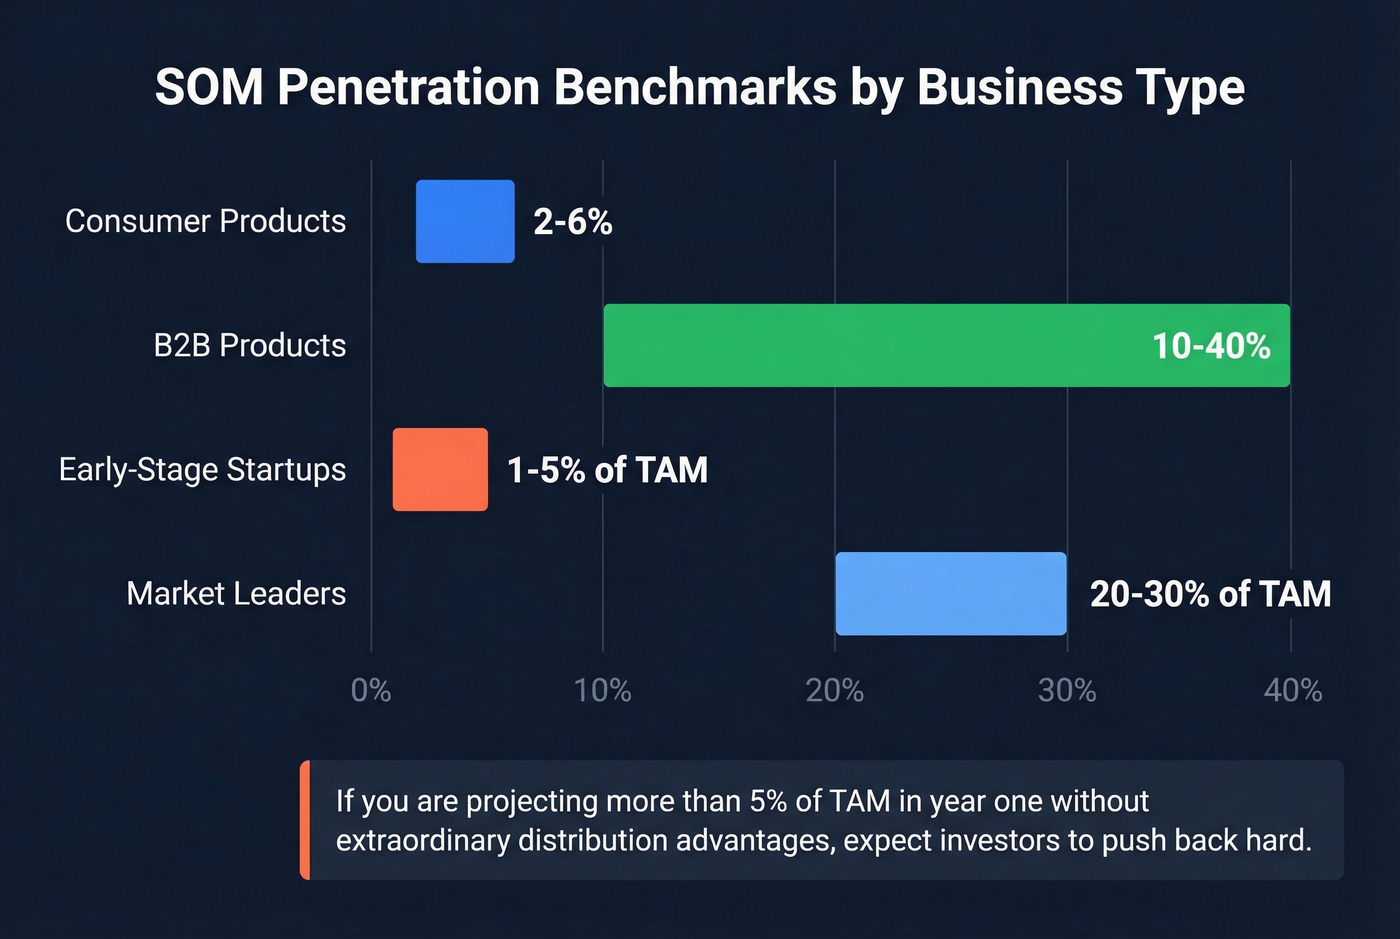
| Business Type | Typical Penetration Benchmark |
|---|---|
| Consumer products | 2-6% market penetration |
| B2B products | 10-40% market penetration |
| Early-stage startups | 1-5% of TAM |
| Market leaders | 20-30% of TAM |
If you're an early-stage startup projecting more than 5% of TAM in year one without extraordinary distribution advantages, expect investors to push back hard.
Your pipeline-based SOM depends on knowing exactly how many ICP-matched companies exist - not guessing from a Statista chart. Prospeo's 300M+ profiles with 30+ filters (intent, technographics, headcount growth, funding) let you build an auditable prospect list that makes your SOM defensible to any investor.
Turn your obtainable market from a slide into a contact list.
Mistakes That Kill SOM Credibility
Every guide tells you SOM = SAM x market share %. That's a tautology, not a methodology. It gives you a formula with no way to justify the inputs. Here are the mistakes that flow from that lazy framing.
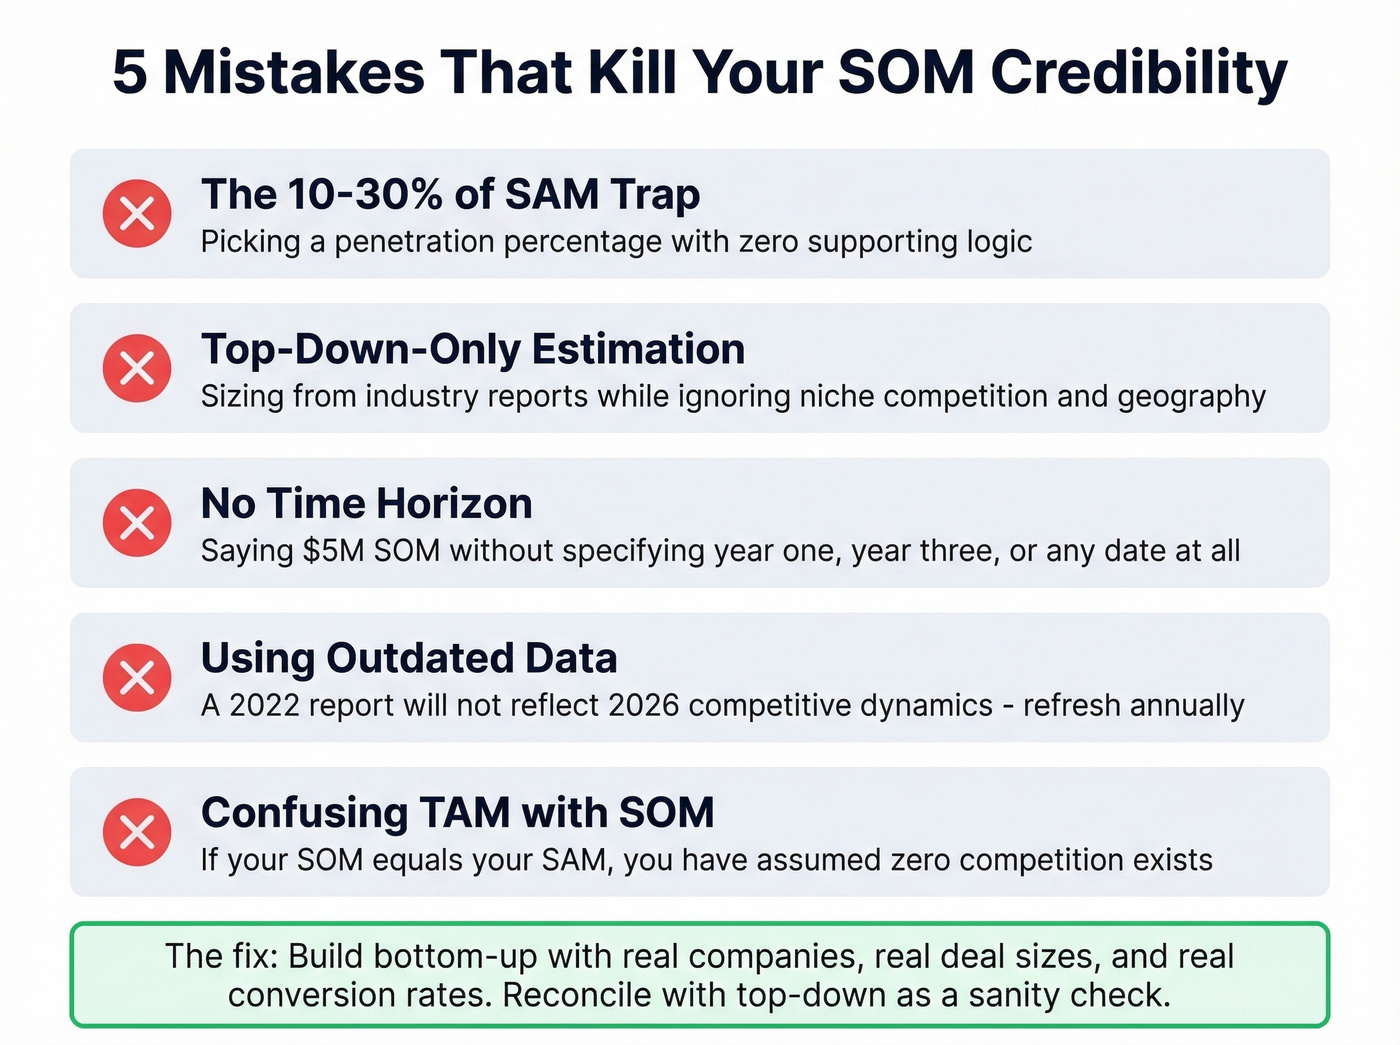
The "10-30% of SAM" trap. A Reddit thread in r/startups captured this perfectly - founders picking a penetration percentage with zero supporting logic. "We'll capture 15% of SAM" sounds precise but means nothing without a bottoms-up justification for why 15% and not 3%.
Top-down-only estimation. Founders size their market purely from industry reports, ignore niche competition and geographic restrictions, and project a TAM that bears no resemblance to their actual addressable buyers. Result: sky-high CAC and investors who stop returning calls.
No time horizon. "$5M SOM" tells an investor nothing. "$5M SOM in year one, growing to $18M by year three based on these expansion assumptions" tells a story. Always attach a date.
Using outdated data. Markets shift. A 2022 report won't reflect 2026 competitive dynamics. Refresh your inputs at least annually - stale revenue forecasts are one of the fastest ways to lose credibility with anyone who's done real diligence.
Confusing TAM with SOM. This sounds basic, but assuming 100% market capture - even implicitly - is more common than you'd think. If your SOM equals your SAM, you've assumed zero competition. No investor will take that seriously.
What Investors Expect From Your SOM
Here's the thing: your investor asks "How did you arrive at this SOM?" You say "5% of SAM." They say "Why 5%?" And you have nothing.
That's the moment the meeting dies.
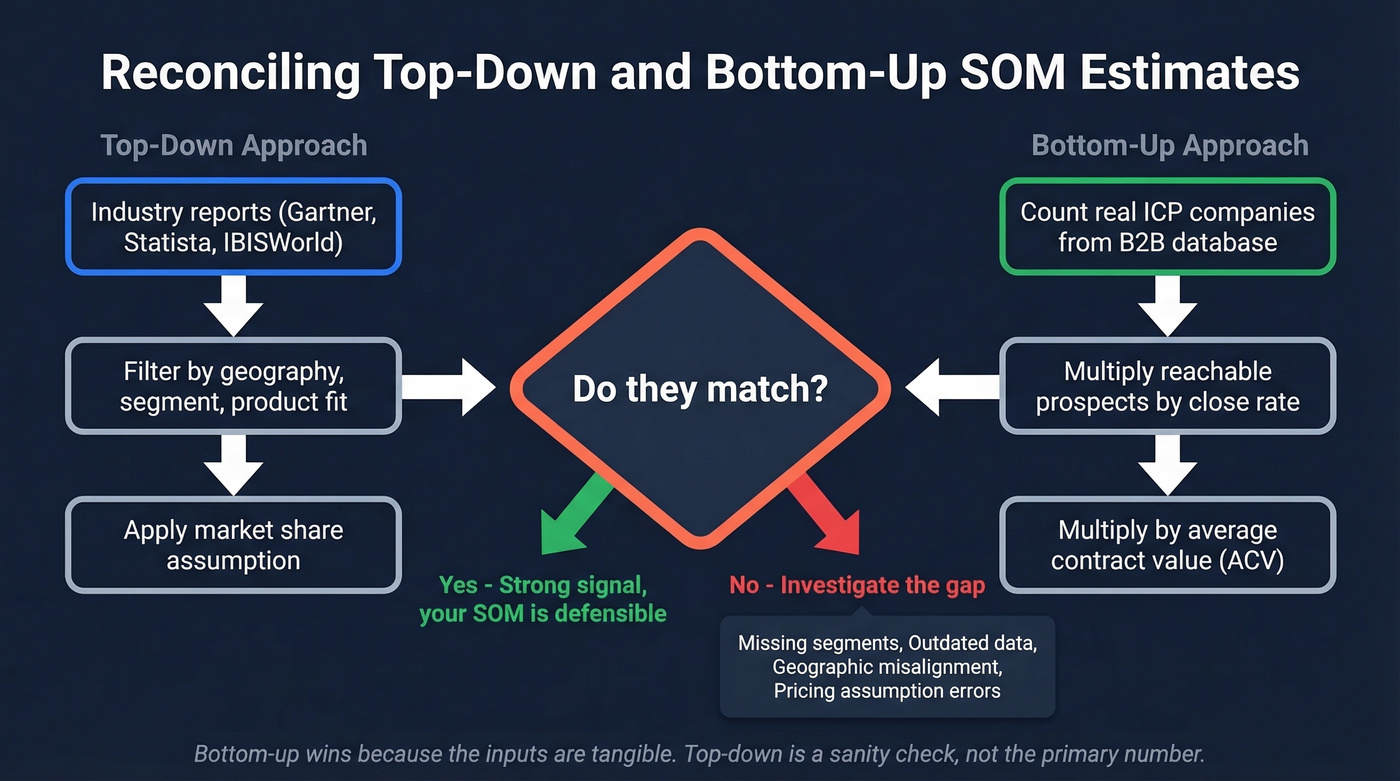
Investors want SOM grounded in actual acquisition data or bottom-up assumptions, not wishful thinking. In our experience, the strongest decks reconcile top-down and bottom-up estimates. When those two approaches diverge wildly - say, top-down suggests a $10B TAM but bottom-up target-company count times contract value yields $400M - that gap demands investigation, not hand-waving. Missing segments, outdated data, geographic misalignment, or pricing assumptions are usually the culprits.
Bottom-up wins because the inputs are tangible: real companies, real deal sizes, real conversion rates. Top-down is useful as a sanity check, not as the primary number.
Let's be honest about something else: if your average deal size is under $10K and you're pre-Series A, you probably don't need a sophisticated TAM model at all. Nail the SOM with a capacity-based estimate, show the math, and move on. Investors at that stage care far more about whether you can close 50 accounts than whether the total addressable market is $8B or $12B.
Turning Your SOM Into Pipeline
Your SOM is only as valuable as your ability to reach those prospects. A $5M obtainable market means nothing if you can't find verified contact data for the buyers in it.
We've watched founders spend weeks perfecting their market sizing only to realize they had no systematic way to contact the companies in their SOM. The bridge between market sizing and pipeline generation is knowing exactly who to reach - by name, by title, by verified email. The founders who nail SOM don't just size the market; they build the contact list the same week. Skip this step and your SOM stays a spreadsheet exercise forever.
If you're building outbound from that list, your next bottleneck is usually sales prospecting techniques and consistent sales follow-up once replies start coming in.
A $5M obtainable market means nothing if 35% of your emails bounce and your domain gets flagged. Prospeo delivers 98% email accuracy on a 7-day refresh cycle - so every prospect in your SOM is actually reachable. At $0.01 per email, validating your entire obtainable market costs less than a team lunch.
Stop sizing a market you can't reach. Start building pipeline from it.
Obtainable Market FAQ
What's the difference between SAM and SOM?
SAM is every customer you could theoretically serve given your product, geography, and channels. SOM is the slice of SAM you can realistically capture in a specific time period given your resources, competition, and go-to-market capacity. SAM defines scope; SOM reflects execution reality.
How do you calculate SOM with zero traction?
Use a capacity-based method: multiply your sales team's realistic output by average deal size and close rate. Alternatively, count reachable ICP companies using a B2B database, apply a conservative conversion rate of 3-6% for outbound, and multiply by ACV. Both approaches avoid the "last year's revenue" dependency that trips up most pre-revenue founders.
What's a realistic SOM for an early-stage startup?
Most early-stage startups capture 1-5% of their TAM in year one. If your SOM exceeds 5% of TAM without extraordinary distribution advantages - a viral product, an existing audience, or a dominant channel partnership - investors will question your assumptions.
What tools help build a bottom-up SOM estimate?
You need market research data from Statista, Gartner, or IBISWorld for top-down sizing and a B2B data platform to count reachable prospects for bottom-up estimation. Filtering by ICP criteria - job title, company size, geography, industry - turns a theoretical market percentage into an auditable prospect count.