The Pipeline Formula Toolkit: 5 Formulas Revenue Teams Actually Need
It's week 8 of the quarter. Your CRO pulls up the pipeline dashboard, squints at a $3.2M number, and asks: "Are we going to hit?" Nobody in the room can answer with confidence - because nobody's running the right math. Customer acquisition costs are up 14% to $2.00 per new ARR dollar according to Benchmarkit's 2026 data, so getting your pipeline formula wrong costs more than ever. A single formula isn't one thing. It's a toolkit, and most revenue teams are using maybe one of the five formulas they need.
What You Need (Quick Version)
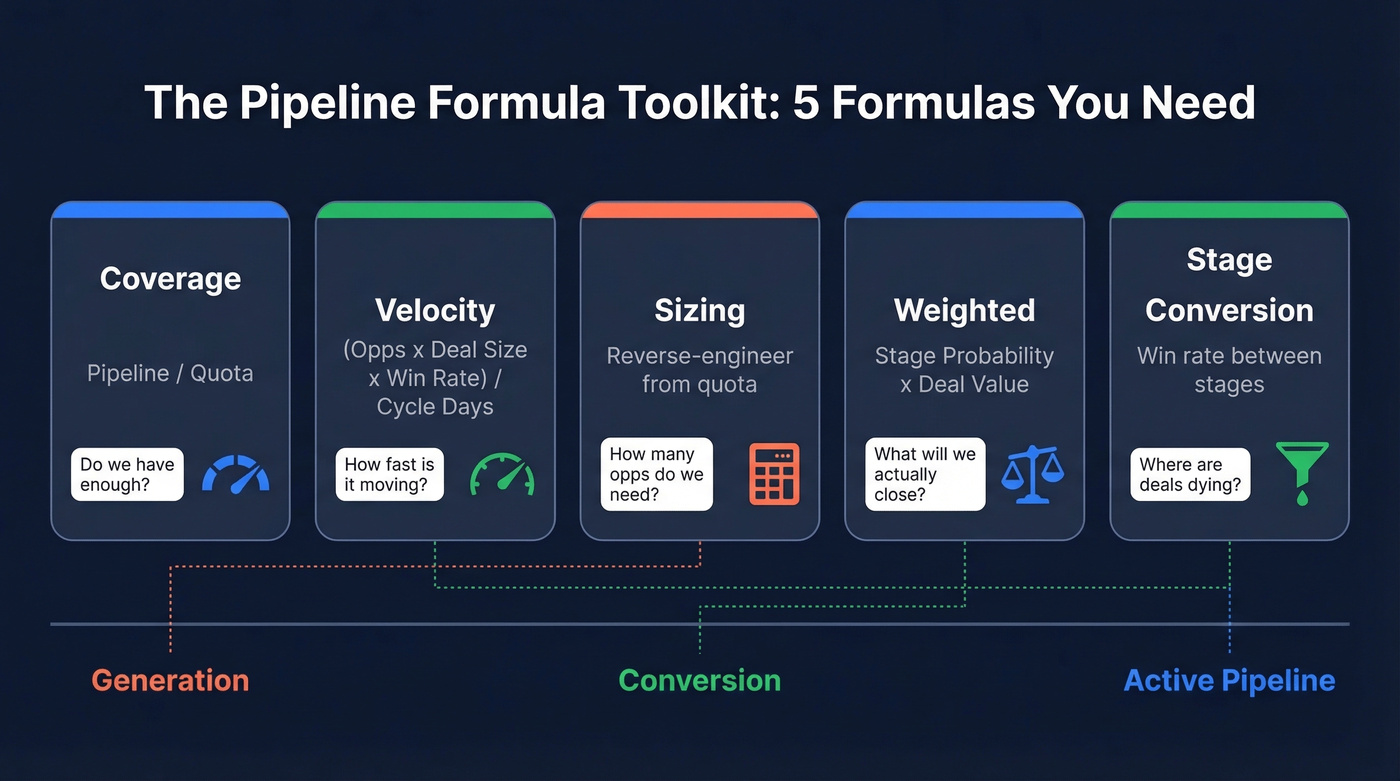
Missing quota? Coverage formula. Hitting quota slowly? Velocity. Deals stalling mid-funnel? Stage conversion. David Sacks frames pipeline metrics in three buckets - generation, conversion, and active pipeline - and each formula below maps to one of those buckets.
| Formula | One-Line Definition | When to Use |
|---|---|---|
| Coverage | Pipeline / Quota | Answering "do we have enough?" |
| Velocity | Daily $ throughput | Answering "how fast is it moving?" |
| Sizing | Reverse-engineer from quota | Planning how many opps to create |
| Weighted | Stage probability x deal value | Forecasting expected revenue |
| Stage Conversion | Conversion rate between stages | Diagnosing where deals die |
Pipeline Coverage Formula
The Basic Math
Total Pipeline / Sales Target = Coverage Ratio. If you've got $4M in pipeline against a $1M quota, that's 4x coverage.
Outreach's coverage data breaks it down by segment: enterprise teams need 3-5x, mid-market 2.5-4x, and high-velocity SMB motions can get away with 2-3x. The difference comes down to win rates - enterprise cycles are longer, more deals die, and you need a bigger cushion.
Coverage above 5x is also a red flag. It usually signals poor qualification, where reps stuff the pipeline with deals that'll never close. Finance teams watch this number too: if coverage drops below 2x, it's not just a sales problem, it's a revenue recognition risk.
Weighted vs. Unweighted
Unweighted coverage treats every deal as equally likely to close. That's a fantasy. A $200K deal in discovery and a $200K deal in contract review aren't the same thing.
The numbers tell the story. Fullcast's 2026 Benchmarks Report found that high-ICP accounts represent only 23% of total pipeline for many organizations. The other 77% is filler that inflates your coverage ratio without actually moving the number. Weighted coverage - where you multiply each deal's value by its stage-based close probability - gives you a far more honest picture.
The "3x rule" everyone throws around assumes a ~33% close rate. Fine for a back-of-napkin check, but it's fantasy for most enterprise teams running 15-20% win rates.
Dynamic Targets by Quarter Stage
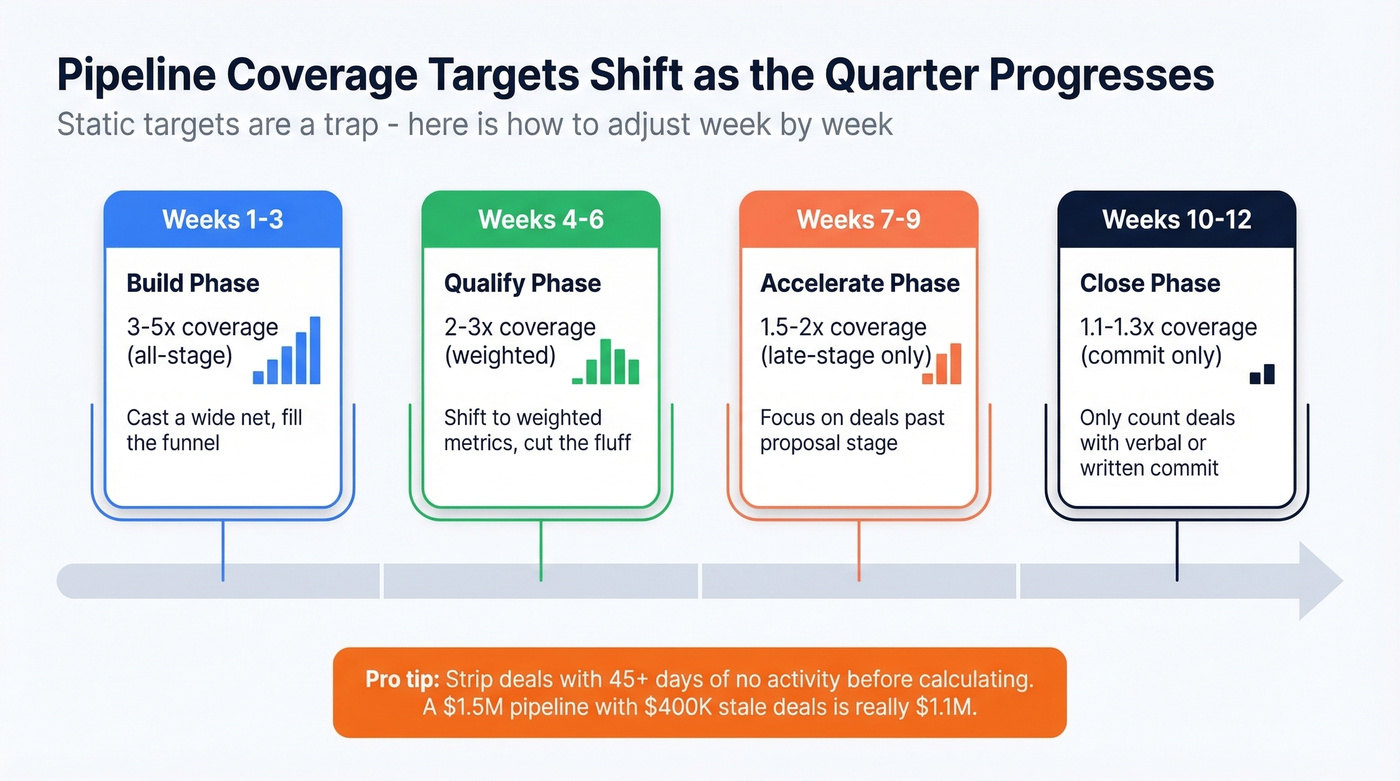
Static coverage targets are another trap. A 4x ratio in week 2 means something very different than 4x in week 10. Salesmotion's framework adjusts targets as the quarter progresses:
| Quarter Stage | Enterprise | Mid-Market |
|---|---|---|
| Week 1-3 | 3-4x (all-stage) | 4-5x (all-stage) |
| Week 4-6 | 2-3x (weighted) | 2-3x (weighted) |
| Week 7-9 | 1.5-2x (late-stage) | 1.5-2x (late-stage) |
| Week 10-12 | 1.1-1.3x (commit) | 1.1-1.3x (commit) |
Don't forget stale deals. If your $1.5M pipeline includes $400K in deals that haven't had activity in 45+ days, your real coverage is 2.75x - not 3.75x. Strip the dead weight before you run the math.
Sales Pipeline Velocity Formula
The Math + Worked Example
(Number of Opportunities x Average Deal Size x Win Rate) / Sales Cycle Length in Days = Daily Dollar Velocity
Walk through it: 60 qualified opportunities, a $5,000 average deal size, a 20% win rate, and a 30-day sales cycle. That's (60 x $5,000 x 0.20) / 30 = $2,000/day in pipeline throughput.
Here's the thing: if you only track one metric, make it velocity. Coverage tells you whether you have enough. Velocity tells you whether it's actually moving - and forces you to think about all four levers at once. A team with 5x coverage and $400/day velocity is in worse shape than a team with 3x coverage and $2,000/day velocity.
2026 Benchmarks
FirstPageSage analyzed 247 B2B organizations across North America. Median velocity by industry:
| Industry | Deal Size | Win Rate | Cycle (Days) | Median Velocity/Day |
|---|---|---|---|---|
| SaaS & Tech | $12,400 | 22% | 67 | $1,847 |
| Financial Services | $31,200 | 18% | 89 | $2,134 |
| Healthcare | $18,700 | 25% | 72 | $1,523 |
| Manufacturing | $47,800 | 19% | 124 | $1,289 |
| Professional Services | $8,900 | 28% | 51 | $876 |
| Real Estate | $89,300 | 16% | 147 | $2,456 |
| Marketing & Ads | $15,200 | 24% | 58 | $743 |
Velocity also scales predictably with company size:
| Company Revenue | Median Velocity/Day |
|---|---|
| $1M-$5M | $687 |
| $5M-$25M | $1,303 |
| $25M-$100M | $3,484 |
| $100M-$500M | $6,919 |
| $500M+ | $12,945 |
The jump isn't because larger companies sell better - deal sizes and opportunity volume compound.
For B2B SaaS specifically, Optifai's benchmark across 939 companies puts the median at $8,200/day. Top-quartile teams hit $19,500+/day. Bottom quartile sits below $2,800/day. That's a 2.5x spread between the best and worst performers in the same market, and advanced teams break velocity down by acquisition channel to identify which sources produce the fastest-moving deals.
Which Lever Moves Velocity Most?
Not all levers are equal. Optifai's analysis ranks them:
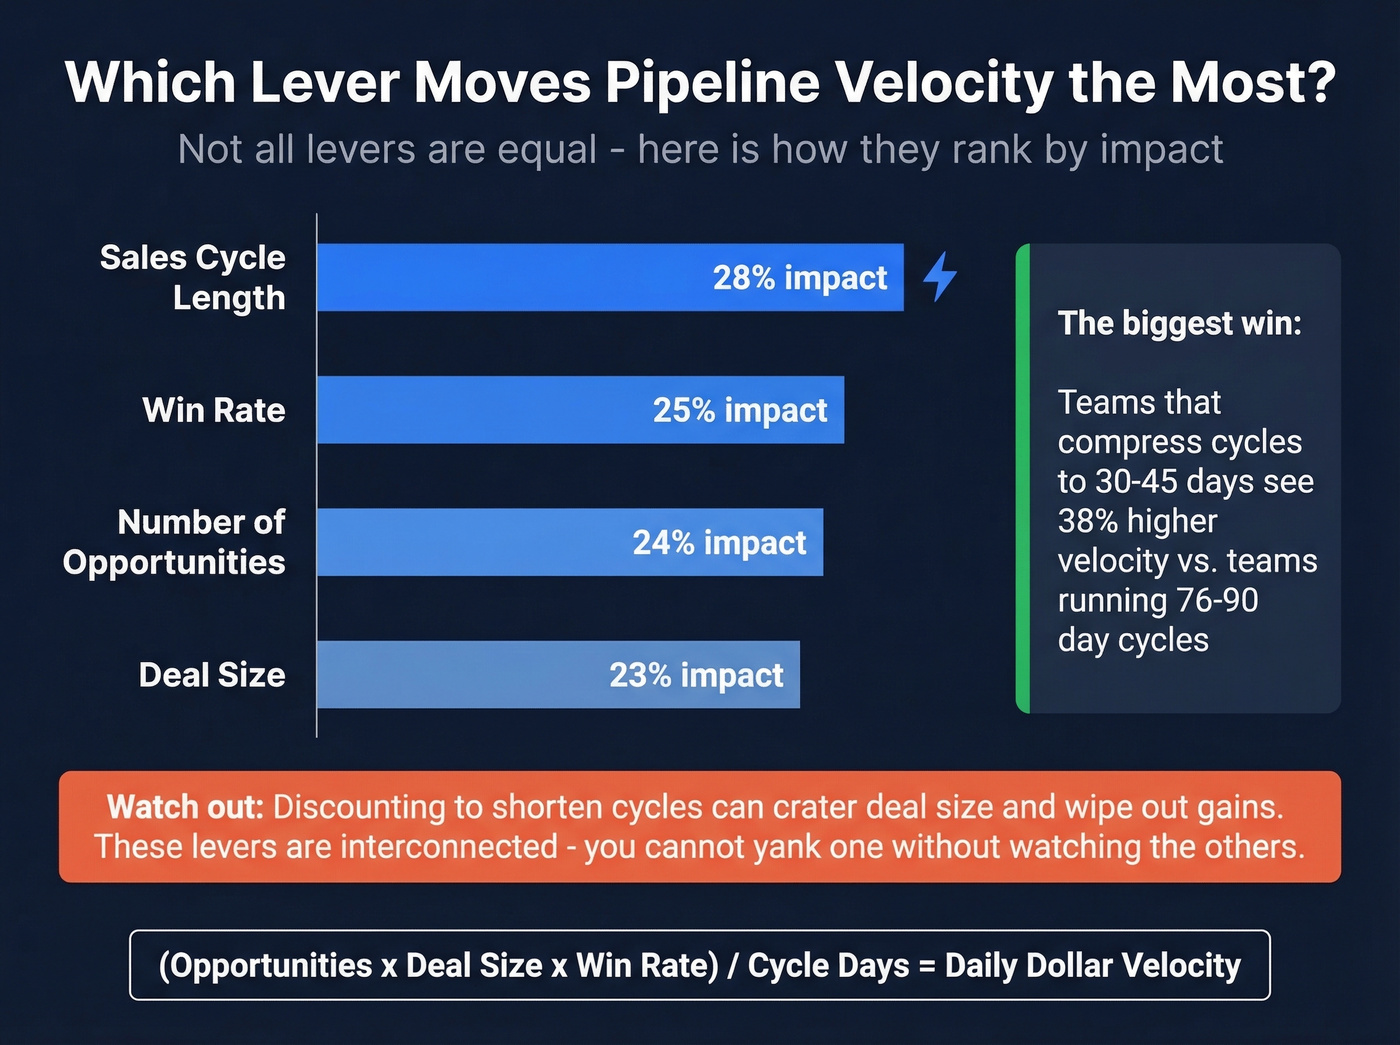
- Sales cycle length - 28% impact
- Win rate - 25%
- Number of opportunities - 24%
- Deal size - 23%
Shortening your cycle is the single biggest lever. Organizations that compress to 30-45 day cycles see a 38% velocity improvement over those running 76-90 day baselines.
But there's a trap: optimizing one variable while another drops can net-negative your velocity. We've seen teams discount aggressively to shorten cycles, only to watch deal size crater enough to wipe out the gains. The levers are interconnected - you can't yank one without watching the others.
Pipeline velocity depends on qualified opportunities - and qualified opportunities depend on verified contact data. Prospeo gives you 300M+ profiles with 98% email accuracy and 30+ filters including buyer intent and technographics, so every opportunity you create actually moves.
Stop inflating coverage ratios with dead leads. Start with data that connects.
Pipeline Sizing Formula
This formula answers "how many opportunities do I actually need to create?" It's reverse-engineering, and it's more straightforward than most teams expect.
Step 1: Revenue target / Average deal size = Deals needed. ($500K / $5,000 = 100 deals.)
Step 2: Revenue target / Win rate = Required pipeline value. ($500K / 0.25 = $2M in pipeline.)
Step 3: Deals needed / Win rate = Recommended opportunities in progress. (100 / 0.25 = ~400 opps.)
Step 4: Factor in your sales cycle. With a 60-day cycle in a 90-day quarter, your latest start window is day 30 - any opportunity created after that won't close in time. That gives you roughly 4.3 weeks to generate those opportunities, which means ~93 new qualified opps per week.
Ninety-three qualified opportunities per week is a volume problem that requires verified contact data at scale. Tools like Prospeo, with 300M+ profiles and 30+ search filters including buyer intent and technographics, help keep opportunity quality high while hitting that kind of volume.
Your cycle length matters enormously here. Factors.ai maps the relationship between ACV and expected cycle:
| ACV Range | Typical Cycle | Segment Benchmark |
|---|---|---|
| Under $2K | ~14 days | SMB: ~40 days to first revenue |
| $2K-$5K | ~30 days | SMB/Mid-market overlap |
| $5K-$25K | ~90 days | Mid-market: 60-120 days |
| $25K-$100K | 90-180 days | Enterprise: 170+ days |
| $100K+ | 3-9 months | Enterprise: 170+ days |
If you're plugging a 30-day cycle into your sizing formula but your actual ACV implies a 90-day cycle, you'll underestimate required pipeline by 3x.
Weighted Pipeline Formula
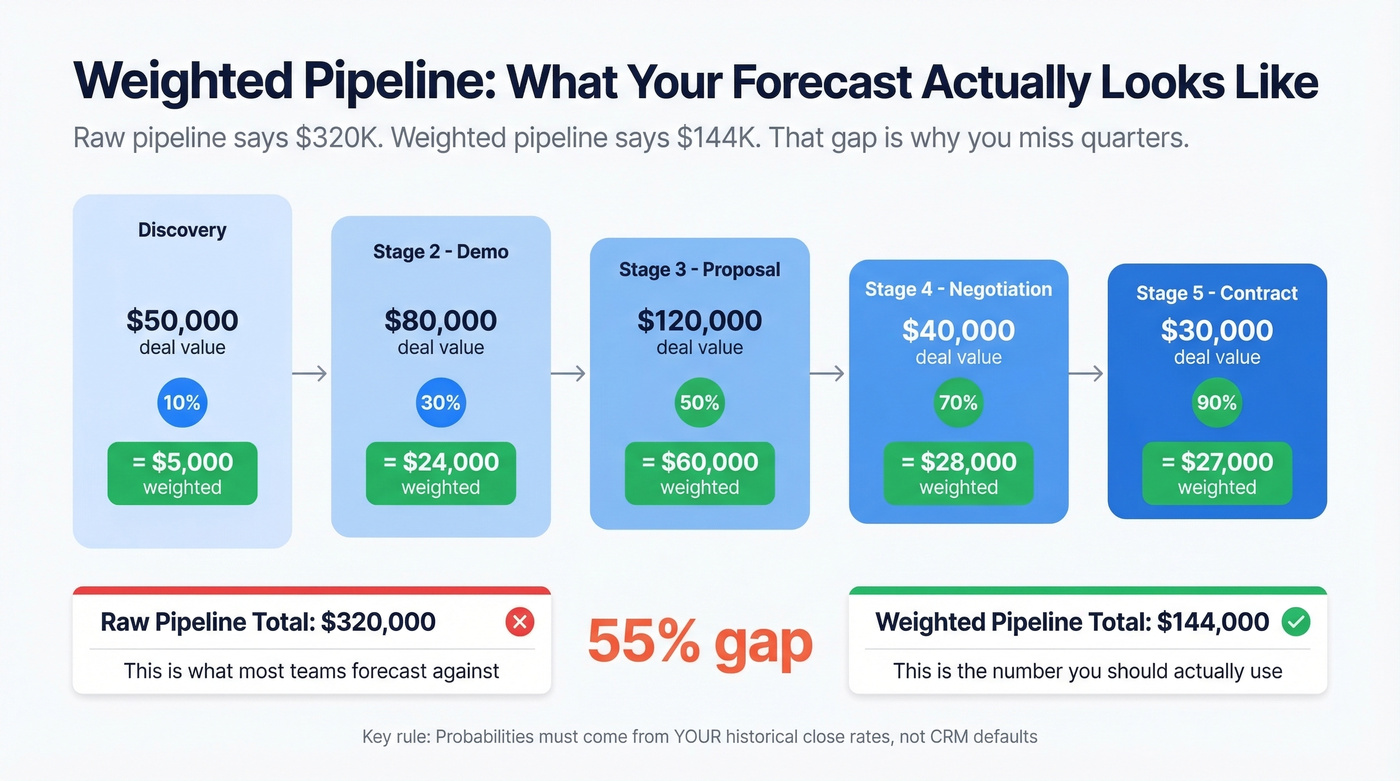
Stage Probability x Deal Value = Weighted Value. Sum across all deals for your forecast.
Use this when you need a revenue forecast more honest than raw pipeline totals. Skip it if your CRM stage probabilities are still set to the defaults Salesforce shipped with - those numbers are meaningless unless they reflect your actual historical conversion rates. Also skip it if you have fewer than 50 closed deals to calculate reliable stage probabilities from.
Let's break this down with a worked example:
| Stage | Deal Value | Probability | Weighted Value |
|---|---|---|---|
| Discovery | $50,000 | 10% | $5,000 |
| Demo | $80,000 | 30% | $24,000 |
| Proposal | $120,000 | 50% | $60,000 |
| Negotiation | $40,000 | 70% | $28,000 |
| Contract | $30,000 | 90% | $27,000 |
| Total | $320,000 | $144,000 |
Your raw pipeline says $320K. Your weighted pipeline says $144K. That's the number you should forecast against - and the gap between those two figures is exactly why unweighted coverage ratios mislead.
The key discipline: probabilities must come from YOUR data. Pull 12 months of closed-won and closed-lost deals, calculate the actual conversion rate at each stage, and use those. A deal in "Proposal Sent" closes 40% of the time for one team and 15% for another.
PandaDoc offers a useful heuristic: winning opportunities average 18 days in pipeline, while deals sitting 45+ days are statistically unlikely to close. If a deal's been in "Negotiation" for two months, your weighted formula should reflect that reality - not the optimistic probability your rep assigned when they moved it there.
Why Pipeline Formulas Fail
The CRM Trust Crisis
Every formula in this guide assumes your CRM data is accurate. For most teams, it isn't.
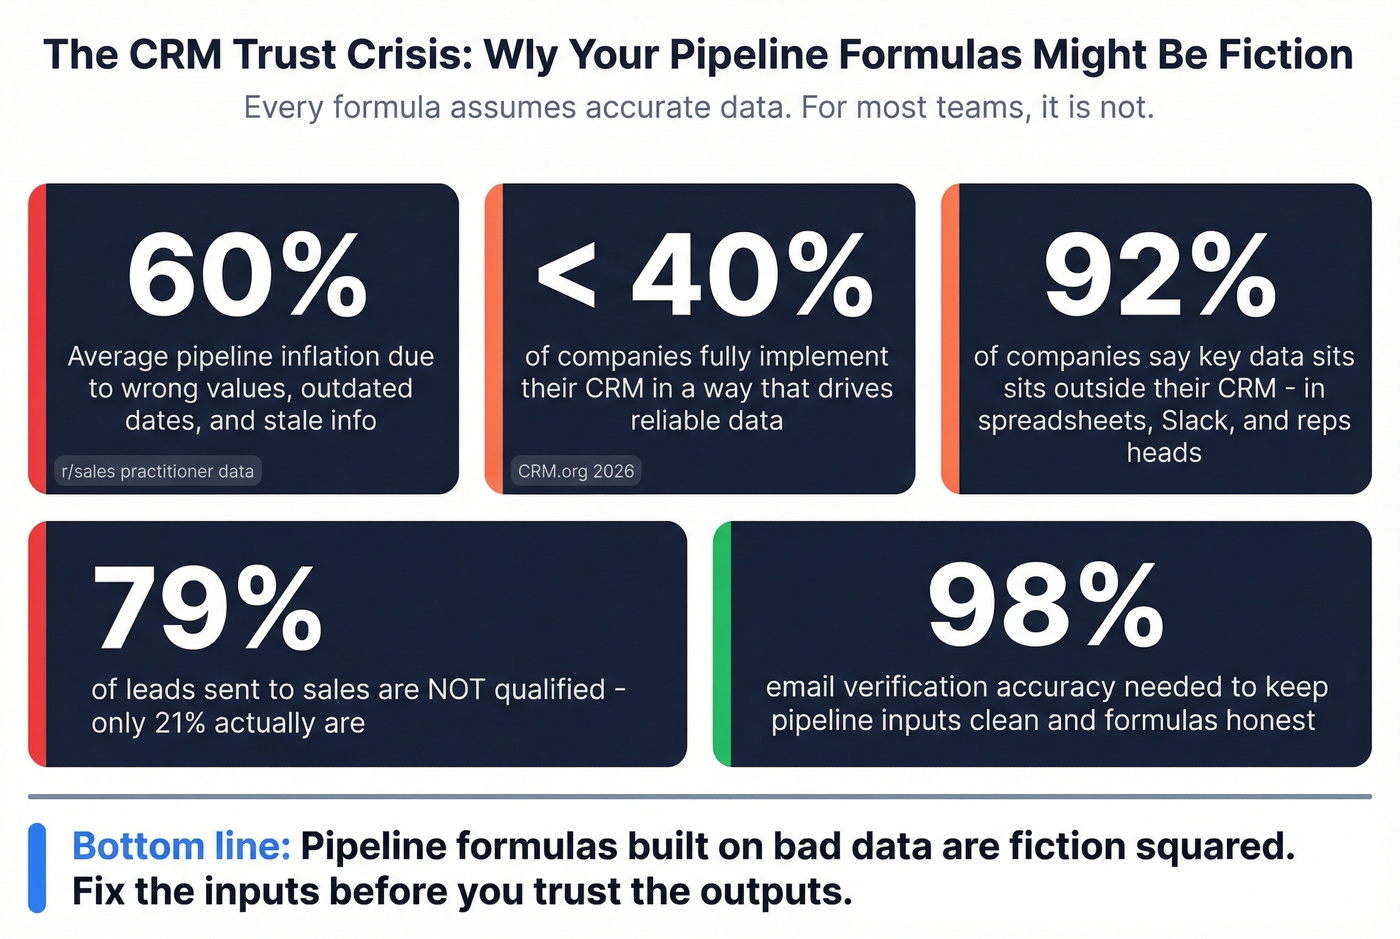
According to CRM.org, about 91% of companies with 11+ employees use a CRM. But less than 40% fully implement it in a way that drives reliable data flow. Meanwhile, 92% of companies acknowledge that key data sits outside their centralized systems - in spreadsheets, Slack threads, and reps' heads. And 70% struggle to integrate sales plays into their CRM and revenue tech stack.
One Reddit practitioner in semiconductor sales put it bluntly: their pipeline was "realistically inflated by about 60%" due to wrong values, outdated dates, and stale information. The consensus on r/sales is that most pipeline numbers are fiction - and the formulas built on top of them are fiction squared.
Bad Data Breaks Every Formula
61% of B2B marketers send all leads directly to sales, but only 21% are actually qualified. When unqualified leads inflate your opportunity count, every formula downstream produces garbage. Your coverage ratio looks healthy. Your velocity calculation looks reasonable. And then you miss the quarter anyway.
Contact data quality is the prerequisite for every pipeline formula to work. If your bounce rate is 35%, your velocity calculation gets distorted - those "opportunities" never had a real conversation. Snyk saw this firsthand: after switching to Prospeo, their bounce rate dropped from 35-40% to under 5%, generating 200+ new opportunities per month. That kind of data accuracy - 98% verified emails refreshed every 7 days - is what keeps the inputs powering your formulas clean.

Sizing your pipeline at 400 opps per quarter means nothing if half your contacts bounce. Prospeo's 7-day data refresh and 5-step verification keep bounce rates under 4% - so your pipeline math actually holds up at week 10.
Feed your pipeline formula with data that won't decay mid-quarter.
Tracking Pipeline Metrics
The cadence matters as much as the formula. FirstPageSage's data is stark: teams that track pipeline metrics weekly see 34% revenue growth and 87% forecast accuracy. Teams doing ad-hoc reviews? 11% growth and 52% accuracy. That's not a marginal difference - it's the gap between a predictable revenue engine and a guessing game.
In our experience, this cadence works:
- Weekly: Pipeline coverage review + velocity snapshot. Flag stale deals with no activity in 30+ days. Update stage probabilities for any deal that's moved. (If you need a broader view, track pipeline health alongside coverage.)
- Monthly: Velocity trend analysis. Are you accelerating or decelerating? Which lever changed? Tie changes back to funnel metrics so you can see where throughput is actually leaking.
- Quarterly: Coverage recalibration. Adjust your required ratios based on last quarter's actual win rates by segment. Reset stale-deal thresholds. This is also where sales operations metrics help you standardize definitions across teams.
Look, most teams skip the weekly review because it feels like overhead. It's not. It's the single highest-ROI 30 minutes your revenue team spends each week. The formulas only work if the inputs stay fresh.
FAQ
What's a good pipeline coverage ratio?
Enterprise teams need 3-5x, mid-market 2.5-4x, and SMB 2-3x. Weight by stage probability and exclude stale deals for an accurate picture. A "healthy" 4x ratio with 60% stale pipeline is really 1.6x.
How do you calculate pipeline velocity?
(Number of Opportunities x Average Deal Size x Win Rate) / Sales Cycle Length in Days. The result is your daily dollar throughput. B2B SaaS median is $8,200/day across 939 companies benchmarked by Optifai.
What's a healthy pipeline size?
Reverse-engineer from quota: Revenue Target / Win Rate = Required Pipeline. A $500K target with a 25% win rate needs $2M in pipeline. Factor in your sales cycle to determine weekly opportunity creation targets.
Which pipeline formula matters most?
Velocity. It forces you to optimize all four variables simultaneously - opportunities, deal size, win rate, and cycle length. Coverage tells you if you have enough; velocity tells you if it's moving. Teams tracking velocity weekly see 34% higher revenue growth.
How do you keep pipeline data accurate?
Weekly CRM hygiene reviews, stage-aging alerts for deals past 45 days, and verified contact data feeding the top of funnel. A 7-day data refresh cycle and 98% email accuracy keep bounce rates under 5%, so the inputs powering your formulas stay clean.